. 2020 Jan 17;21(2):628.
doi: 10.3390/ijms21020628.

Placenta-Specific Genes, Their Regulation During Villous Trophoblast Differentiation and Dysregulation in Preterm Preeclampsia

Affiliations

Placenta-Specific Genes, Their Regulation During Villous Trophoblast Differentiation and Dysregulation in Preterm Preeclampsia

Andras Szilagyi et al. Int J Mol Sci. .

Abstract

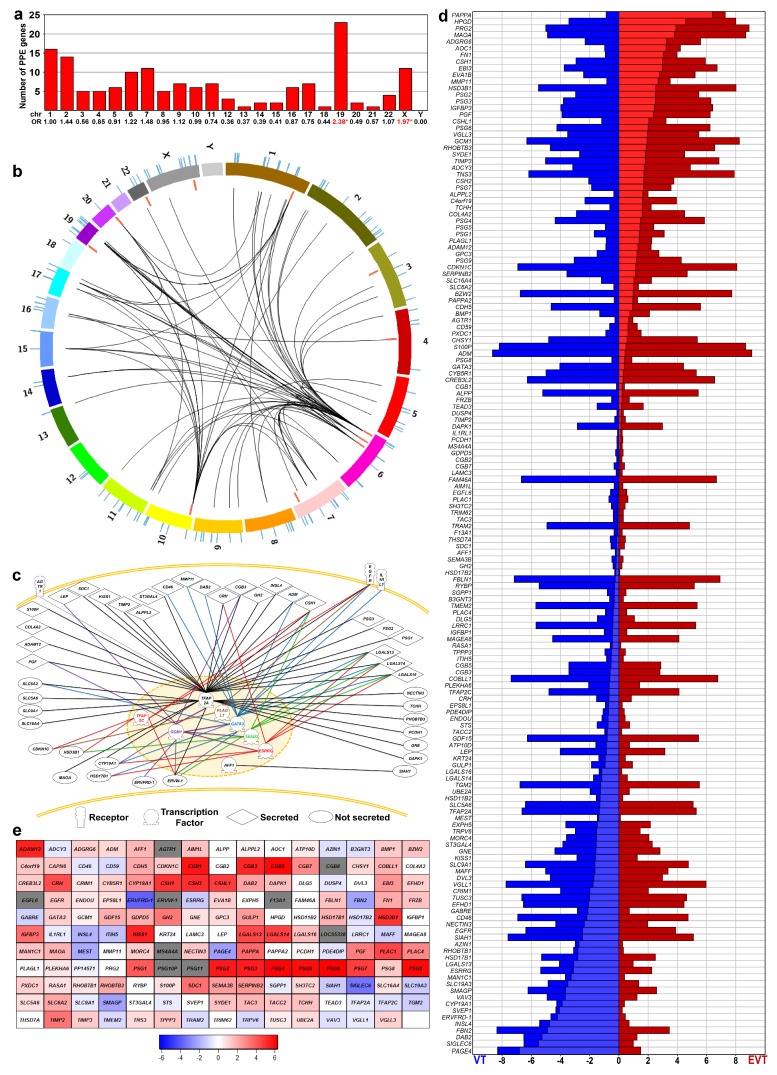
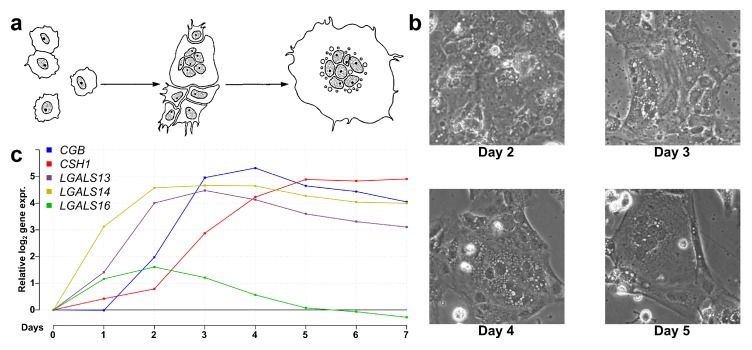
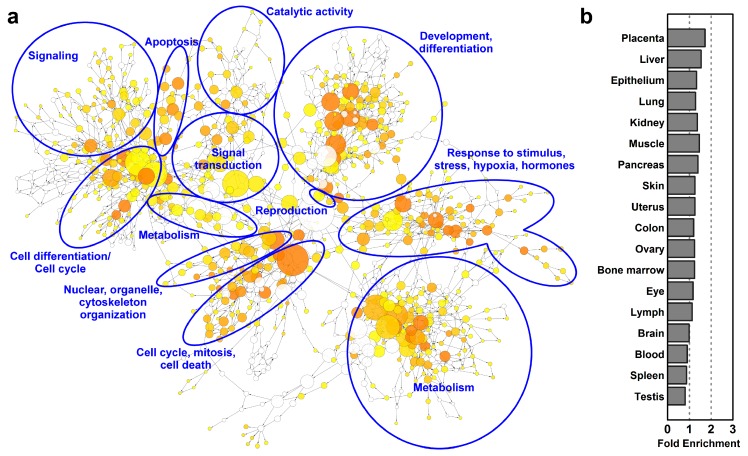
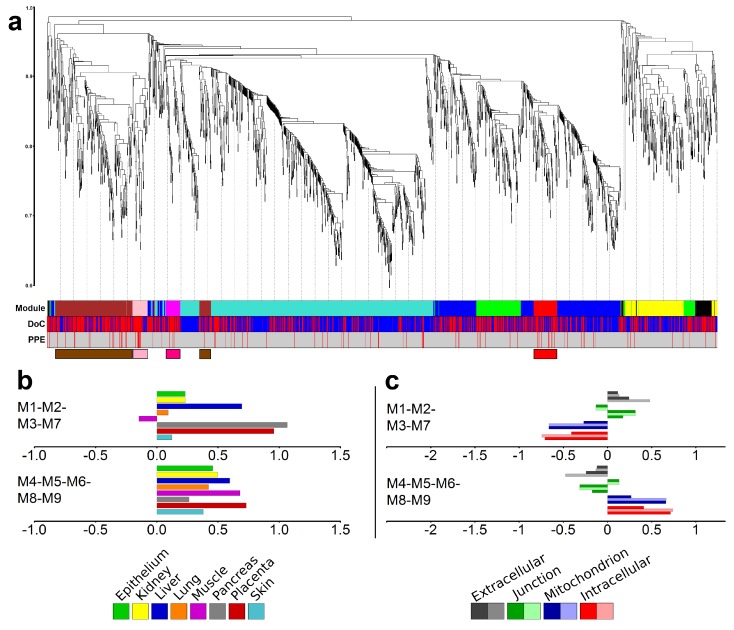
The human placenta maintains pregnancy and supports the developing fetus by providing nutrition, gas-waste exchange, hormonal regulation, and an immunological barrier from the maternal immune system. The villous syncytiotrophoblast carries most of these functions and provides the interface between the maternal and fetal circulatory systems. The syncytiotrophoblast is generated by the biochemical and morphological differentiation of underlying cytotrophoblast progenitor cells. The dysfunction of the villous trophoblast development is implicated in placenta-mediated pregnancy complications. Herein, we describe gene modules and clusters involved in the dynamic differentiation of villous cytotrophoblasts into the syncytiotrophoblast. During this process, the immune defense functions are first established, followed by structural and metabolic changes, and then by peptide hormone synthesis. We describe key transcription regulatory molecules that regulate gene modules involved in placental functions. Based on transcriptomic evidence, we infer how villous trophoblast differentiation and functions are dysregulated in preterm preeclampsia, a life-threatening placenta-mediated obstetrical syndrome for the mother and fetus. In the conclusion, we uncover the blueprint for villous trophoblast development and its impairment in preterm preeclampsia, which may aid in the future development of non-invasive biomarkers for placental functions and early identification of women at risk for preterm preeclampsia as well as other placenta-mediated pregnancy complications.

Keywords: development; immune tolerance; metabolism; microarray; omics; transcriptional network.


Conflict of interest statement

The authors declare no conflicts of interest. The funders had no role in the design of the study; in the collection, analyses, or interpretation of data; in the writing of the manuscript, or in the decision to publish the results.

Figures

Figure 1
Figure 1
Predominantly placenta-expressed genes (PPE). (a) Human predominantly placenta-expressed (PPE genes identified by analyzing BioGPS microarray data. The bar chart displays the chromosomal distribution of PPE genes. Numbers denote the odds ratio (OR) of chromosomal PPE gene enrichment; stars depict significance. (b) Circos visualization of the genomic localization of PPE genes. Colored arcs indicate chromosomes; lines in the outer and inner circles show the localization of PPE genes. Red lines depict PPE transcription regulatory (TR) genes, while blue lines indicate PPE target genes. Curved black lines demonstrate the functional connections between seven TR genes and 42 target genes. The enrichment of Chr6 for PPE TR genes (OR = 8.229, p = 0.029) and Chr19 for PPE target genes (OR = 2.324, p = 0.003) is clearly visible. (c) Functional connection between PPE genes. Network connections of various TR genes with target genes were depicted with different line colors using Pathway Studio. (d) Expression of PPE genes in villous (VT) and extravillous (EVT) trophoblasts. Horizontal bars show the absolute expression (compared to background signal) based on microarray data from Apps et al. [94]. Red represents EVT while blue depicts VT gene expression; lighter red and blue indicate the difference between the absolute expression values of EVT and VT. The vertical ordering of genes was based on the EVT-VT expression difference. (e) PPE gene expression during VT differentiation. Microarray data was obtained from primary VTs isolated from third trimester normal placentas (n = 3) and differentiated during a seven-day period. The largest differences in gene expression compared to Day 0 were visualized on the heat map. The color code depicts log2-fold change values; blue: down-regulated, red: up-regulated, grey: no available data.
Figure 2
Figure 2
Microarray validation with qRT-PCR. (a) Schematic visualization of villous trophoblast differentiation adapted with permission from Hubert et al. [97]. (b) Brightfield images (250×) of differentiating and fusing villous trophoblasts on days 2, 3, 4, and 5 of differentiation. (c) Line graph showing the relative gene expression change of five genes with predominant placental expression (PPE) from day 0 to day 7 during trophoblast differentiation.
Figure 3
Figure 3
Gene-regulatory networks, biological processes and tissue enrichments in differentiating villous trophoblasts. (a) The network of biological processes enriched among differentially expressed (DE) genes was created by BiNGO and visualized with Cytoscape. Sizes of the circles relate to the number of genes involved in the biological processes and colors refer to p-values. The groups of most enriched biological processes were manually circled and labeled. The color code depicts p-values. (b) The UniProt tissue enrichments among DE genes were assessed with DAVID and are represented in a bar chart in the order of their enrichment significance value.
Figure 4
Figure 4
Modules of co-expressing genes. (a) Weighted co-expression network analysis (WGCNA) of differentially expressed (DE) genes identified five major and four minor modules. The y-axis represents the distance metric (1-TOM); the three levels of colored bars below the chart indicate the identified modules, the direction of change of expression (DoC; red: up-regulated, blue: down-regulated), and predominantly placental expressed (PPE) genes. The four modules enriched in PPE genes are depicted in the bottom with module-colored boxes. (b) Tissue enrichments of the combination of placental (M1-M2-M3-M7) and non-placental (M4-M5-M6-M8-M9) modules as analyzed with the DAVID bioinformatics tool. (c) Cellular component enrichments for the same two module groups as analyzed by DAVID.
Figure 5
Figure 5
Gene perturbation analysis by iPathwayGuide: Perturbation of non-placental-module genes in the cell cycle pathway (KEGG:04110). (a) The pathway diagram is overlaid with the computed perturbation of each gene. The perturbation accounts both for the gene’s measured fold change and for the accumulated perturbation from any upstream genes. The highest negative perturbation (−7.7) is shown in dark blue, while dark red represents the highest positive perturbation (9.8). Note: For legibility, one gene may be represented in multiple places in the diagram and one box may represent multiple genes in the same gene family. For each gene family, the color corresponding to the gene with the highest absolute perturbation is displayed. (b) Gene perturbation bar plot. All the genes in the cell cycle pathway are ranked based on their absolute perturbation values. For each gene, the signed perturbation is represented with negative values in blue and positive values in red. The box and whisker plot on the left summarizes the distribution of all gene perturbations in this pathway. (c,d) show placental-module genes perturbed in the neuroactive ligand-receptor interaction pathway (KEGG:04080) and the mineral absorption pathway (KEGG:04978), respectively. Figures were generated by iPathwayGuide.
Figure 6
Figure 6
Time course of gene expression during villous trophoblast differentiation. The number of up- and down-regulated genes during differentiation was assessed by comparing mean gene expressions on a given day versus day 0 (a) and versus the previous day (b). The time course of expression changes, measured as the absolute value of the log2 fold change, of genes in placental (c) and non-placental (d) gene modules. The colors correspond to the module colors defined in Figure 4. The average expression time courses for the two module groups are shown in (c,d) with thick lines and are compared directly in (e). See Figure S6 for expression time courses for each gene module.
Figure 7
Figure 7
Genes with high expression change (HEC). (a) The graphs show the temporal expression pattern of genes in the clusters. Individual gene expression data (log2-fold change compared to day 0 is depicted with light blue lines, while mean cluster gene expression data is shown with dark blue lines. Cluster enrichments were assessed using DAVID, the significance threshold was set at FDR < 0.2. The biologically most relevant, terms were listed below the clusters. (b) The common regulators of clusters were analyzed using Pathway Studio 9.0, the significance threshold was set at p < 0.05. The percentage of HEC genes (“All”) or genes in clusters (C1–C5) regulated by various environmental stimuli or physiological regulators are depicted in heat maps. The color code depicts percentages.
Figure 8
Figure 8
The expression and connectivity of differentially expressed transcription regulatory genes during villous trophoblast differentiation. Scatter plots show the relation of connectivity and expression change of transcription regulatory (TR) genes on day 1 (a) and on days 2 to 7 (b) of trophoblast differentiation. A co-expression network was calculated from the co-expression matrix of 220 differentially expressed TR genes and all 1937 differentially expressed genes, keeping only connections with a Pearson correlation coefficient r ≥ 0.9. Connectivity for each TR gene was defined as the number of its neighbors in the co-expression network. Fold changes in the expression of TR genes were calculated between each day and day 0 of the seven-day experimental differentiation period. Differentially expressed TR genes (|FC| ≥ 1 on any day) are shown in their respective module colors. (b) only shows TR genes not differentially expressed on Day 1.
Figure 9
Figure 9
Transcription factors regulating key target genes in villous trophoblast differentiation. The transcription factors regulating the top 20 (defined by absolute fold change) DE genes in both the placental and the non-placental module groups were determined from DNaseI footprinting data as described in Materials and methods. Target genes (placental and non-placental) are represented by rounded boxes. Box size represents absolute log2 fold change and the box color represents log2 fold change with a color scale from blue through red indicating negative through positive values. Target genes that are transcription regulatory (TR) genes are highlighted in green. Transcription factors are represented by ellipses, where differentially expressed TRs are colored by log2 fold change as above. Arrows indicate binding of the transcription factor to a promoter region of the target gene but are only shown if the absolute gene expression correlation coefficient between them is > 0.6. Thicker arrows indicate higher correlation. Arrow color indicates the sign of the correlation coefficient (blue: negative; red: positive). (Figure created with Tabnetviz (git.io/tabnetviz)).
Figure 10
Figure 10
Co-expression network of transcription regulatory genes involved in villous trophoblast differentiation and preterm preeclampsia. The co-expression network of 220 DE transcription regulatory genes is shown; genes with an absolute expression correlation coefficient >0.9 are connected. The 20 genes that are also differentially expressed in preeclampsia [57] are shown in larger size. (a) The relationship of villous trophoblast (VT) differentiation gene modules and preterm preeclampsia DE gene modules. Node color represents VT differentiation gene module (colors are defined in Figure 4), while border color of the large nodes represents preeclampsia gene module as defined earlier [57]. (b) Relationship between fold changes during VT differentiation and in preterm preeclampsia. Node color indicates the log2 fold change of genes in VT differentiation, while border color of the large nodes indicates log2 fold change in preterm preeclampsia [57]. (Visualizations created with Tabnetviz (git.io/tabnetviz)).

References

    1. Burton G.J., Jauniaux E. What is the placenta? Am. J. Obstet. Gynecol. 2015;213:S6. doi: 10.1016/j.ajog.2015.07.050. - DOI - PubMed
    1. Ahmed M.S., Aleksunes L.M., Boeuf P., Chung M.K., Daoud G., Desoye G., Díaz P., Golos T.G., Illsley N.P., Kikuchi K., et al. IFPA Meeting 2012 Workshop Report II: epigenetics and imprinting in the placenta, growth factors and villous trophoblast differentiation, role of the placenta in regulating fetal exposure to xenobiotics during pregnancy, infection and the placenta. Placenta. 2013;34:S6–S10. doi: 10.1016/j.placenta.2012.11.020. - DOI - PMC - PubMed
    1. Bischof P., Irminger-Finger I. The human cytotrophoblastic cell, a mononuclear chameleon. Int. J. Biochem. Cell Biol. 2005;37:1–16. doi: 10.1016/j.biocel.2004.05.014. - DOI - PubMed
    1. Mayhew T.M. Turnover of human villous trophoblast in normal pregnancy: What do we know and what do we need to know? Placenta. 2014;35:229–240. doi: 10.1016/j.placenta.2014.01.011. - DOI - PubMed
    1. Aronow B.J., Richardson B.D., Handwerger S. Microarray analysis of trophoblast differentiation: Gene expression reprogramming in key gene function categories. Physiol. Genom. 2001;6:105–116. doi: 10.1152/physiolgenomics.2001.6.2.105. - DOI - PubMed

Substances