. 2020 Jan 19;21(2):656.
doi: 10.3390/ijms21020656.

Comprehensive Analyses of Cytochrome P450 Monooxygenases and Secondary Metabolite Biosynthetic Gene Clusters in Cyanobacteria

Affiliations

Comprehensive Analyses of Cytochrome P450 Monooxygenases and Secondary Metabolite Biosynthetic Gene Clusters in Cyanobacteria

Makhosazana Jabulile Khumalo et al. Int J Mol Sci. .

Abstract

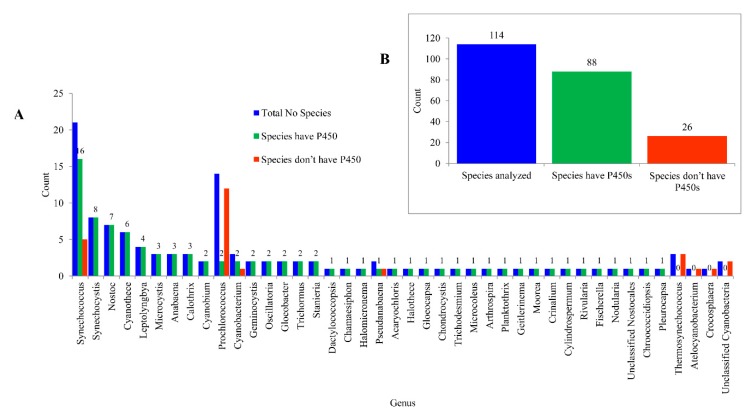
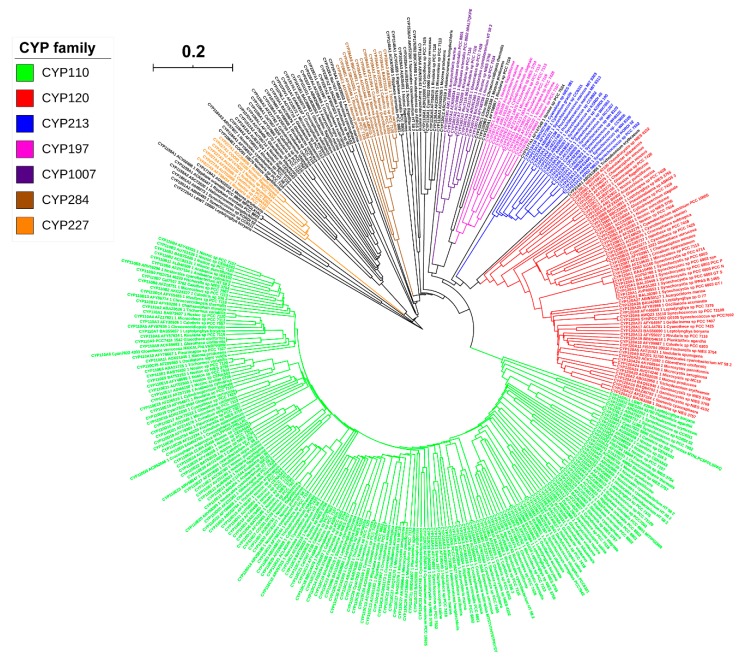
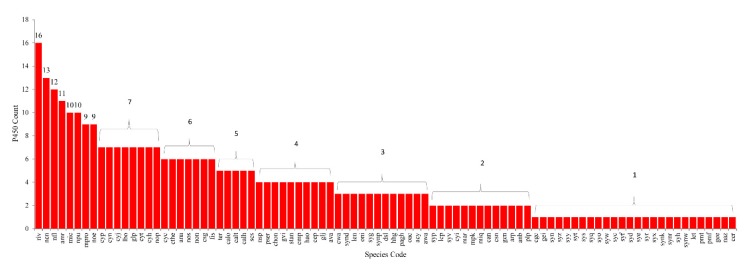
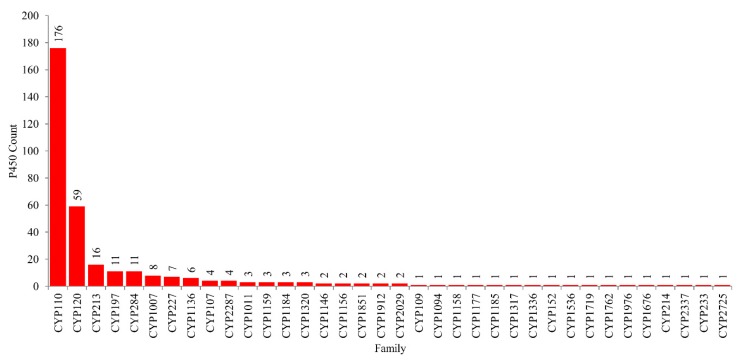
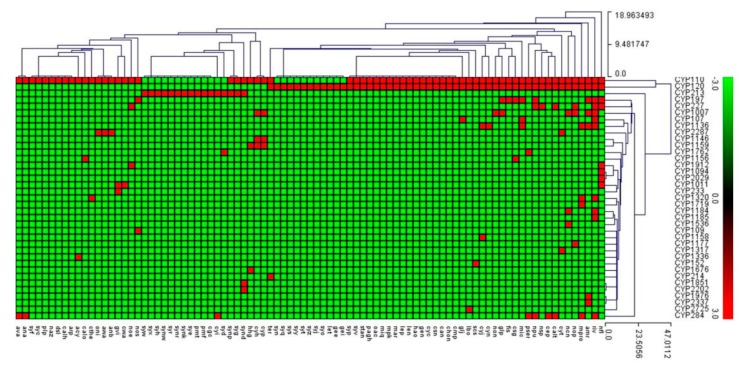
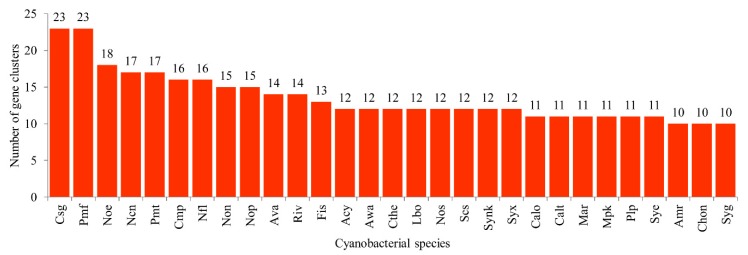
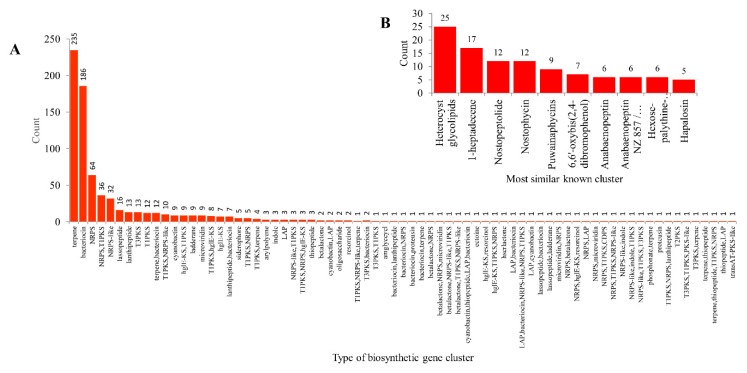
The prokaryotic phylum Cyanobacteria are some of the oldest known photosynthetic organisms responsible for the oxygenation of the earth. Cyanobacterial species have been recognised as a prosperous source of bioactive secondary metabolites with antibacterial, antiviral, antifungal and/or anticancer activities. Cytochrome P450 monooxygenases (CYPs/P450s) contribute to the production and diversity of various secondary metabolites. To better understand the metabolic potential of cyanobacterial species, we have carried out comprehensive analyses of P450s, predicted secondary metabolite biosynthetic gene clusters (BGCs), and P450s located in secondary metabolite BGCs. Analysis of the genomes of 114 cyanobacterial species identified 341 P450s in 88 species, belonging to 36 families and 79 subfamilies. In total, 770 secondary metabolite BGCs were found in 103 cyanobacterial species. Only 8% of P450s were found to be part of BGCs. Comparative analyses with other bacteria Bacillus, Streptomyces and mycobacterial species have revealed a lower number of P450s and BGCs and a percentage of P450s forming part of BGCs in cyanobacterial species. A mathematical formula presented in this study revealed that cyanobacterial species have the highest gene-cluster diversity percentage compared to Bacillus and mycobacterial species, indicating that these diverse gene clusters are destined to produce different types of secondary metabolites. The study provides fundamental knowledge of P450s and those associated with secondary metabolism in cyanobacterial species, which may illuminate their value for the pharmaceutical and cosmetics industries.

Keywords: Cyanobacteria; biosynthetic gene clusters; cytochromes P450 monooxygenases; gene-cluster diversity percentage; mathematical formula; phylogenetic analysis; secondary metabolites.


Conflict of interest statement

The authors declare no conflict of interest. The funders had no role in the design of the study, in the collection, analyses, or interpretation of data, in the writing of the manuscript, or in the decision to publish the results.

Figures

Figure 1
Figure 1
Analysis of P450s in Cyanobacteria. P450s were analyzed at both the genus level (A) and species level (B). The numbers next to the bars indicate the number of species. In Panel A, only species numbers for the species that have P450s are presented. Detailed information is presented in Tables S1 and S2.
Figure 2
Figure 2
Phylogenetic analysis of cyanobacterial species P450s. Dominant P450 families are indicated in different colours. A high-resolution phylogenetic tree is provided as Supplementary Dataset 2.
Figure 3
Figure 3
Comparative analysis of P450s in cyanobacterial species. The numbers next to bars indicate the number of P450s in each species. The species names with respect to their codes can be found in Table S2.
Figure 4
Figure 4
Family level comparative analysis of P450s in the species of Cyanobacteria. The numbers next to the family bar indicate the number of P450s. The data on the number of P450 families, along with subfamilies, are presented in Supplementary Table S3.
Figure 5
Figure 5
Heat-map of the presence/absence of P450 families in 88 cyanobacterial species. The data is represented as 3 for family presence (red) and –3 for family absence (green). Eighty-nine cyanobacterial species form the horizontal axis and P450 family numbers form the vertical axis. A detailed table showing P450 family profiles in each of the cyanobacterial species is presented in Supplementary Dataset 3.
Figure 6
Figure 6
Comparative analysis of secondary metabolite biosynthetic gene clusters (BGCs) in cyanobacterial species. Species with a two-digit number of secondary metabolite BGCs are shown in the figure. The species names with respect to their codes can be found in Table S1. Detailed information on each of the species’ secondary metabolite BGCs is presented in Table S2.
Figure 7
Figure 7
Comparative analysis of types of secondary metabolite biosynthetic gene clusters (BGCs) in 103 cyanobacterial species (A) and most similar known clusters (B). Standard abbreviations representing secondary metabolite BGCs as indicated in anti-SMASH (antibiotics & Secondary Metabolite Analysis Shell) [65] were used in the figure. Detailed information is presented in Supplementary Table S4.

References

    1. Bekker A., Holland H., Wang P.-L., Rumble Iii D., Stein H., Hannah J., Coetzee L., Beukes N. Dating the rise of atmospheric oxygen. Nature. 2004;427:117–120. doi: 10.1038/nature02260. - DOI - PubMed
    1. Kump L.R. The rise of atmospheric oxygen. Nature. 2008;451:277–278. doi: 10.1038/nature06587. - DOI - PubMed
    1. Shih P.M. Cyanobacterial evolution: Fresh insight into ancient questions. Curr. Biol. 2015;25:R192–R193. doi: 10.1016/j.cub.2014.12.046. - DOI - PubMed
    1. Flores F.G. The Cyanobacteria: Molecular Biology, Genomics, and Evolution. Horizon Scientific Press; Heatherset, UK: 2008.
    1. Buick R. The antiquity of oxygenic photosynthesis: Evidence from stromatolites in sulphate-deficient Archaean lakes. Science. 1992;255:74–77. doi: 10.1126/science.11536492. - DOI - PubMed

Substances

LinkOut - more resources