. 2020 Jan;17(162):20190722.
doi: 10.1098/rsif.2019.0722. Epub 2020 Jan 22.

Mitigating temozolomide resistance in glioblastoma via DNA damage-repair inhibition

Affiliations

Mitigating temozolomide resistance in glioblastoma via DNA damage-repair inhibition

Inmaculada C Sorribes et al. J R Soc Interface. 2020 Jan.

Abstract

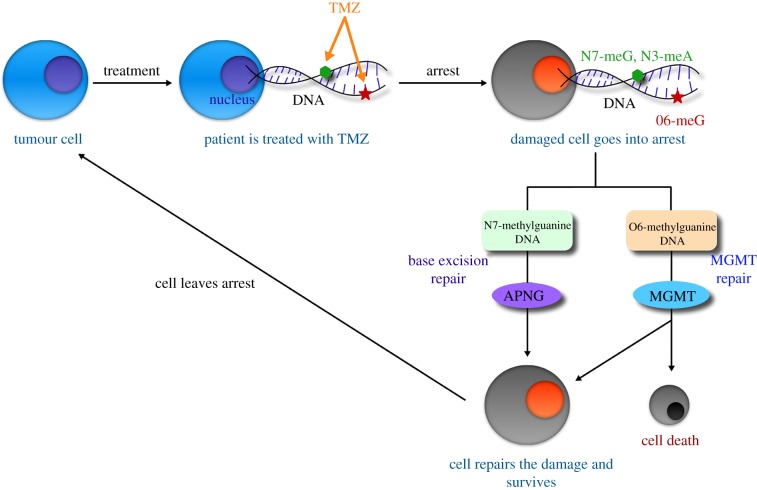
Glioblastomas are among the most lethal cancers, with a 5 year survival rate below 25%. Temozolomide is typically used in glioblastoma treatment; however, the enzymes alkylpurine-DNA-N-glycosylase (APNG) and methylguanine-DNA-methyltransferase (MGMT) efficiently mediate the repair of DNA damage caused by temozolomide, reducing treatment efficacy. Consequently, APNG and MGMT inhibition has been proposed as a way of overcoming chemotherapy resistance. Here, we develop a mechanistic mathematical model that explicitly incorporates the effects of chemotherapy on tumour cells, including the processes of DNA damage induction, cell arrest and DNA repair. Our model is carefully parametrized and validated, and then used to virtually recreate the response of heteroclonal glioblastomas to dual treatment with temozolomide and inhibitors of APNG/MGMT. Using our mechanistic model, we identify four combination treatment strategies optimized by tumour cell phenotype, and isolate the strategy most likely to succeed in a pre-clinical and clinical setting. If confirmed in clinical trials, these strategies have the potential to offset chemotherapy resistance in patients with glioblastoma and improve overall survival.

Keywords: alkylpurine-DNA-N-glycosylase; glioblastoma; mathematical model; methylguanine-DNA-methyltransferase; temozolomide.


Conflict of interest statement

We declare we have no competing interests.

Figures

Figure 1.
Figure 1.
Model schematic. Treatment with TMZ causes DNA methylation, leading to cell arrest. TMZ-induced methylation sites are N7-meG, N3-meA (repaired by the APNG-mediated BER pathway) and O6-meG (repaired by the MGMT pathway). If DNA damage repair is successful, the cell recovers to the proliferating pool, or undergoes apoptosis otherwise. (Online version in colour.)
Figure 2.
Figure 2.
Local and global sensitivity analyses. (a) Three-dimensional histogram of survival percentage of cells following TMZ treatment in a cell growth inhibition assay as the expression levels of APNG (y-axis) and MGMT (x-axis) are varied. (b) Survival percentage of cells as proliferation rate is varied in cell lines with MGMT and/or APNG expression turned on/off. (c,d) Survival percentage of cells as MGMT turnover rate (c) or APNG turnover rate (d) is varied in cell lines with MGMT and/or APNG expression turned on/off. (e) eFAST sensitivity indices of various model parameters (α, proliferation rate; SAPNG and SMGMT, rates of APNG and MGMT expression, respectively; and λAPNG and λMGMT, rates of APNG and MGMT degradation, respectively). A dummy variable is used to perform a t-test. (f) Sobol sensitivity indices of the parameters α, SAPNG and SMGMT. See also electronic supplementary material, figure S4. (Online version in colour.)
Figure 3.
Figure 3.
Heteroclonal tumour xenograft response to a single dose of TMZ. (ac), RDI (raw data, descriptive statistics and inferential statistics) plots showing raw data points (black dots), central tendencies (vertical bar), smoothed densities (irregular coloured regions) and Bayesian highest density intervals (HDIs; white rectangles). Tumour cell lines are divided into quartiles according to the percentage of the tumour they occupy at the end of the experiment: quartile 1, 0–25%; quartile 2, 25–50%; quartile 3, 50–75%; and quartile 4, 75–100%. Cell lines in quartile 1 are most sensitive to TMZ, while those in quartile 4 are most resistant. Three cellular phenotypes are considered: (a) rate of cell proliferation, (b) APNG expression and (c) MGMT expression. (d,e) Scatter plots of APNG expression versus MGMT expression in the most TMZ-sensitive cells (d) and most TMZ-resistant cells (e). The colour of the data dots is a gradient based on proliferation rate with darker dots representing cells with smaller doubling time. Linear correlation is shown as yellow lines, and corresponding 95% confidence intervals are shown as shaded areas. Distributions of enzyme expression are shown as marginal histograms (top, APNG; right, MGMT) and marginal rugs (left, MGMT; bottom, APNG). (Online version in colour.)
Figure 4.
Figure 4.
Cell growth inhibition in response to various treatment strategies. Mean values and 95% confidence intervals of surviving cell numbers when cell growth inhibition assays are simulated with: standard TMZ (solid pink line, pink shaded area); optimal TMZ (dotted blue line, blue shaded area) and optimal combination treatment (dashed yellow line, yellow shaded area). (a) Cells expressing low levels of both repair enzymes (APNG/MGMT, 〈α〉 = 0.86, 〈SAPNG〉 = 51.96, 〈SMGMT〉 = 52.85). (b) Cells expressing high levels of APNG and low levels of MGMT (APNG+/MGMT, 〈α〉 = 0.75, 〈SAPNG〉 = 977.42, 〈SMGMT〉 = 49.08). (c) Cells expressing low levels of APNG and high levels of MGMT (APNG/MGMT+, 〈α〉 = 0.74, 〈SAPNG〉 = 48.93, 〈SMGMT〉 = 975.70). (d) Cells expressing high levels of both repair enzymes (APNG+/MGMT+, 〈α〉 = 0.66, 〈SAPNG〉 = 658.54, 〈SMGMT〉 = 655.32). Here, 〈 · 〉 denotes the average value of that parameter across all cell lines within the respective cohort. (Online version in colour.)
Figure 5.
Figure 5.
Heteroclonal xenograft response to optimal treatment protocols identified in table 1. Mice with heteroclonal tumour xenografts were randomly assigned to one of the strategies A, B, C or D. The mean values of fold change in tumour volume relative to pre-treatment are shown at days 7, 14, 21 and 28 after treatment initiation. Error bars represent 95% confidence intervals. (Online version in colour.)
Figure 6.
Figure 6.
Results of an in silico human trial. (a) Kaplan–Meier survival probabilities when patients were treated with standard TMZ, optimal TMZ, and combination strategy D for seven 28-day treatment cycles. (bd) Proliferation rates, and APNG and MGMT expression averaged over each tumour over the course of seven treatment cycles. Data points represent the mean across the 100 patients, with 95% confidence intervals. (Online version in colour.)

References

    1. Preusser M, De Ribaupierre S, Wöhrer A, Erridge SC, Hegi M, Weller M, Stupp R. 2011. Current concepts and management of glioblastoma. Ann. Neurol. 70, 9–21. (10.1002/ana.22425) - DOI - PubMed
    1. Louis DN. et al. 2016. The 2016 World Health Organization classification of tumors of the central nervous system: a summary. Acta Neuropathol. 131, 803–820. (10.1007/s00401-016-1545-1) - DOI - PubMed
    1. Ward E, DeSantis C, Robbins A, Kohler B, Jemal A. 2014. Childhood and adolescent cancer statistics, 2014. CA Cancer J. Clin. 64, 83–103. (10.3322/caac.21219) - DOI - PubMed
    1. Bleeker FE, Molenaar RJ, Leenstra S. 2012. Recent advances in the molecular understanding of glioblastoma. J. Neurooncol. 108, 11–27. (10.1007/s11060-011-0793-0) - DOI - PMC - PubMed
    1. Newlands E, Stevens M, Wedge S, Wheelhouse R, Brock C. 1997. Temozolomide: a review of its discovery, chemical properties, pre-clinical development and clinical trials. Cancer Treat. Rev. 23, 35–61. (10.1016/S0305-7372(97)90019-0) - DOI - PubMed

Publication types