. 2020 Jan 29;287(1919):20192446.
doi: 10.1098/rspb.2019.2446. Epub 2020 Jan 22.

Resource fluctuations inhibit the reproduction and virulence of the human parasite Schistosoma mansoni in its snail intermediate host

Affiliations

Resource fluctuations inhibit the reproduction and virulence of the human parasite Schistosoma mansoni in its snail intermediate host

David J Civitello et al. Proc Biol Sci. .

Abstract

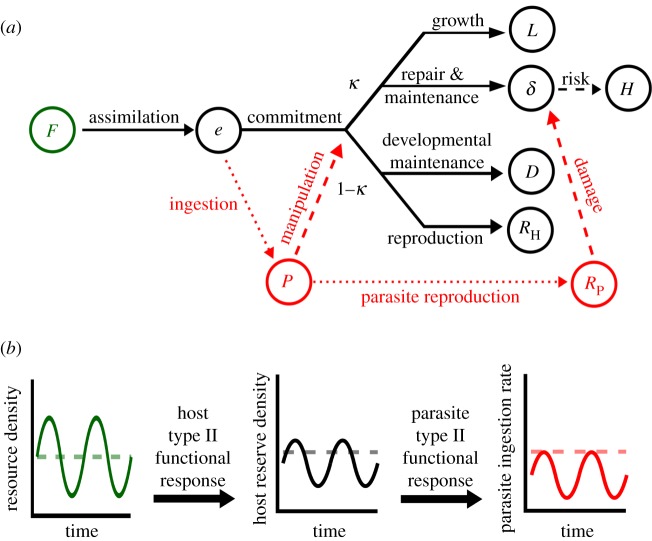
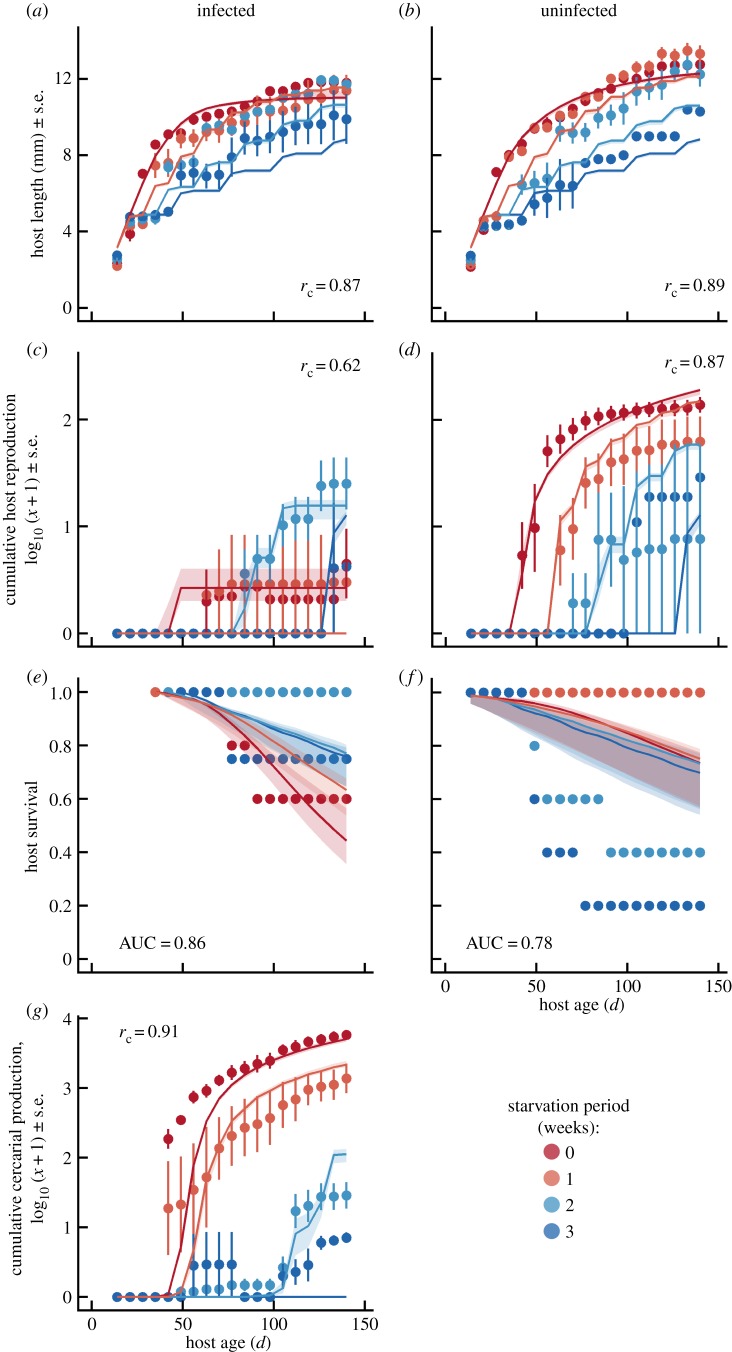
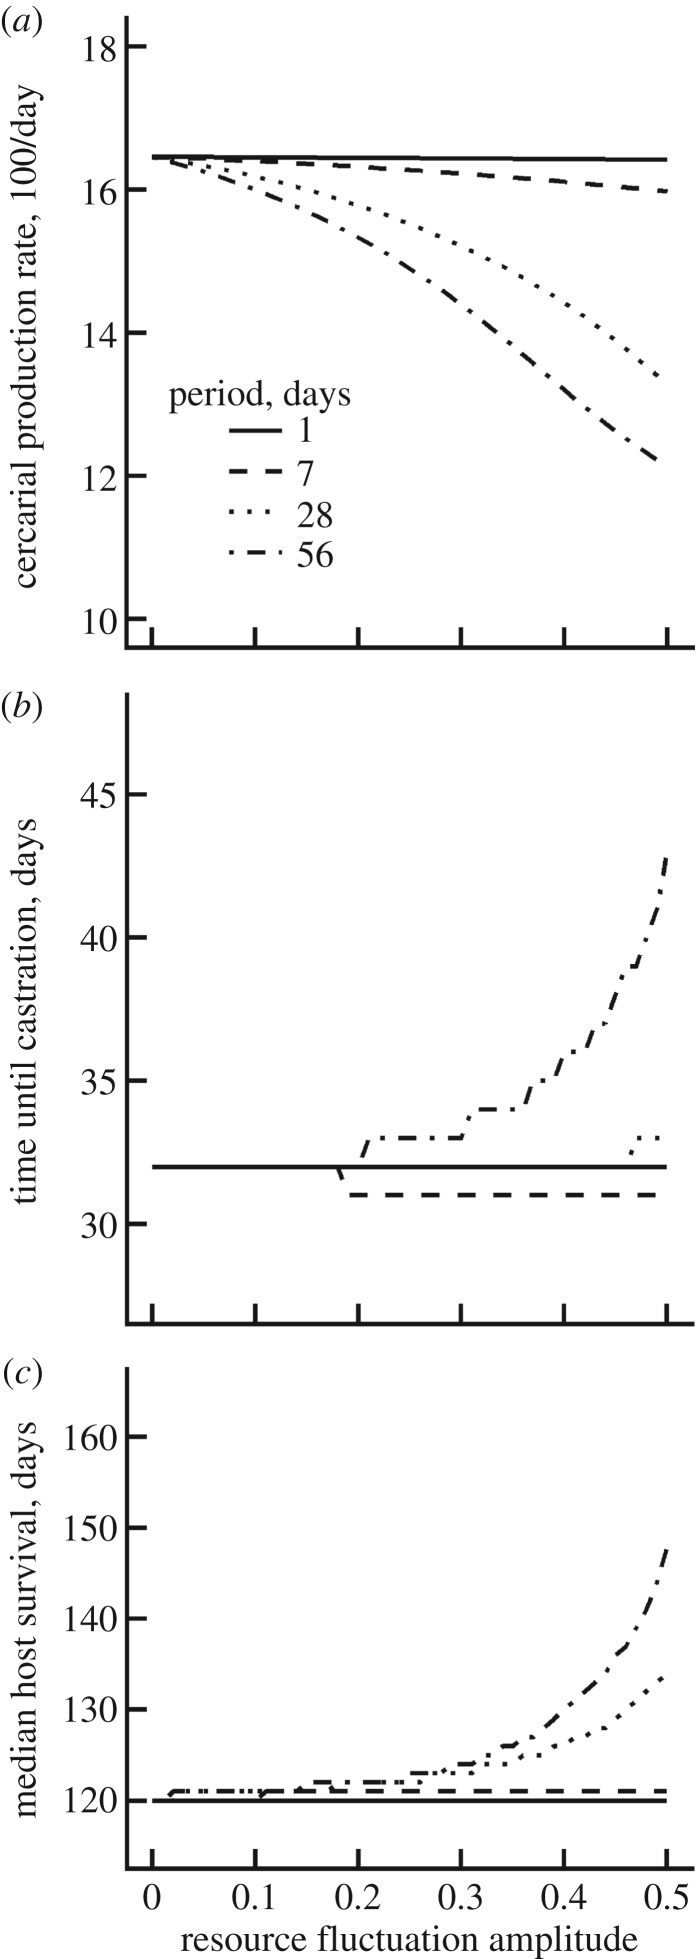
Resource availability can powerfully influence host-parasite interactions. However, we currently lack a mechanistic framework to predict how resource fluctuations alter individual infection dynamics. We address this gap with experiments manipulating resource supply and starvation for a human parasite, Schistosoma mansoni, and its snail intermediate host to test a hypothesis derived from mechanistic energy budget theory: resource fluctuations should reduce schistosome reproduction and virulence by inhibiting parasite ingestion of host biomass. Low resource supply caused hosts to remain small, reproduce less and produce fewer human-infectious cercariae. Periodic starvation also inhibited cercarial production and prevented infection-induced castration. The periodic starvation experiment also revealed substantial differences in fit between two bioenergetic model variants, which differ in their representation of host starvation. Simulations using the best-fit parameters of the winning model suggest that schistosome performance substantially declines with resource fluctuations with periods greater than 7 days. These experiments strengthen mechanistic theory, which can be readily scaled up to the population level to understand key feedbacks between resources, host population dynamics, parasitism and control interventions. Integrating resources with other environmental drivers of disease in an explicit bioenergetic framework could ultimately yield mechanistic predictions for many disease systems.

Keywords: energy budget; fluctuation; parasite production; parasitism; reproduction; resources.


Conflict of interest statement

We declare we have no competing interests.

Figures

Figure 1.
Figure 1.
Schematic of (a) the dynamic energy budget (DEB) model for a free-living host (black) infected with a population of parasites (red). DEB theory tracks assimilation of food resources (F, green) into energy reserves, e. Reserve energy is then committed to somatic or reproductive processes with a fixed allocation fraction, κ. Reserve allocated to soma pays for maintenance and repair, which decreases damage, δ, and surplus is used for structural growth, which increases length, L. Allocation to reproduction similarly pays developmental maintenance, and surplus fuels additional development, D, or reproduction, RH. Here, a population of parasites, P, exerts four potential effects (red dotted and dashed lines). Trophically, parasites consume host reserves, increasing their own biomass and ultimately producing new propagules, RP (dotted lines). Physiologically, parasites can also manipulate the host's allocation rule and induce tissue damage upon emergence (dashed lines). (b) Visual illustration of the hypothesis that resource fluctuations inhibit parasite ingestion. Compared with constant resource density (dashed lines), resource fluctuations (solid lines) and the host's type II functional response combine to induce fluctuations and lower the mean density of host energy reserves. In turn, these effects combine with the parasite's type II functional response to cause fluctuations and lower the average per parasite ingestion rate, limiting parasite growth, reproduction and virulence. (Online version in colour.)
Figure 2.
Figure 2.
Life history and infection dynamics in the experiment manipulating starvation period (colours) and infection (columns). Points represent treatment means ± s.e. Prediction lines and shaded envelopes represent the median and 99% posterior credible interval of the mean dynamics of the ‘shrinking and regression' model. Growth of infected (a) and uninfected (b) snails was substantially reduced with increasing starvation period. Infected snail reproduction (c) was ultimately highest in the longest starvation treatments. However, uninfected snail reproduction (d) was reduced approximately 10-fold in the longest starvation treatments. Infected host survival (e) was higher in the longer starvation treatments, whereas uninfected hosts survived best with consistent feeding (f). Hosts fed consistently produced approximately 1000-fold more parasite cercariae than those in the longest starvation treatments (g). The ‘shrinking and regression' model explains these dynamics extremely well, with concordance correlation coefficients rc = 0.62–0.91 and AUC = 0.78–0.86. In particular, this model slightly underpredicted snail growth in the two- and three-week starvation period treatments, but it captures snail and parasite reproduction extremely well. (Online version in colour.)
Figure 3.
Figure 3.
Life history and infection dynamics in the experiment manipulating resource supply rate (colours) and infection (columns). Points represent treatment means ± s.e. Prediction lines and shaded envelopes represent the median and 99% posterior credible interval of the mean dynamics of the ‘shrinking and regression' model. (ad) Growth and reproduction of infected and uninfected snails increased substantially over the supply gradient. Survival decreased with food supply for infected individuals (e), but increased with food supply for uninfected individuals (f). Parasite production increased approximately 60-fold over the supply gradient (g). The ‘shrinking and regression’ model explains these dynamics extremely well, with concordance correlation coefficients rc = 0.71–0.97 and AUC = 0.78–0.86. (Online version in colour.)
Figure 4.
Figure 4.
Resource fluctuations generally decrease schistosome performance in intermediate host snails. Simulation results using the highest posterior density parameter estimates of the better performing ‘shrinking and regression' model coupled with the scaled functional response of snail hosts is represented with a sine wave. In simulations that varied the amplitude (x-axis) and period (line type), resource fluctuations reduced cercarial production (a) and the time required to castrate (b) or kill (c) the snail host. These effects increased with the amplitude and period of the simulated resource fluctuations. The best-fit parameter estimates suggest that snail–schistosome infection dynamics are sensitive to resource fluctuations with periods greater than one week.

References

    1. Bekerman E, Einav S. 2015. Combating emerging viral threats. Science 348, 282–283. ( 10.1126/science.aaa3778) - DOI - PMC - PubMed
    1. Morens DM, Folkers GK, Fauci AS. 2004. The challenge of emerging and re-emerging infectious diseases. Nature 430, 242–249. ( 10.1038/nature02759) - DOI - PMC - PubMed
    1. Duffy MA, Ochs JH, Penczykowski RM, Civitello DJ, Klausmeier CA, Hall SR. 2012. Ecological context influences epidemic size and parasite-driven evolution. Science 335, 1636–1638. ( 10.1126/science.1215429) - DOI - PubMed
    1. Hudson PJ, Dobson AP, Newborn D. 1998. Prevention of population cycles by parasite removal. Science 282, 2256–2258. ( 10.1126/science.282.5397.2256) - DOI - PubMed
    1. Anderson RM, May RM. 1986. The invasion, persistence and spread of infectious disease within animal and plant communities. Phil. Trans. R. Soc. Lond. B 314, 533–570. ( 10.1098/rstb.1986.0072) - DOI - PubMed

Publication types