. 2020 Jan 21;19(1):11.
doi: 10.1186/s12943-019-1122-z.

Hypoxia induced LUCAT1/PTBP1 axis modulates cancer cell viability and chemotherapy response

Affiliations

Hypoxia induced LUCAT1/PTBP1 axis modulates cancer cell viability and chemotherapy response

Lin Huan et al. Mol Cancer. .

Abstract

Background: Hypoxic tumors are refractory to DNA damage drugs. However, the underlying mechanism has yet to be elucidated. We aimed to identify lncRNAs that upregulated under hypoxia and their effects on colorectal cancer (CRC).

Methods: CRC cells were treated with 1% O2 to identify lncRNAs that upregulated under hypoxia. We integrated these lncRNAs with RNA-seq of 4 paired CRC tissues and TCGA data to get candidate lncRNAs. Multiple in vitro and in vivo assays were used to explore the role of LUCAT1 in CRC.

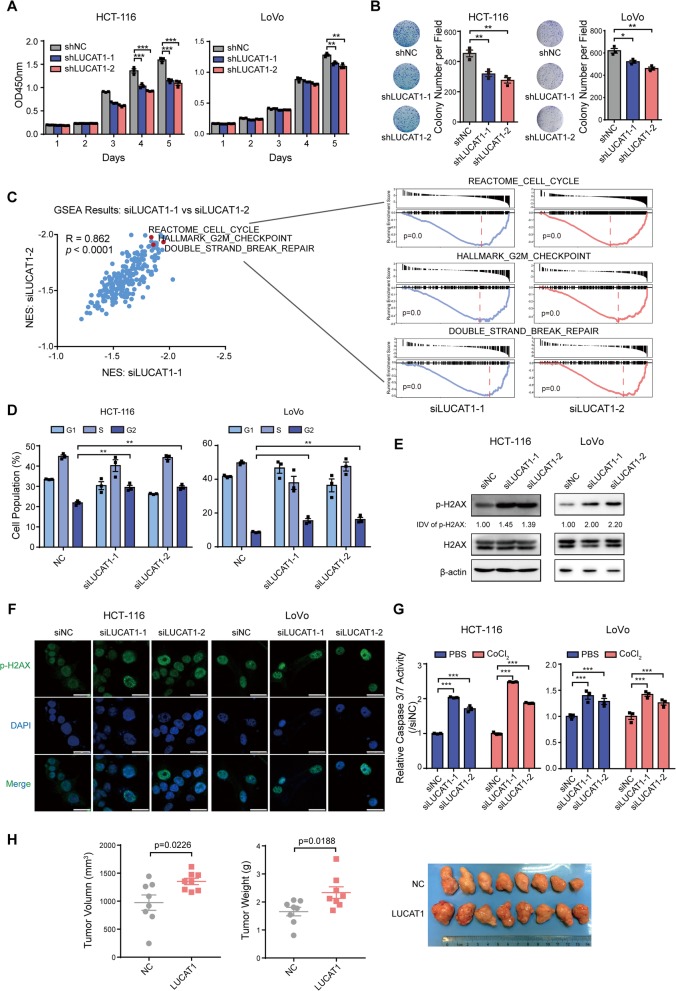
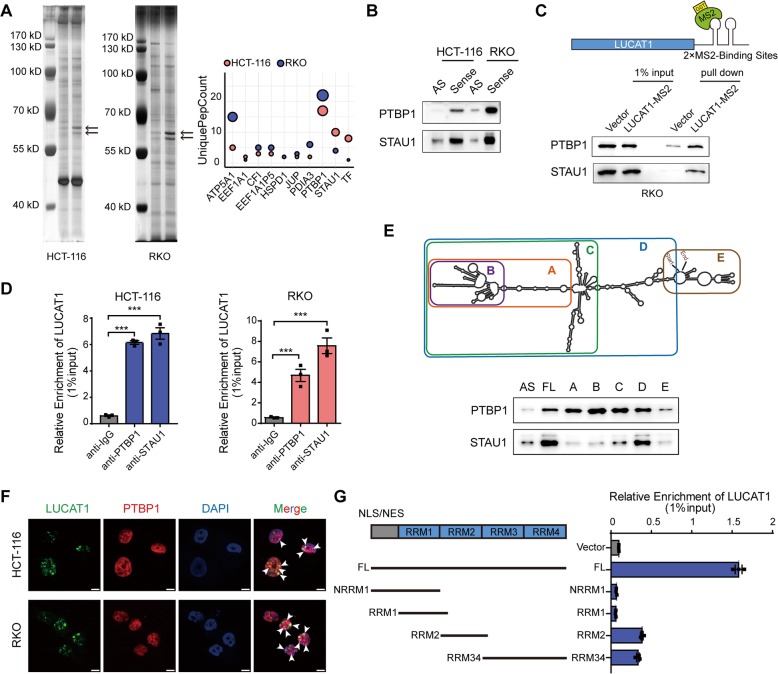
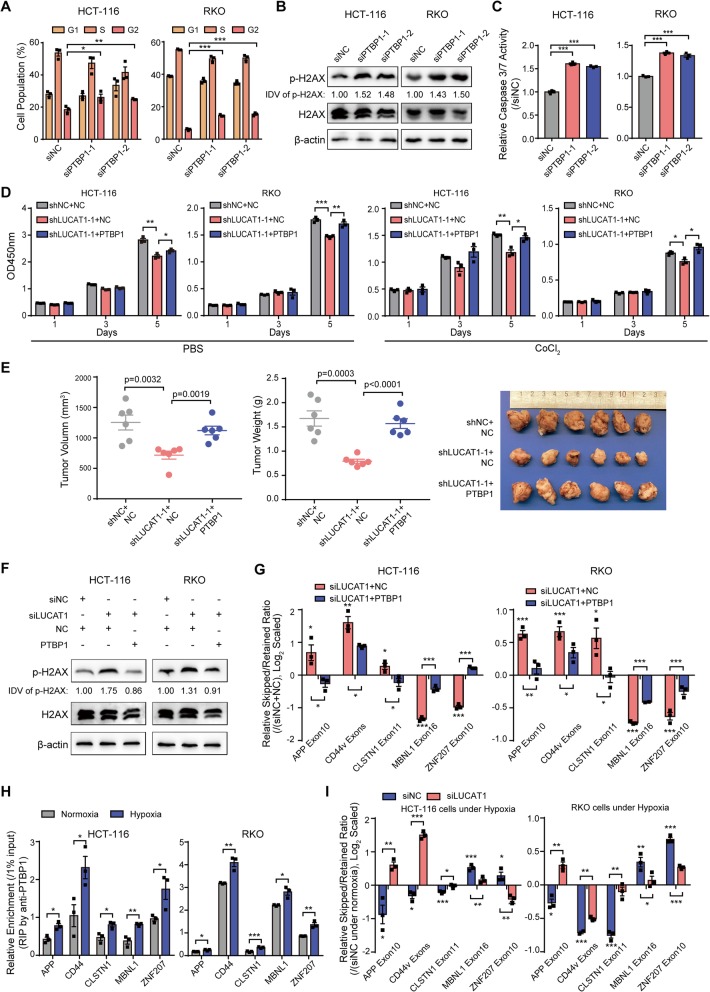
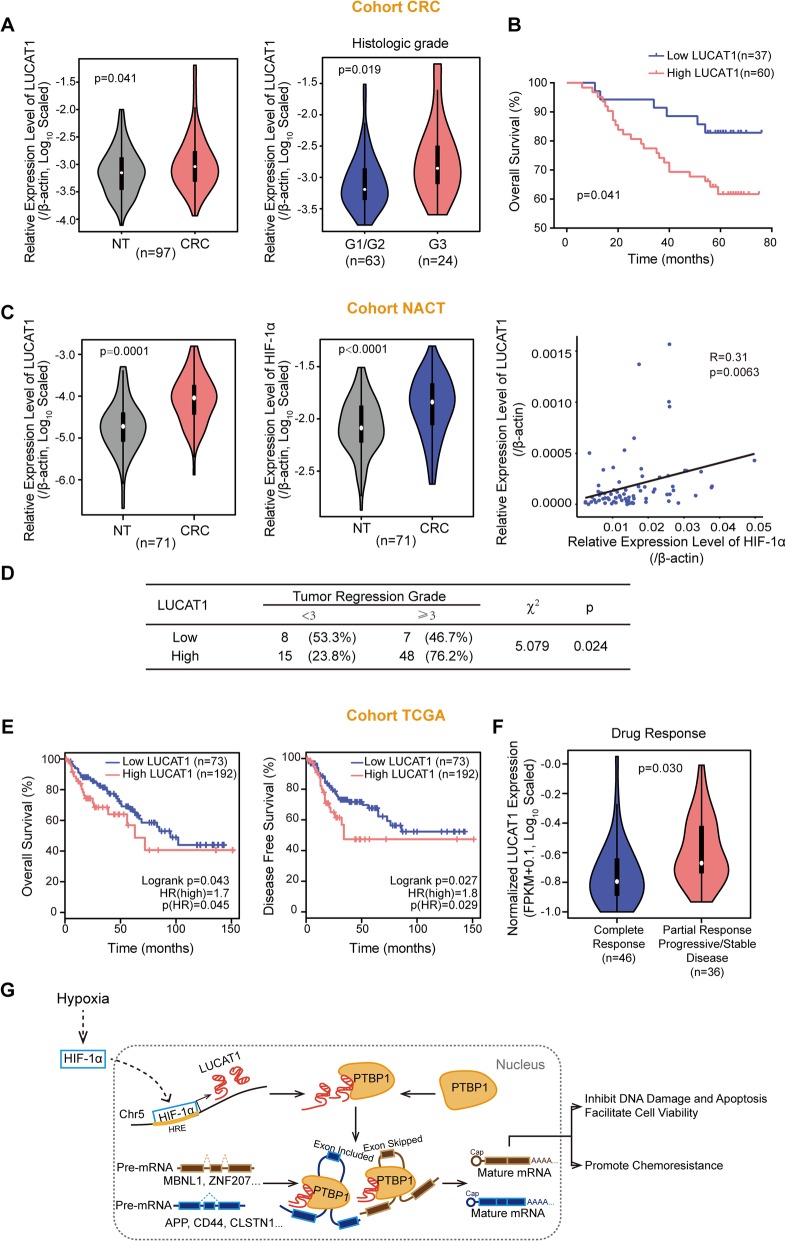
Results: We identified a hypoxia-induced lncRNA LUCAT1 that facilitated the growth of CRC cells and contributed to drug resistance of CRC cells both in vitro and in vivo. Mechanically, LUCAT1 interacts with polypyrimidine tract binding protein 1 (PTBP1) in CRC cells, facilitates the association of a set of DNA damage related genes with PTBP1, thus resulting in altered alternative splicing of these genes. Moreover, ectopic expression of PTBP1 in CRC cells with knockdown of LUCAT1 abrogated the effects induced by LUCAT1 knockdown. Chemotherapeutics drug combined with LUCAT1 knockdown via antisense oligonucleotides (ASO) would get a better outcome in vivo, compared with group treated with chemotherapeutic drug only. Notably, LUCAT1 is upregulated in CRC tissues, compared to adjacent normal tissues; and CRC patients with higher LUCAT1 have a worse prognosis and poorly responded to chemotherapy in the clinic.

Conclusions: Our data suggested CRC cells utilizes LUCAT1 to develop resistance to DNA damage drugs, and disrupting the LUCAT1/PTBP1 axis might be a promising therapeutic strategy for refractory hypoxic tumors.

Keywords: Alternative splicing; Chemoresistance; Hypoxia; LUCAT1; PTBP1; lncRNA.


Conflict of interest statement

The authors declare that they have no competing interests.

Figures

Fig. 1
Fig. 1
LUCAT1 is transcriptionally induced by HIF-1α under hypoxia. a Candidate lncRNAs were identified by RNA-seq of hypoxia treated RKO cell, RNA-seq of CRC tissues and TCGA dataset. b Correlation between HIF-1α and each candidate lncRNAs in TCGA dataset. c Correlation between hypoxia signature genes and LUCAT1 was generated from GEPIA. n = 275 CRC tissues in COAD. pearson correlation. d RNAscope assay of LUCAT1 localization in HCT-116 cells without or with CoCl2 treatment. e Relative LUCAT1 expression in HCT-116 and LoVo cells treated with CoCl2 was determined by qPCR. n = 3 independent experiments, two-tailed Student’s t-test. f qPCR was performed to determine relative LUCAT1 expression in HCT-116 and LoVo cells transfected with siNC or HIF-1α siRNAs under hypoxia at serial time points. n = 3 independent experiments, two-tailed Student’s t-test. g Schematic diagram of HREs in LUCAT1 locus. h ChIP assay demonstrating the binding capacity of HIF-1α to each HRE were conducted in HCT-116 and LoVo cells treated with hypoxia for 24 h. i Luciferase reporter assay for the second HRE activity of LUCAT1 in HCT-116 and LoVo cells with the indicated treatment. n = 5 independent experiments, two-tailed Student’s t-test. * p < 0.05, ** p < 0.01, and *** p < 0.001
Fig. 2
Fig. 2
LUCAT1 inhibits DNA damage and apoptosis of CRC cells. a and b CCK8 and colony formation assays of HCT-116 and LoVo following NC or LUCAT1 knockdown. n = 3 independent experiments, two-tailed Student’s t-test. c GSEA analyses of RNA-seq data from HCT-116 cells transfected with siNC or LUCAT1 siRNAs. n = 180, pearson correlation. d Cell cycle analyses of HCT-116 and LoVo cells transfected with siNC or LUCAT1 siRNAs. n = 3 independent experiments, two-tailed Student’s t-test. e Protein expression levels of a DNA damage marker, p-H2AX, following NC or LUCAT1 knockdown as measured by western blotting. Integrated Density Value (IDV) was obtained by ImageJ and normalized by the first lane. f Confocal microscopic images of p-H2AX in HCT-116 and LoVo cells after NC or LUCAT1 knockdown. g Caspase 3/7 activities of HCT-116 and LoVo cells following NC or LUCAT1 knockdown without or with CoCl2 treatment. n = 3 independent experiments, two-tailed Student’s t-test. h Tumor volume and tumor weight of NC or LUCAT1 overexpressing HCT-116 cells in xenograft mouse model. n = 8 tumors, two-tailed Student’s t-test. * p < 0.05, ** p < 0.01, and *** p < 0.001
Fig. 3
Fig. 3
LUCAT1 interacts with PTBP1 in CRC cells. a Silver staining and mass spectrometry analyses following RNA pull down of LUCAT1 sense or LUCAT1 antisense in HCT-116 and RKO cells. b and c Western blotting validation of biotin-labelled RNA pull down using antisense or sense probes and GST pull down using empty vector or LUCAT1-MS2. d RIP assays were performed in HCT-116 and RKO cells. n = 3 independent experiments, two-tailed Student’s t-test. e Western blot of PTBP1 and STAU1 in biotinylated antisense, full length or truncated LUCAT1 pull down. f Colocalization of LUCAT1 and PTBP1 in CoCl2-treated HCT-116 and RKO cells. g Deletion mapping to identify the LUCAT1 binding domain in PTBP1 by RIP-qPCR using full length or truncated PTBP1 protein. * p < 0.05, ** p < 0.01, and *** p < 0.001
Fig. 4
Fig. 4
LUCAT1 modulates alternative splicing via interaction with PTBP1. a GSEA analyses of LUCAT1 knock down HCT-116 cells and PTBP1 knock down HCT-116 cells. Dots in colors are statistically significant. Dots in red are genesets involving cell growth, cell cycle and G2/M checkpoint. b Venn diagram of splicing events regulated by LUCAT1 and PTBP1. c Gene annotation and analysis of common genes alternatively spliced by LUCAT1 and PTBP1. d Exon coverage viewed in IGV. Arrows in orange indicates the corresponding exons. e Alternative splicing events in each target gene were determined by qPCR and normalized to siNC-transfected CRC cells. n = 3 independent experiments, two-tailed Student’s t-test. f Alternative splicing of target genes in CRC cells transfected with siNC, LUCAT1 siRNAs or PTBP1 siRNAs was validated by RT-PCR. g and h PTBP1-RIP assays were performed following LUCAT1 knockdown or overexpression. n = 3 independent experiments, two-tailed Student’s t-test. i Correlation between target gene alternative splicing and LUCAT1 expression in CRC tissues. n = 46 in CRC cohort, pearson correlation. * p < 0.05, ** p < 0.01, and *** p < 0.001
Fig. 5
Fig. 5
PTBP1 functions downstream of LUCAT1 in CRC under hypoxia. a Cell cycle (b) Western blotting for p-H2AX and (c) Caspase 3/7 activity assays in CRC cells transfected with siNC or PTBP1 siRNAs. n = 3 independent experiments, two-tailed Student’s t-test. Integrated Density Value (IDV) was obtained by ImageJ and normalized by the first lane. d CCK8 assays in LUCAT1-depleted CRC cells following reintroduction of PTBP1. n = 3 independent experiments, two-tailed Student’s t-test. e Tumor volume and tumor weight of indicated xenograft mouse model. n = 6 tumors, two-tailed Student’s t-test. f Western blotting for p-H2AX expression in LUCAT1-depleted CRC cells following reintroduction of PTBP1. Integrated Density Value (IDV) was obtained by ImageJ and normalized by the first lane. g qPCR assays of alternative splicing events in LUCAT1-depleted CRC cells following reintroduction of PTBP1. n = 3 independent experiments, two-tailed Student’s t-test. h RIP assays were performed in HCT-116 and RKO cells to evaluating the binding capacities between PTBP1 and target genes under normoxia or hypoxia. n = 3 independent experiments, two-tailed Student’s t-test. i Alternative splicing events in each target gene were determined by qPCR and normalized to siNC-transfected CRC cells under normoxia. n = 3 independent experiments, two-tailed Student’s t-test. * p < 0.05, ** p < 0.01, and *** p < 0.001
Fig. 6
Fig. 6
High LUCAT1 confers CRC cells to chemotherapy resistance. a Western blotting for p-H2AX in NC or LUCAT1 overexpressing HCT-116 cells following indicated treatment. Integrated Density Value (IDV) was obtained by ImageJ and normalized by the first lane. b Western blotting for p-H2AX in NC or LUCAT1 overexpressing CRC cells treated with various drugs. Integrated Density Value (IDV) was obtained by ImageJ and normalized by the first lane. c CCK8 assays of CRC cells treated with various drugs. Viability ratio was represented with the OD450nm ratio by day 5 to day 1. n = 3 independent experiments, two-tailed Student’s t-test. d Caspase 3/7 assays were conducted in NC or LUCAT1 overexpressing CRC cells treated with various drugs. n = 3 independent experiments, two-tailed Student’s t-test. e Viability of NC or LUCAT1 overexpressing CRC cells treated with serial indicated doses of chemotherapeutic drugs. n = 3 independent experiments. f In vivo analysis of tumor volumes and weights in mice harboring NC or LUCAT1 overexpressing HCT-116 cells treated with PBS, 5-FU and Oxaliplatin. n = 6 tumors, two-tailed Student’s t-test. g In vivo analysis of tumor volumes and weights in mice with indicated treatment. n = 6 tumors, two-tailed Student’s t-test. h CCK8 assay and viability assay of RKO-parental and RKO-OXA cells transfected with siNC or LUCAT1 siRNAs, treated with 2 μM Oxaliplatin and treated with serial indicated doses of Oxaliplatin. n = 3 independent experiments, two-tailed Student’s t-test. * p < 0.05, ** p < 0.01, and *** p < 0.001
Fig. 7
Fig. 7
High LUCAT1 is associated with worse prognosis and poor response to chemotherapeutic drugs. a The expression of LUCAT1 in 97 paired CRC and adjacent normal (NT) tissues. n = 97 in CRC cohort, paired and unpaired Student’s t-test. b Kaplan–Meier analysis of overall survival curve in CRC patients with high LUCAT1 expression versus low LUCAT1 expression. n = 97 in CRC cohort. c The expression of LUCAT1 and HIF-1α in NACT cohort, and the correlation between LUCAT1 and HIF-1α in this cohort. n = 71 in NACT cohort, paired Student’s t-test and pearson correlation. d The association between tumor regression grade and HIF-1α or LUCAT1 in the NACT cohort. n = 78 in NACT cohort, Chi-squared test. e Kaplan–Meier analysis of overall survival or disease free survival curve in COAD patients with high LUCAT1 expression versus low LUCAT1 expression from TCGA cohort. Graphs were obtained from GEPIA (http://gepia.cancer-pku.cn/). f The expression of LUCAT1 in COAD patients with complete or partial response to drugs from TCGA cohort. n = 82 in TCGA-COAD, two-tailed Student’s t-test. g The graphic illustration demonstrating HIF-1α induced LUCAT1/PTBP1 axis in cancer

References

    1. Semenza GL. Oxygen sensing, hypoxia-inducible factors, and disease pathophysiology. Annu Rev Pathol. 2014;9:47–71. doi: 10.1146/annurev-pathol-012513-104720. - DOI - PubMed
    1. De Rosa M, Pace U, Rega D, Costabile V, Duraturo F, Izzo P, Delrio P. Genetics, diagnosis and management of colorectal cancer (review) Oncol Rep. 2015;34:1087–1096. doi: 10.3892/or.2015.4108. - DOI - PMC - PubMed
    1. Leith JT, Padfield G, Faulkner L, Michelson S. Hypoxic fractions in xenografted human colon tumors. Cancer Res. 1991;51:5139–5143. - PubMed
    1. Semenza GL. Hypoxia-inducible factors: mediators of cancer progression and targets for cancer therapy. Trends Pharmacol Sci. 2012;33:207–214. doi: 10.1016/j.tips.2012.01.005. - DOI - PMC - PubMed
    1. Brown JM, Wilson WR. Exploiting tumour hypoxia in cancer treatment. Nat Rev Cancer. 2004;4:437–447. doi: 10.1038/nrc1367. - DOI - PubMed

Publication types

MeSH terms

Substances