. 2020 Jan 21;11(1):e02780-19.
doi: 10.1128/mBio.02780-19.

Gut Feelings Begin in Childhood: the Gut Metagenome Correlates with Early Environment, Caregiving, and Behavior

Affiliations

Gut Feelings Begin in Childhood: the Gut Metagenome Correlates with Early Environment, Caregiving, and Behavior

Jessica E Flannery et al. mBio. .

Abstract

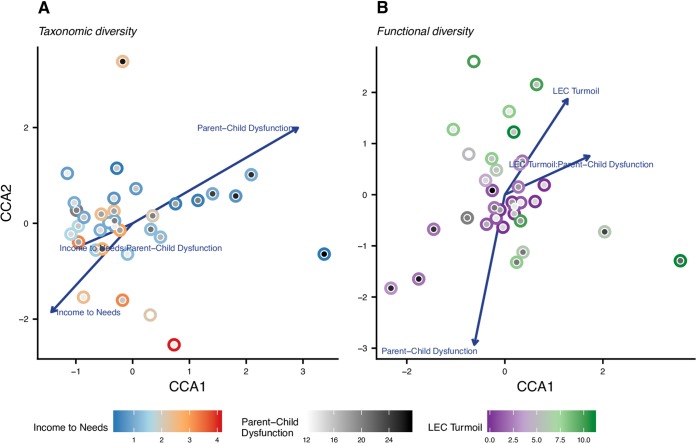
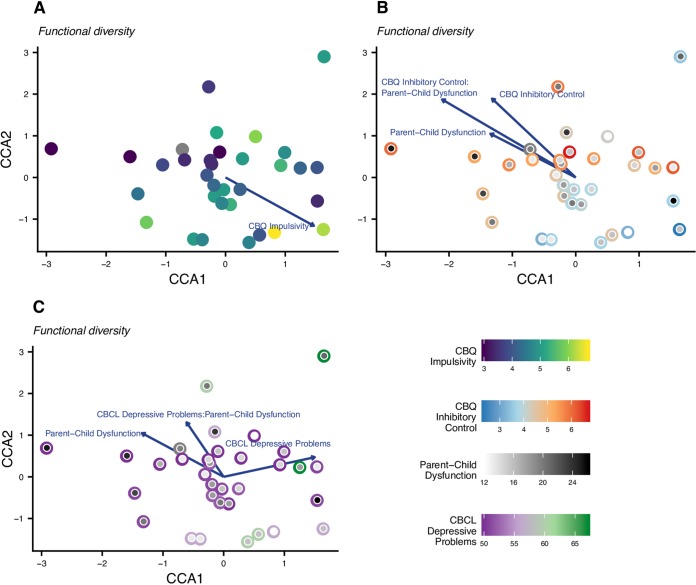
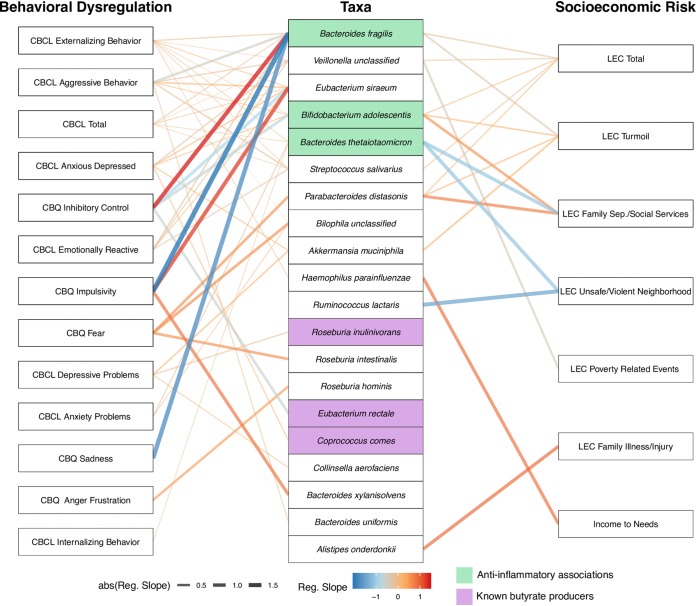
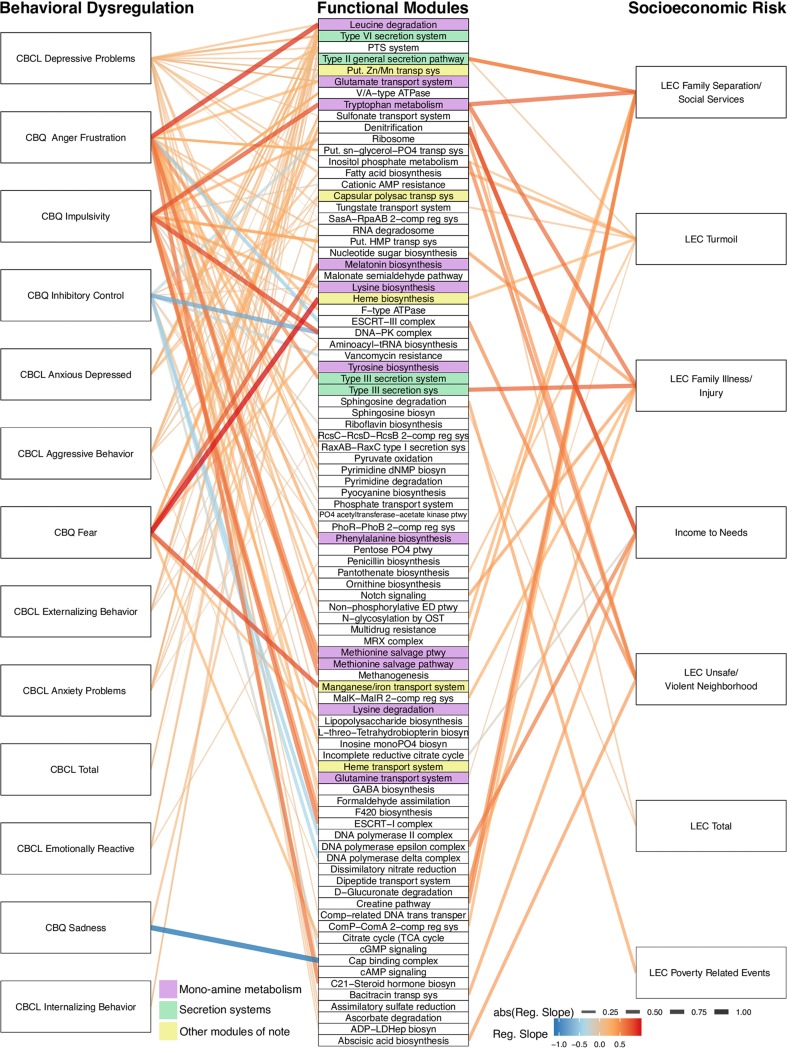
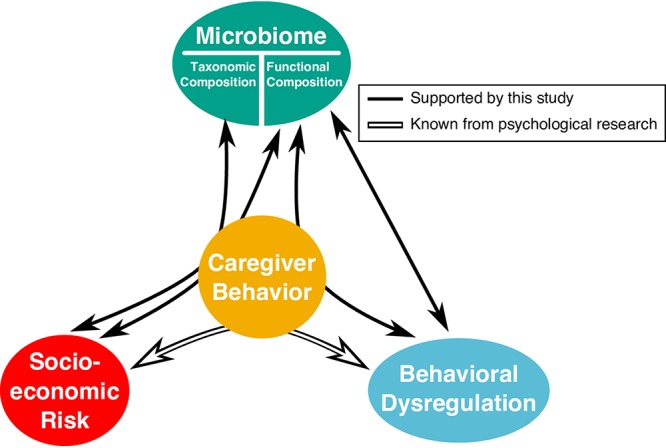
Psychosocial environments impact normative behavioral development in children, increasing the risk of problem behaviors and psychiatric disorders across the life span. Converging evidence demonstrates that early normative development is affected by the gut microbiome, which itself can be altered by early psychosocial environments. However, much of our understanding of the gut microbiome's role in early development stems from nonhuman animal models and predominately focuses on the first years of life, during peri- and postnatal microbial colonization. As a first step to identify if these findings translate to humans and the extent to which these relationships are maintained after initial microbial colonization, we conducted a metagenomic investigation among a cross-sectional sample of early school-aged children with a range of adverse experiences and caregiver stressors and relationships. Our results indicate that the taxonomic and functional composition of the gut microbiome correlates with behavior during a critical period of child development. Furthermore, our analysis reveals that both socioeconomic risk exposure and child behaviors associate with the relative abundances of specific taxa (e.g., Bacteroides and Bifidobacterium species) as well as functional modules encoded in their genomes (e.g., monoamine metabolism) that have been linked to cognition and health. While we cannot infer causality within this study, these findings suggest that caregivers may moderate the gut microbiome's link to environment and behaviors beyond the first few years of life.IMPORTANCE Childhood is a formative period of behavioral and biological development that can be modified, for better or worse, by the psychosocial environment that is in part determined by caregivers. Not only do our own genes and the external environment influence such developmental trajectories, but the community of microbes living in, on, and around our bodies-the microbiome-plays an important role as well. By surveying the gut microbiomes of a cross-sectional cohort of early school-aged children with a range of psychosocial environments and subclinical mental health symptoms, we demonstrated that caregiving behaviors modified the child gut microbiome's association to socioeconomic risk and behavioral dysregulation.

Keywords: behavior; childhood; development; metagenomics; microbiome.


Figures

FIG 1
FIG 1
Constrained correspondence analysis (CCA) ordinations for taxonomic and functional composition of the microbiome and socioeconomic risk and caregiver behavior covariates. Only covariates that have significant main effects or are part of a significant interaction are depicted in each ordination. Significance was assessed using PERMANOVA (α = 0.05). See Tables S2a and b for statistical results. (A) Ordination of taxonomic (species-level) composition. Each point represents a sample and consists of two parts; the color of the outer circle corresponds to the sample’s income to needs score, and the inner circle is shaded from white to black indicating the sample’s parent-child dysfunction score. (B) Ordination of functional (KO level) composition. The outer circle of the point is colored according to the sample’s LEC turmoil score. The inner circle is shaded identically to panel A.
FIG 2
FIG 2
CCA ordinations for functional composition of the microbiome, behavioral dysregulation, and caregiver behavior covariates. Only covariates that have significant main effects or are part of a significant interaction are depicted in each ordination. Significance was assessed using PERMANOVA (α = 0.05). See Tables S2c and d for statistical results. (A) Ordination of functional (KO level) composition. Each point represents a sample and is colored by the participant’s impulsivity score. (B) Ordination of functional (KO level) composition; sample locations are identical to panel A. In this panel, the outer circle of the point is colored according to the sample’s inhibitory control score, and the inner circle is shaded from white to black indicating the sample’s parent-child dysfunction score. (C) Ordination of functional (KO level) composition; sample locations are identical to panels A and B. The color of the outer circle corresponds to the sample’s depressive problems score, and the inner circle is shaded identically to panel B.
FIG 3
FIG 3
A network representing statistically significant pairwise associations, according to generalized linear models, between individual taxa and behavioral dysregulation or socioeconomic risk covariates. The left column shows individual behavioral dysregulation. The middle column shows individual taxa identified to the species level. The right column shows individual socioeconomic risk covariates. Lines are drawn between a covariate and a taxon only if there is a significant relationship. The color of the line represents whether the association between the covariate and taxon is negative (blue) or positive (red). The width and intensity of the line color represent the slope of the regression line that describes the association (steeper regression lines are wider and brighter).
FIG 4
FIG 4
A network representing statistically significant pairwise associations, according to generalized linear models, between individual KOs (grouped into modules) and behavioral dysregulation or socioeconomic risk covariates. The left column shows individual behavioral dysregulation. The middle column shows functional groups assigned at the KEGG module level. The right column shows individual socioeconomic risk covariates. Lines are drawn between a covariate and a module only if there is a significant relationship. The color of the line represents whether the association between the covariate and module is negative (blue) or positive (red). The width and intensity of the line color represent the slope of the regression line that describes the association (steeper regression lines are wider and brighter).
FIG 5
FIG 5
The results of our hypothesis testing using ordination-based analyses. White solid arrows indicate relationships supported by evidence from prior psychological research. Black arrows represent the relationship between the covariate categories and composition (taxonomic or functional) of the gut microbiome as determined by our ordination- and PERMANOVA-based analysis (see Table S2). Straight arrows represent significant main effects between the microbiome and a covariate category (e.g., between behavioral dysregulation and the functional composition of the microbiome). Arrows that curve through caregiver behavior indicate that there is a significant interaction between caregiver behavior and the other covariate category (e.g., our analysis revealed significant interactions between socioeconomic risk and caregiver behavior in their association with the functional composition of the microbiome).

References

    1. Mah VK, Ford-Jones EL. 2012. Spotlight on middle childhood: rejuvenating the ‘forgotten years’. Paediatr Child Health 17:81–83. doi: 10.1093/pch/17.2.81. - DOI - PMC - PubMed
    1. Evans GW, Kim P. 2010. Multiple risk exposure as a potential explanatory mechanism for the socioeconomic status-health gradient. Ann N Y Acad Sci 1186:174–189. doi: 10.1111/j.1749-6632.2009.05336.x. - DOI - PubMed
    1. Sullivan RM, Perry RE. 2015. Mechanisms and functional implications of social buffering in infants: lessons from animal models. Soc Neurosci 10:500–511. doi: 10.1080/17470919.2015.1087425. - DOI - PMC - PubMed
    1. Fisher PA, Gunnar M. 2010. Early life stress as a risk factor for disease in adulthood, p 133–141. In Lanius RA, Vermetten E, Pain C (ed), The impact of early life trauma on health and disease. Cambridge University Press, Cambridge, United Kingdom: https://www.cambridge.org/core/product/identifier/9780511777042%23c88026....
    1. Fisher PA, Gunnar MR, Dozier M, Bruce J, Pears KC. 2006. Effects of therapeutic interventions for foster children on behavioral problems, caregiver attachment, and stress regulatory neural systems. Ann N Y Acad Sci 1094:215–225. doi: 10.1196/annals.1376.023. - DOI - PubMed

Publication types