. 2020 Jan 21;11(1):e03088-19.
doi: 10.1128/mBio.03088-19.

IFITM3 Reduces Retroviral Envelope Abundance and Function and Is Counteracted by glycoGag

Affiliations

IFITM3 Reduces Retroviral Envelope Abundance and Function and Is Counteracted by glycoGag

Yadvinder S Ahi et al. mBio. .

Abstract

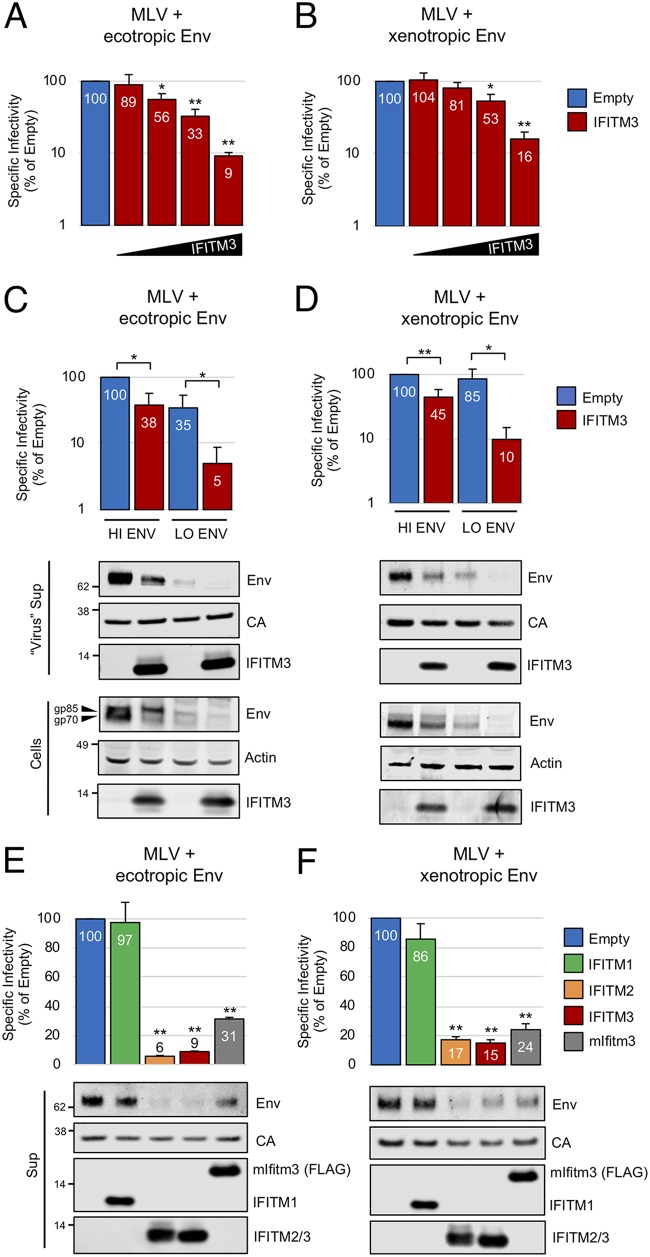
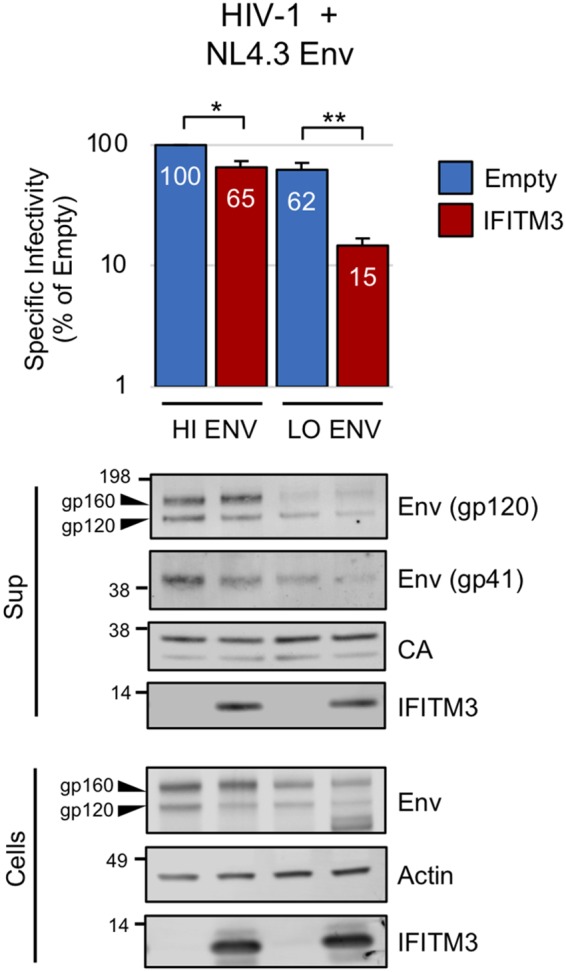
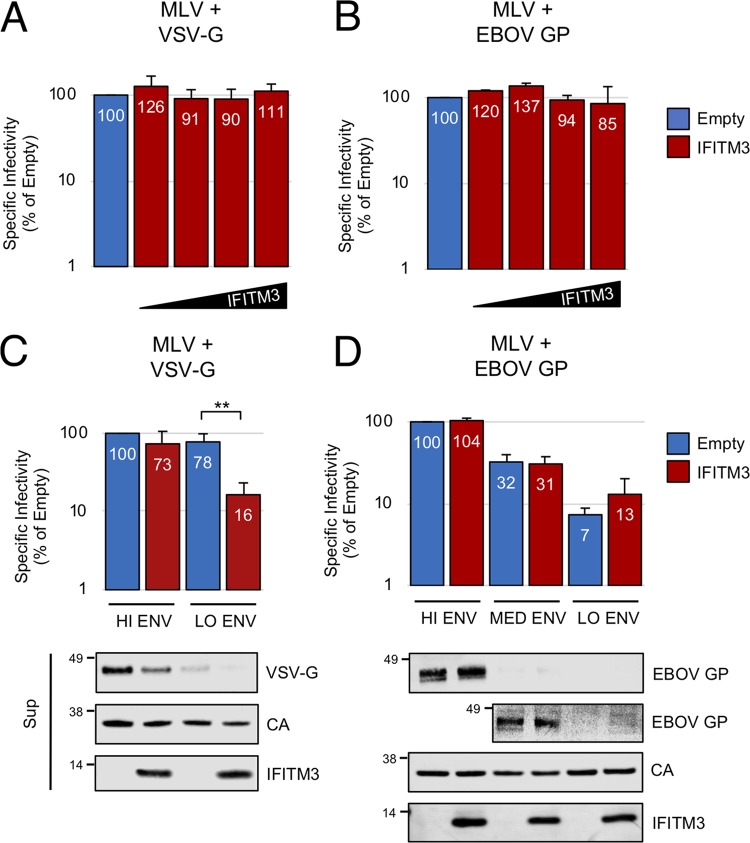
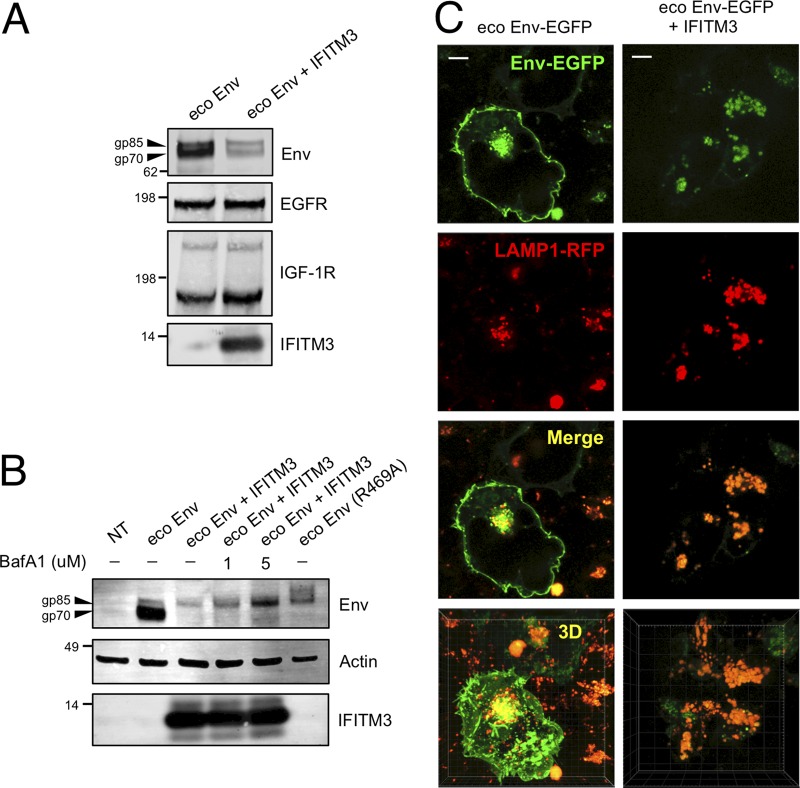
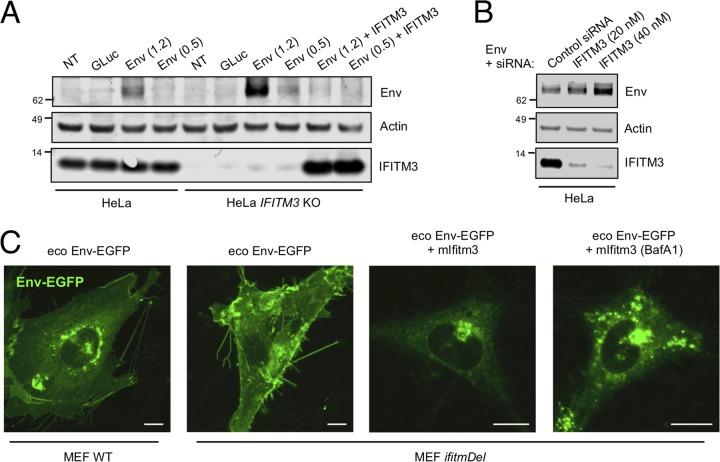
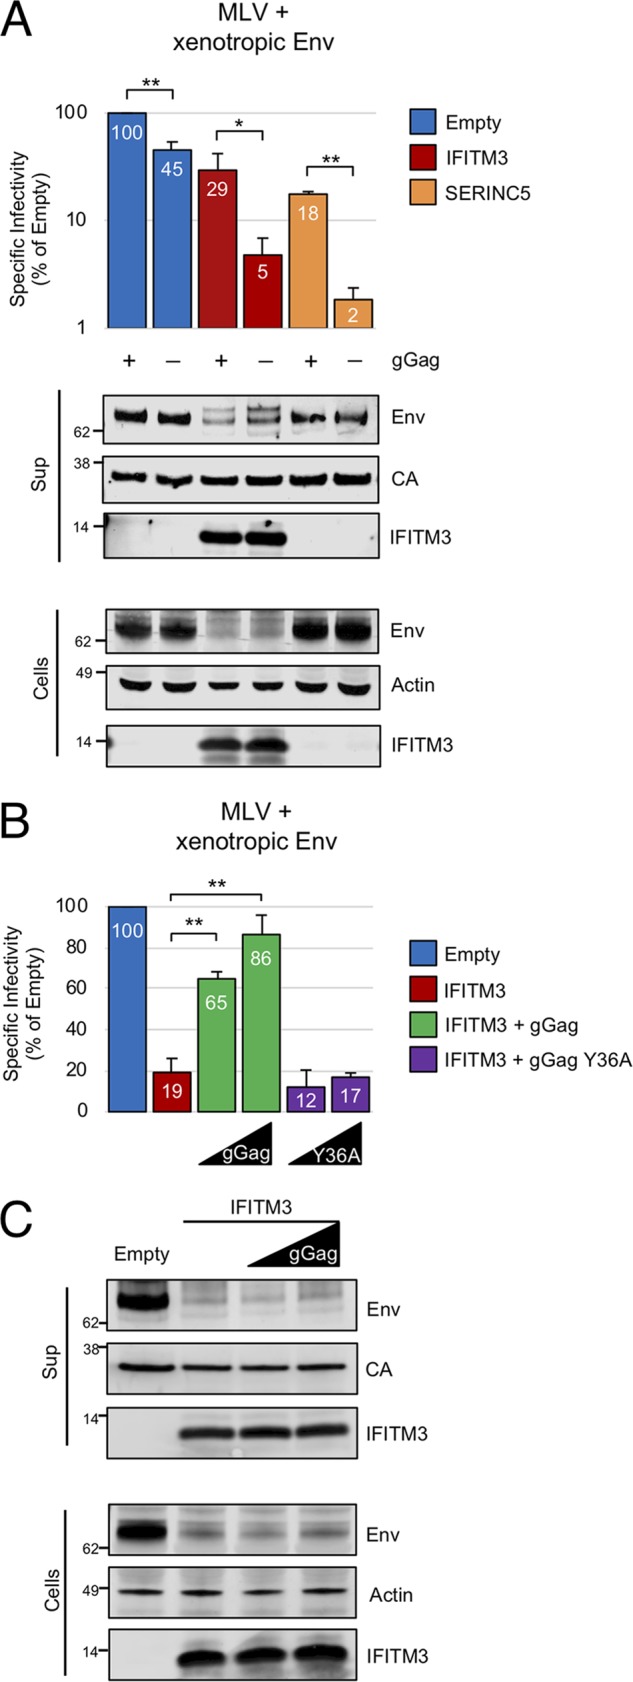
Interferon-induced transmembrane (IFITM) proteins are encoded by many vertebrate species and exhibit antiviral activities against a wide range of viruses. IFITM3, when present in virus-producing cells, reduces the fusion potential of HIV-1 virions, but the mechanism is poorly understood. To define the breadth and mechanistic basis for the antiviral activity of IFITM3, we took advantage of a murine leukemia virus (MLV)-based pseudotyping system. By carefully controlling amounts of IFITM3 and envelope protein (Env) in virus-producing cells, we found that IFITM3 potently inhibits MLV infectivity when Env levels are limiting. Loss of infectivity was associated with defective proteolytic processing of Env and lysosomal degradation of the Env precursor. Ecotropic and xenotropic variants of MLV Env, as well as HIV-1 Env and vesicular stomatitis virus glycoprotein (VSV-G), are sensitive to IFITM3, whereas Ebola glycoprotein is resistant, suggesting that IFITM3 selectively inactivates certain viral glycoproteins. Furthermore, endogenous IFITM3 in human and murine cells negatively regulates MLV Env abundance. However, we found that the negative impact of IFITM3 on virion infectivity is greater than its impact on decreasing Env incorporation, suggesting that IFITM3 may impair Env function, as well as reduce the amount of Env in virions. Finally, we demonstrate that loss of virion infectivity mediated by IFITM3 is reversed by the expression of glycoGag, a murine retrovirus accessory protein previously shown to antagonize the antiviral activity of SERINC proteins. Overall, we show that IFITM3 impairs virion infectivity by regulating Env quantity and function but that enhanced Env expression and glycoGag confer viral resistance to IFITM3.IMPORTANCE The viral envelope glycoprotein, known as "Env" in Retroviridae, is found on the virion surface and facilitates virus entry into cells by mediating cell attachment and fusion. Env is a major structural component of retroviruses and is targeted by all arms of the immune response, including adaptive and innate immunity. Less is known about how cell-intrinsic immunity prevents retrovirus replication at the level of individual cells. Here, we show that cellular IFITM3 and IFITM2 inhibit the fusion potential of retroviral virions by inhibiting Env protein via a two-pronged mechanism. IFITM proteins inhibit Env abundance in cells and also impair its function when levels are low. The posttranslational block of retroviral Env function by IFITM proteins is likely to impede both exogenous and endogenous retrovirus replication. In support of a relevant role for IFITM3 in retrovirus control, the retroviral accessory protein glycoGag counteracts IFITM3 function to promote virus infectivity.

Keywords: Env; IFITM; fusion; innate immunity; retroviruses; viral glycoprotein.


Figures

FIG 1
FIG 1
IFITM2 and IFITM3 inhibit MLV infectivity and decrease Env levels in virus-producing cells. (A) 293T were cotransfected with env-deficient MLV (2.5 μg), pBabeLuc (0.6 μg), ecotropic Env (0.5 μg), and empty pCMV6 or pCMV6-IFITM3 (0.03, 0.09, 0.27, or 0.81 μg). (B) Same as in panel A, except that xenotropic Env was used. (C) 293T were cotransfected with env-deficient MLV (2.5 μg), pBabeLuc (0.6 μg), ecotropic Env (0.5 or 0.1 μg), and empty pCMV6 or pCMV6-IFITM3 (0.27 μg). (D) Same as in panel C, except that xenotropic Env (0.5 or 0.1 μg) was used. (E) 293T cells were cotransfected with env-deficient MLV, ecotropic Env (0.1 μg), and empty pCMV6, pCMV6-IFITM1, pCMV6-IFITM2, pCMV6-IFITM3, or pQCXIP-FLAG-mIfitm3 (0.81 μg). (F) Same as in panel E, except xenotropic Env (0.1 μg) was used. The specific infectivities of viruses produced by transfected cells were measured as described in Materials and Methods; the specific infectivity of virus produced with empty vector was set to 100%. Numbers next to blots indicate molecular weight standards in kilodaltons or specific proteins, when indicated. Data represent averages of three to five independent experiments; for each experiment, infectivities were measured in triplicate and averaged. Statistical analysis for panels A, B, E, and F was performed using one-way ANOVA. Statistical analysis for panels C and D was performed using the Student t test. An asterisk marks a statistically significant difference from empty vector or from the paired condition indicated. Error bars represent standard deviations. *, P < 0.05; **, P < 0.0005.
FIG 2
FIG 2
IFITM3 inhibits HIV-1 infectivity when HIV-1 Env levels are limiting. 293T cells were cotransfected with env-deficient HIV-1 NL4.3 Luc (2.5 μg), pIII-NL-Env (0.5 or 0.1 μg), and empty pCMV6 or pCMV6-IFITM3 (0.27 μg). The specific infectivities of viruses produced by transfected cells were measured as described in Materials and Methods. Numbers next to blots indicate molecular weight standards in kilodaltons or specific proteins, when indicated. Data represent the averages of three independent experiments; for each experiment, infectivities were measured in triplicate and averaged. Statistical analysis was performed with the Student t test. *, P < 0.05; **, P < 0.0005.
FIG 3
FIG 3
IFITM3 inhibits infectivity mediated by VSV-G but not EBOV GP. (A) 293T cells were cotransfected with env-deficient MLV (2.5 μg), pBabeLuc (0.6 μg), VSV-G (0.2 μg), and empty pCMV6 or pCMV6-IFITM3 (0.03, 0.09, 0.27, or 0.81 μg). (B) Same as in panel A, except that EBOV GP (0.2 μg) was used. (C) 293T were cotransfected with env-deficient MLV (2.5 μg), pBabeLuc (0.6 μg), VSV-G (0.04 or 0.008 μg), and empty pCMV6 or pCMV6-IFITM3 (0.27 μg). (D) Same as in panel C, except that EBOV GP (0.2, 0.04, or 0.008 μg) was used. A second image of supernatants is provided under high contrast settings to visualize intermediate amounts of EBOV GP. The specific infectivities of viruses produced by transfected cells were measured as described in Materials and Methods. Data represent the averages of three independent experiments; for each experiment, infectivities were measured in triplicate and averaged. Statistical analysis for panels A and B was performed using one-way ANOVA. Statistical analysis for panels C and D was performed using the Student t test. *, P < 0.05; **, P < 0.0005.
FIG 4
FIG 4
IFITM3 interferes with Env trafficking and promotes its degradation in endolysosomes. (A) 293T cells were transfected with ecotropic Env (0.5 μg) alone or ecotropic Env and pCMV6-IFITM3 (0.27 μg). Transfected cells were lysed at 72 h posttransfection and subjected to SDS-PAGE and Western blotting. (B) 293T cells were transfected with ecotropic Env (1.3 μg) alone, ecotropic Env R469A (1.3 μg) alone, ecotropic Env and pCMV6-IFITM3 (0.20 μg), or not transfected (NT). Cells were lysed 48 h posttransfection. Under the conditions indicated, bafilomycin A1 (1 or 5 μM) was added for a period of 8 h prior to lysing cells. SDS-PAGE and Western blotting was performed. (C) 293T cells were transfected with ecotropic Env-EGFP (0.1 μg) alone or ecotropic Env-EGFP and pCMV6-IFITM3 (0.02 μg). Cells were labeled with LAMP1-RFP using the Cell Bright-Lyso reagent approximately 16 h prior to imaging. Living cells were imaged at 48 h posttransfection. Mander’s coefficients were calculated to determine the proportion of Env-EGFP colocalizing with LAMP1-RFP in the absence (0.20 ± 0.06) or presence of IFITM3 (0.48 ± 0.03). Scale bar, 10 μm. The Western blot analysis and fluorescence images are representative of three independent experiments.
FIG 5
FIG 5
Endogenous IFITM3 negatively regulates Env protein accumulation. (A) HeLa or HeLa IFITM3 KO cells were transfected with Gaussia luciferase (0.001 μg), ecotropic Env (1.2 or 0.5 μg), or ecotropic Env and pCMV6-IFITM3 (0.25 μg). Transfected cells were lysed at 48 h posttransfection and subjected to SDS-PAGE and Western blotting. (B) HeLa cells were transfected with ecotropic Env (1.2 μg) and 20 or 40 nM IFITM3 siRNA or 40 nM control siRNA using Lipofectamine 2000. Transfected cells were lysed at 48 h posttransfection and subjected to SDS-PAGE and Western blotting. (C) MEFs and IfitmDel MEFs were transfected with ecotropic Env-EGFP (0.15 μg) or ecotropic Env-EGFP and pQCXIP-Ifitm3 (0.05 μg). Living cells were imaged at 48 h posttransfection. Under the conditions indicated, bafilomycin A1 (1 μM) was added for 8 h prior to imaging. Scale bar, 10 μm. The Western blot analysis and immunofluorescence images are representative of three independent experiments.
FIG 6
FIG 6
glycoGag rescues retroviral infectivity in the presence of IFITM3. (A) 293T were cotransfected with env-deficient MLV encoding or not encoding glycoGag (2.5 μg), pBabeLuc (0.6 μg), xenotropic Env (0.5 μg), and empty pCMV6, pCMV6-IFITM3 (0.83 μg), or pBJ5-SERINC5 (0.093 μg). (B) 293T were cotransfected with env-deficient MLV (2.5 μg), pBabeLuc (0.6 μg), xenotropic Env (0.5 μg), and empty pCMV6, pCMV6-IFITM3 (0.27 μg). Under the indicated conditions, pCMV-glycoGag-myc of pCMV-glycoGag Y36A-myc (0.01 or 0.03 μg) were included. The specific infectivities of viruses produced by transfected cells were measured as described in Materials and Methods. (C) Transfected cells were lysed at 72 h posttransfection, and virus-containing supernatants from 48 and 72 h posttransfection were filtered, ultracentrifuged through 20% sucrose. Then, SDS-PAGE and Western blotting were performed. The data represent the averages of three independent experiments; for each experiment, infectivities were measured in triplicate and averaged. Statistical analysis in panel A was performed with the Student t test. Statistical analysis in panel B was performed using one-way ANOVA. *, P < 0.05; **, P < 0.0005.

References

    1. Beitari S, Wang Y, Liu S-L, Liang C. 2019. HIV-1 Envelope glycoprotein at the interface of host restriction and virus evasion. Viruses 11:311–316. doi:10.3390/v11040311. - DOI - PMC - PubMed
    1. Compton AA, Schwartz O. 2017. They might be giants: does syncytium formation sink or spread HIV infection? PLoS Pathog 13:e1006099. doi:10.1371/journal.ppat.1006099. - DOI - PMC - PubMed
    1. Braun E, Hotter D, Koepke L, Zech F, Gross R, Sparrer KMJ, Müller JA, Pfaller CK, Heusinger E, Wombacher R, Sutter K, Dittmer U, Winkler M, Simmons G, Jakobsen MR, Conzelmann K-K, Pöhlmann S, Münch J, Fackler OT, Kirchhoff F, Sauter D. 2019. Guanylate-binding proteins 2 and 5 exert broad antiviral activity by inhibiting furin-mediated processing of viral Envelope proteins. Cell Rep 27:2092–2104.e2010. doi:10.1016/j.celrep.2019.04.063. - DOI - PubMed
    1. Rosa A, Chande A, Ziglio S, De Sanctis V, Bertorelli R, Goh SL, McCauley SM, Nowosielska A, Antonarakis SE, Luban J, Santoni FA, Pizzato M. 2015. HIV-1 Nef promotes infection by excluding SERINC5 from virion incorporation. Nature 526:212–217. doi:10.1038/nature15399. - DOI - PMC - PubMed
    1. Usami Y, Wu Y, Göttlinger HG. 2015. SERINC3 and SERINC5 restrict HIV-1 infectivity and are counteracted by Nef. Nature 526:218–223. doi:10.1038/nature15400. - DOI - PMC - PubMed

MeSH terms

LinkOut - more resources