. 2020 Jan 21;5(1):e00660-19.
doi: 10.1128/mSystems.00660-19.

Impacts of the Plateau Environment on the Gut Microbiota and Blood Clinical Indexes in Han and Tibetan Individuals

Affiliations

Impacts of the Plateau Environment on the Gut Microbiota and Blood Clinical Indexes in Han and Tibetan Individuals

Zhilong Jia et al. mSystems. .

Abstract

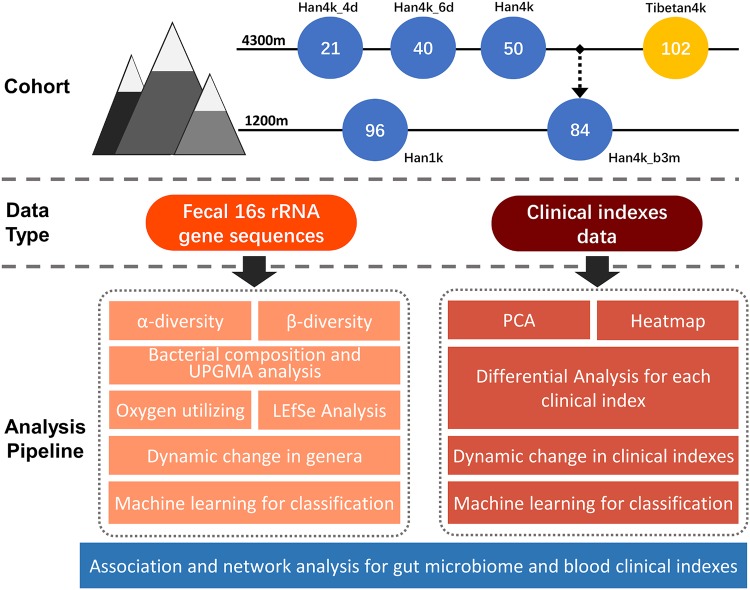
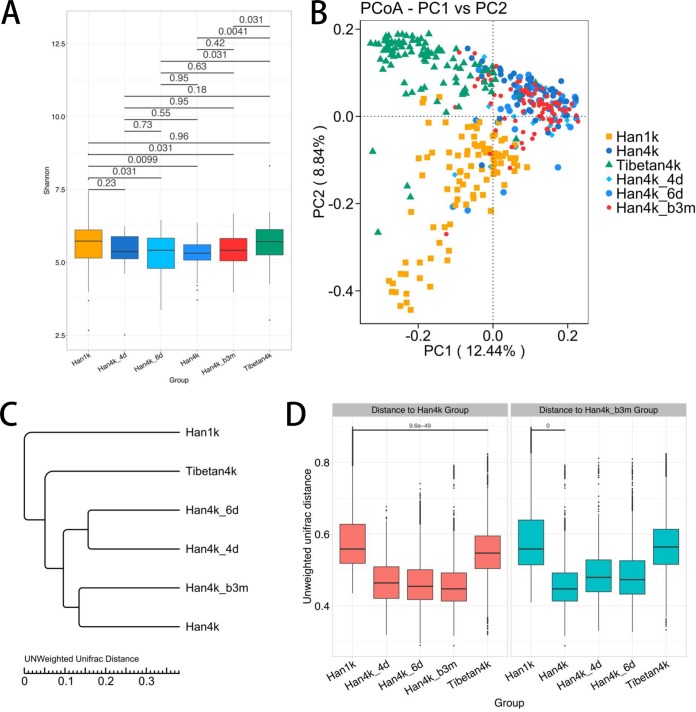
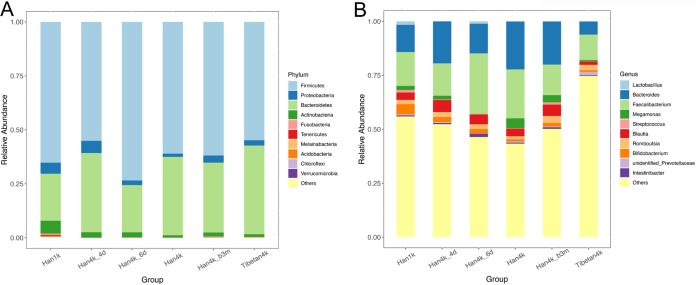
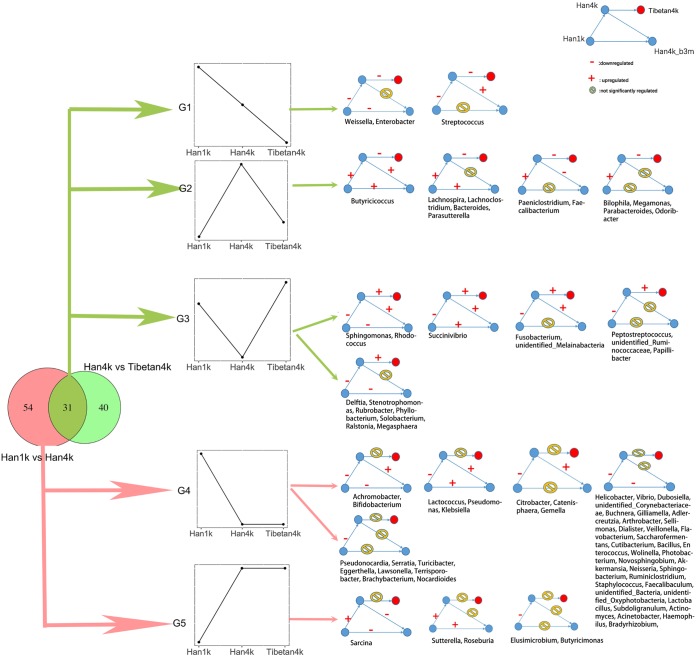
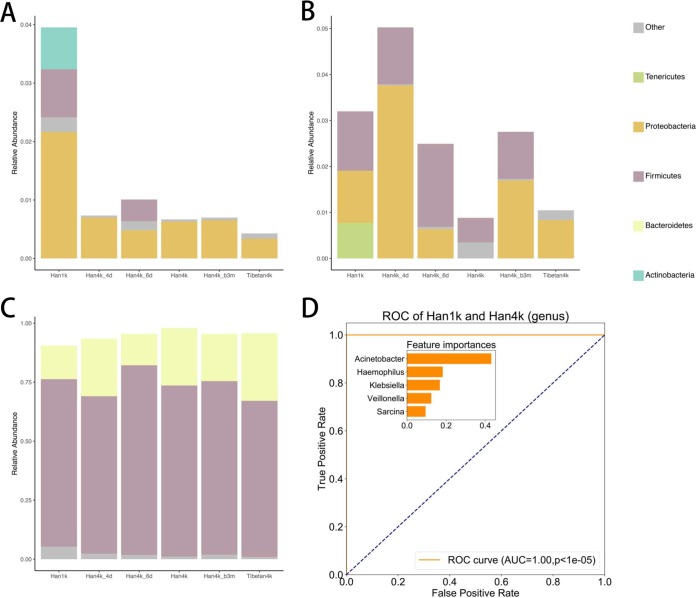
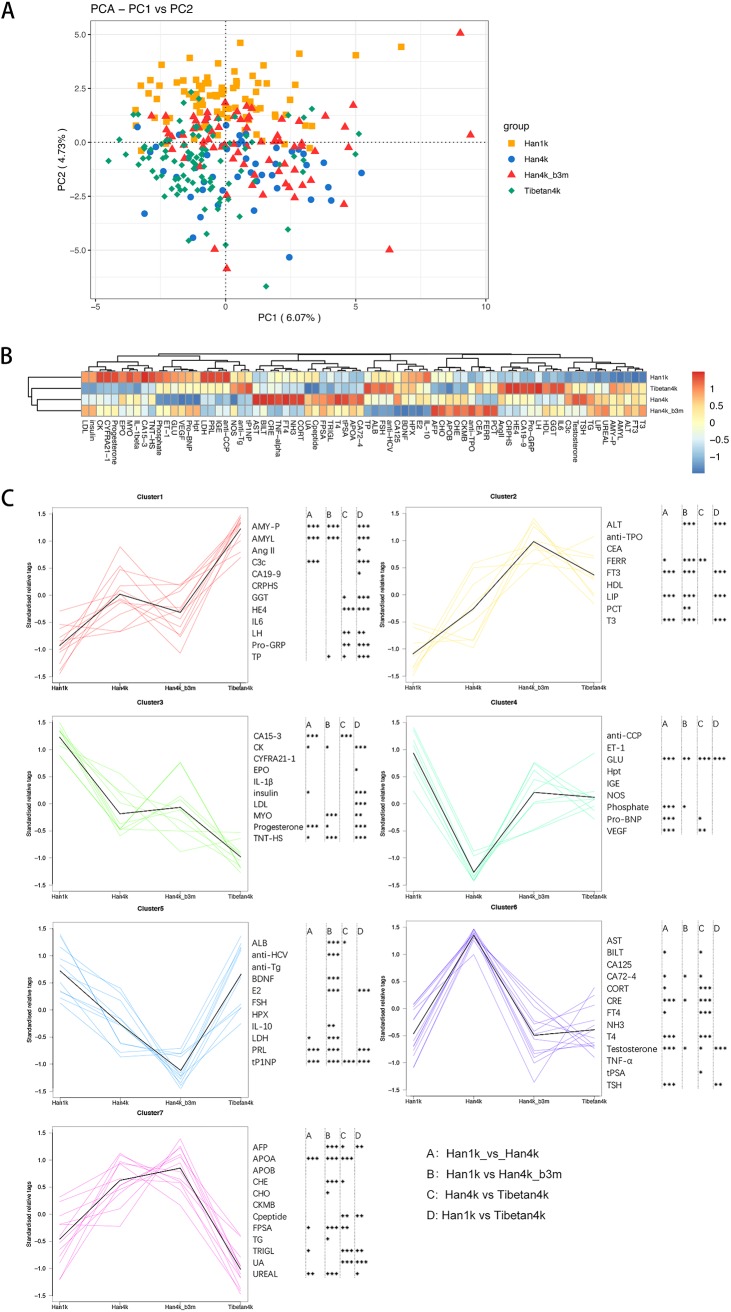
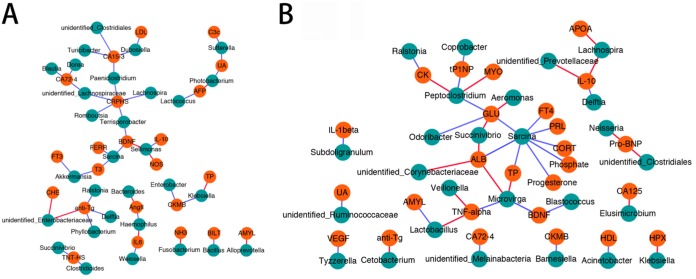
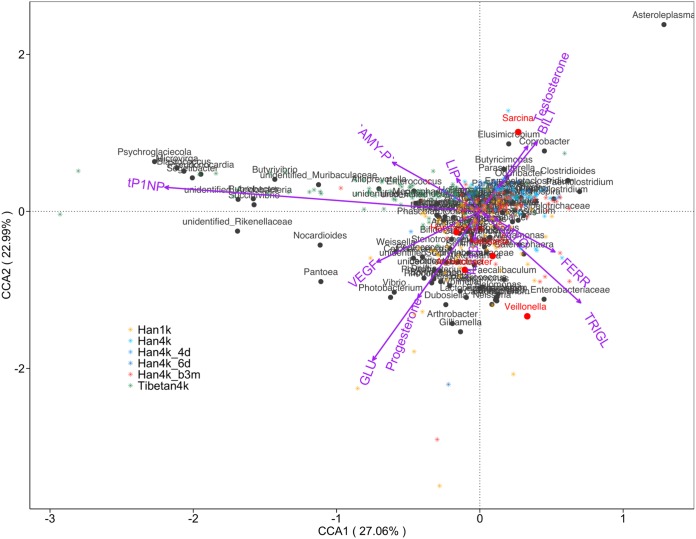
The intestinal microbiota is significantly affected by the external environment, but our understanding of the effects of extreme environments such as plateaus is far from adequate. In this study, we systematically analyzed the variation in the intestinal microbiota and 76 blood clinical indexes among 393 healthy adults with different plateau living durations (Han individuals with no plateau living, with plateau living for 4 to 6 days, with plateau living for >3 months, and who returned to the plain for 3 months, as well as plateau-living Tibetans). The results showed that the high-altitude environment rapidly (4 days) and continually (more than 3 months) shaped both the intestinal microbiota and clinical indexes of the Han population. With prolongation of plateau living, the general characteristics of the intestinal microbiota and clinical indexes of the Han population were increasingly similar to those of the Tibetan population. The intestinal microbiota of the Han population that returned to the plain area for 3 months still resembled that of the plateau-living Han population rather than that of the Han population on the plain. Moreover, clinical indexes such as blood glucose were significantly lower in the plateau groups than in the nonplateau groups, while the opposite result was obtained for testosterone. Interestingly, there were Tibetan-specific correlations between glucose levels and Succinivibrio and Sarcina abundance in the intestine. The results of this study suggest that a hypoxic environment could rapidly and lastingly affect both the human intestinal microbiota and blood clinical indexes, providing new insights for the study of plateau adaptability.IMPORTANCE The data presented in the present study demonstrate that the hypoxic plateau environment has a profound impact on the gut microbiota and blood clinical indexes in Han and Tibetan individuals. The plateau-changed signatures of the gut microbiota and blood clinical indexes were not restored to the nonplateau status in the Han cohorts, even when the individuals returned to the plain from the plateau for several months. Our study will improve the understanding of the great impact of hypoxic environments on the gut microbiota and blood clinical indexes as well as the adaptation mechanism and intervention targets for plateau adaptation.

Keywords: clinical indexes; gut microbiota; plateau environment.


Figures

FIG 1
FIG 1
Overview of the analysis pipeline. The fecal and blood samples were collected and analyzed. The fecal samples were subjected to 16S rRNA gene sequencing followed by diversity analysis, bacterial composition analysis, functional prediction, and differential analysis. The blood samples were analyzed with 76 clinical indexes. The clustering analysis and statistical tests were applied to the clinical indexes. An XGBoost-based machine learning model was used to distinguish the different groups based on the bacterial and clinical indexes. Finally, analysis of the association and network between the gut microbiota and clinical indexes were used to illustrate the correlation and group-specific signatures.
FIG 2
FIG 2
Diversity and distance of the microbial community in each group. (A) The Shannon indexes of the Han4k_6d, Han4k, and Han4k_b3m groups were significantly lower than those of the Han1k and Tibetan4k groups. The FDR-corrected P values shown were based on the Mann-Whitney U test with multiple-testing correction. (B) PCoA based on the unweighted UniFrac distances of the microbial communities between samples. The Han1k, Han4k, and Tibetan4k groups were representative and different from each other. Han4k_4d and Han4k_6d were closer to Han4k than to Han1k, and Han4k_b3m was closer to Han4k than to Han1k. (C) UPGMA tree based on the unweighted UniFrac distances between groups. (D) Unweighted UniFrac distances of different groups from the Han4k and Han4k_b3m groups. Statistical significance was labeled only for comparisons of interest.
FIG 3
FIG 3
Bacterial composition in each group. (A) Relative abundances of the top 10 phyla. (B) Relative abundances of the top 10 genera.
FIG 4
FIG 4
Dynamic changes in genera between different groups. The Venn diagram on the left shows the number of differentially abundant genera between Han1k and Han4k (left) and between Han4k and Tibetan4k (right) as well as the overlap between these genera. Five groups (G1 to G5), representing different change trends in the Han1k, Han4k, and Tibetan4k groups, are shown in the middle. On the right, a detailed changing trend in the Han1k, Han4k, Han4k_b3m, and Tibetan4k groups is presented with genera shown. Red dots, Tibetan4k; −, downregulated; +, upregulated; yellow circles with diagonal bars, no significant difference between two sample groups. The genera are listed in each group.
FIG 5
FIG 5
BugBase functional analysis of the gut microbiota in each group. (A) Aerobic bacterial composition in each group. (B) Facultative anaerobic bacterial composition in each group. (C) Anaerobic bacterial composition in each group. (D) Performance of the classification of Han1k and Han4k in the test data set and feature importance using an XGBoost model. AUC was used to evaluate the performance and a permutation test was used to obtain the P value.
FIG 6
FIG 6
PCA and heat map of the groups based on the clinical parameters and the trend for clinical parameters among the Han1k, Han4k, Han4k_b3m, and Tibetan4k groups. (A) PCA plot of the Han1k, Han4k, Han4k_b3m, and Tibetan4k groups based on all the clinical parameter data. (B) Heat map and hierarchical clustering of the groups based on all the clinical parameter data. Groups are shown on the y axis, while clinical parameters are shown on the x axis. (C) Trends among the groups based on the clinical indexes; k-means was used to cluster the clinical parameters. Han1k, Han4k, Han4k_b3m, and Tibetan4k are shown on the x axis accordingly, while the scaled abundance of clinical parameters is shown on the y axis. The Wilcoxon statistical significance is annotated on the right: A (comparison between Han1k and Han4k), B (comparison between Han1k and Han4k_b3m), C (comparison between Han4k and Tibetan4k), and D (comparison between Han1k and Tibetan4k). *, P < 0.05; **, P < 0.01; ***, P < 0.001.
FIG 7
FIG 7
Clinical indexes and gut microbiota networks in Han1k and Tibetan4k. Only connections between clinical indexes and the gut microbiota are shown in the networks. (A) Clinical indexes and gut microbiota network in Han1k. (B) Clinical indexes and gut microbiota network in Tibetan4k. Cyan dots, bacteria; orange dots, clinical parameters; blue connecting lines, negative correlations; red connecting lines, positive correlations.
FIG 8
FIG 8
Canonical correspondence analysis of the clinical indexes and bacterial composition. The graph shows the relationships among samples (stars), clinical indexes (vectors), and bacteria (dots). The colors of the stars represent sample groups. The segment length of each blood clinical index indicates the strength of the association between the variable and the microbial community. Bacteria indicated by red dots were used in the XGBoost-based classification of Han1k and Han4k.

References

    1. Yu J, Zeng Y, Chen G, Bian S, Qiu Y, Liu X, Xu B, Song P, Zhang J, Qin J, Huang L. 2016. Analysis of high-altitude syndrome and the underlying gene polymorphisms associated with acute mountain sickness after a rapid ascent to high-altitude. Sci Rep 6:38323. doi: 10.1038/srep38323. - DOI - PMC - PubMed
    1. Huerta-Sanchez E, Jin X, Asan, Bianba Z, Peter BM, Vinckenbosch N, Liang Y, Yi X, He M, Somel M, Ni P, Wang B, Ou X, Huasang, Luosang J, Cuo ZX, Li K, Gao G, Yin Y, Wang W, Zhang X, Xu X, Yang H, Li Y, Wang J, Wang J, Nielsen R. 2014. Altitude adaptation in Tibetans caused by introgression of Denisovan-like DNA. Nature 512:194–197. doi: 10.1038/nature13408. - DOI - PMC - PubMed
    1. Lou H, Lu Y, Lu D, Fu R, Wang X, Feng Q, Wu S, Yang Y, Li S, Kang L, Guan Y, Hoh BP, Chung YJ, Jin L, Su B, Xu S. 2015. A 3.4-kb copy-number deletion near EPAS1 is significantly enriched in high-altitude Tibetans but absent from the Denisovan sequence. Am J Hum Genet 97:54–66. doi: 10.1016/j.ajhg.2015.05.005. - DOI - PMC - PubMed
    1. Zhou D, Udpa N, Ronen R, Stobdan T, Liang J, Appenzeller O, Zhao HW, Yin Y, Du Y, Guo L, Cao R, Wang Y, Jin X, Huang C, Jia W, Cao D, Guo G, Gamboa JL, Villafuerte F, Callacondo D, Xue J, Liu S, Frazer KA, Li Y, Bafna V, Haddad GG. 2013. Whole-genome sequencing uncovers the genetic basis of chronic mountain sickness in Andean highlanders. Am J Hum Genet 93:452–462. doi: 10.1016/j.ajhg.2013.07.011. - DOI - PMC - PubMed
    1. Bigham AW, Lee FS. 2014. Human high-altitude adaptation: forward genetics meets the HIF pathway. Genes Dev 28:2189–2204. doi: 10.1101/gad.250167.114. - DOI - PMC - PubMed

LinkOut - more resources