

Far-field midinfrared superresolution imaging and spectroscopy of single high aspect ratio gold nanowires
- PMID: 31964821
- PMCID: PMC7007563
- DOI: 10.1073/pnas.1916433117
Far-field midinfrared superresolution imaging and spectroscopy of single high aspect ratio gold nanowires
Abstract
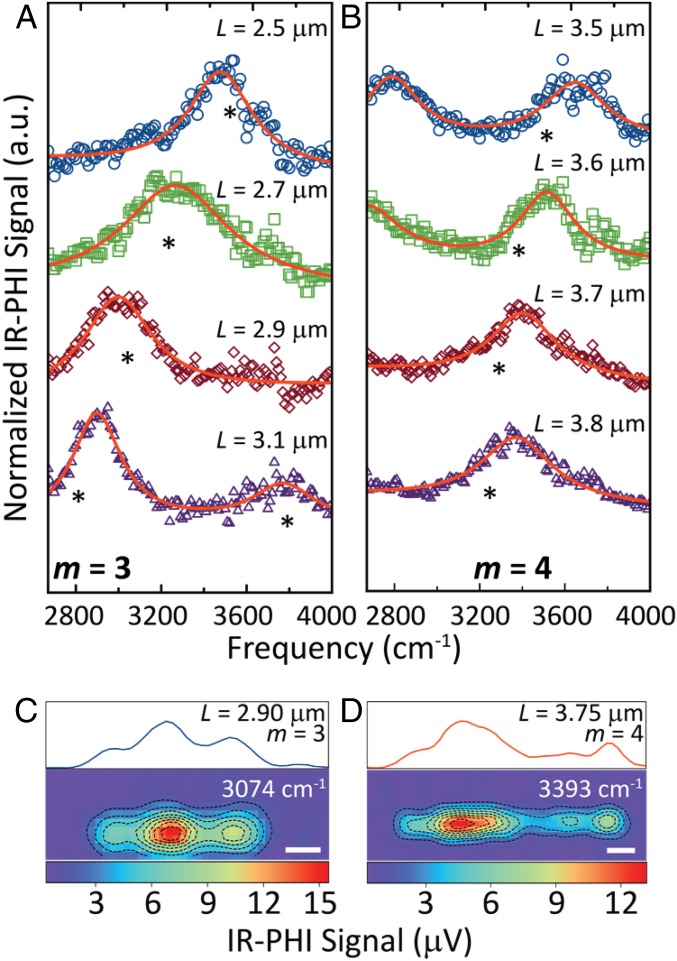
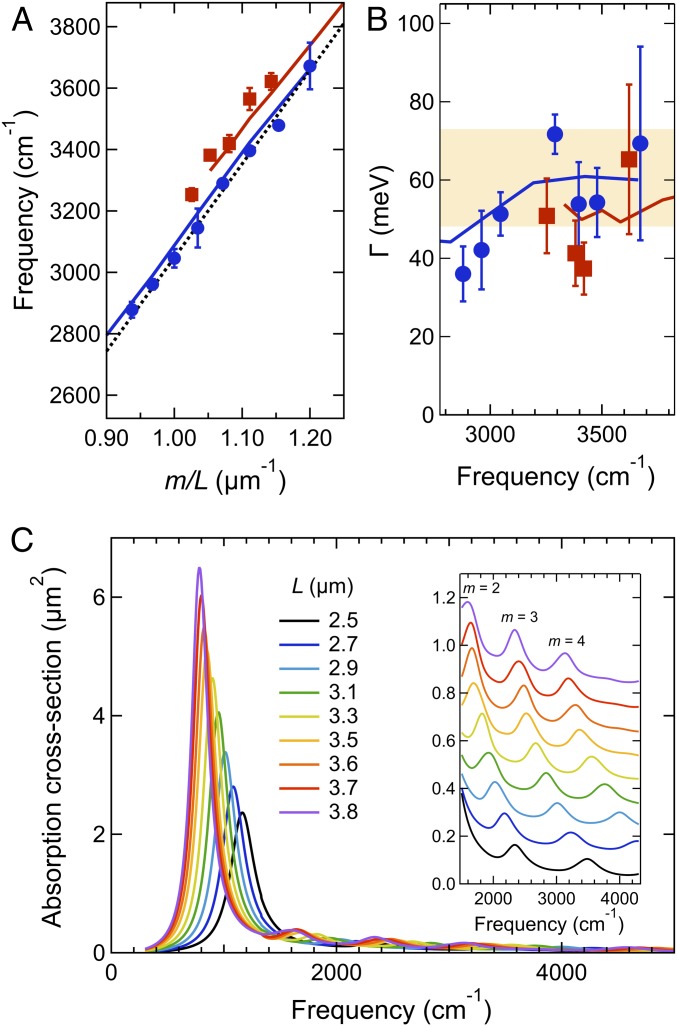
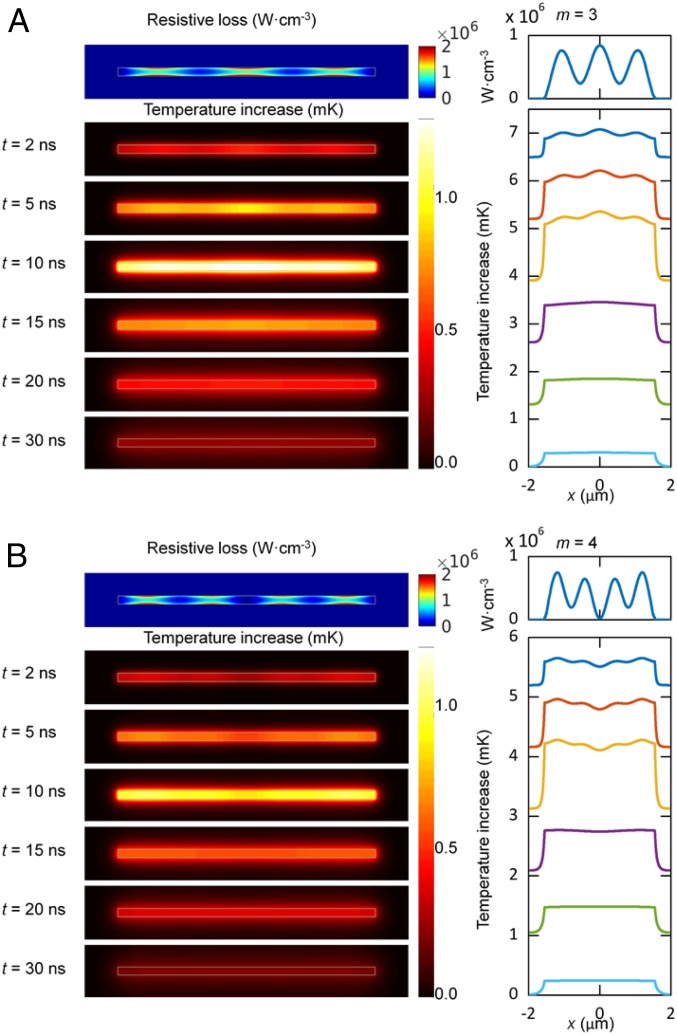
Limited approaches exist for imaging and recording spectra of individual nanostructures in the midinfrared region. Here we use infrared photothermal heterodyne imaging (IR-PHI) to interrogate single, high aspect ratio Au nanowires (NWs). Spectra recorded between 2,800 and 4,000 cm-1 for 2.5-3.9-μm-long NWs reveal a series of resonances due to the Fabry-Pérot modes of the NWs. Crucially, IR-PHI images show structure that reflects the spatial distribution of the NW absorption, and allow the resonances to be assigned to the m = 3 and m = 4 Fabry-Pérot modes. This far-field optical measurement has been used to image the mode structure of plasmon resonances in metal nanostructures, and is made possible by the superresolution capabilities of IR-PHI. The linewidths in the NW spectra range from 35 to 75 meV and, in several cases, are significantly below the limiting values predicted by the bulk Au Drude damping parameter. These linewidths imply long dephasing times, and are attributed to reduction in both radiation damping and resistive heating effects in the NWs. Compared to previous imaging studies of NW Fabry-Pérot modes using electron microscopy or near-field optical scanning techniques, IR-PHI experiments are performed under ambient conditions, enabling detailed studies of how the environment affects mid-IR plasmons.
Keywords: Fabry–Pérot modes; photothermal imaging; plasmons; single-particle spectroscopy.
Conflict of interest statement
The authors declare no competing interest.
Figures
References
-
- Maier S. A., et al. , Local detection of electromagnetic energy transport below the diffraction limit in metal nanoparticle plasmon waveguides. Nat. Mater. 2, 229–232 (2003). - PubMed
-
- Lal S., Link S., Halas N. J., Nano-optics from sensing to waveguiding. Nat. Photonics 1, 641–648 (2007).
-
- Linic S., Christopher P., Ingram D. B., Plasmonic-metal nanostructures for efficient conversion of solar to chemical energy. Nat. Mater. 10, 911–921 (2011). - PubMed
-
- Clavero C., Plasmon-induced hot-electron generation at nanoparticle/metal-oxide interfaces for photovoltaic and photocatalytic devices. Nat. Photonics 8, 95–103 (2014).
-
- Willets K. A., Van Duyne R. P., Localized surface plasmon resonance spectroscopy and sensing. Annu. Rev. Phys. Chem. 58, 267–297 (2007). - PubMed
Publication types
LinkOut - more resources
Full Text Sources
Other Literature Sources
