. 2020 Feb 4;117(5):2456-2461.
doi: 10.1073/pnas.1911188117. Epub 2020 Jan 21.

Nucleosomal proofreading of activator-promoter interactions

Affiliations

Nucleosomal proofreading of activator-promoter interactions

Robert Shelansky et al. Proc Natl Acad Sci U S A. .

Abstract

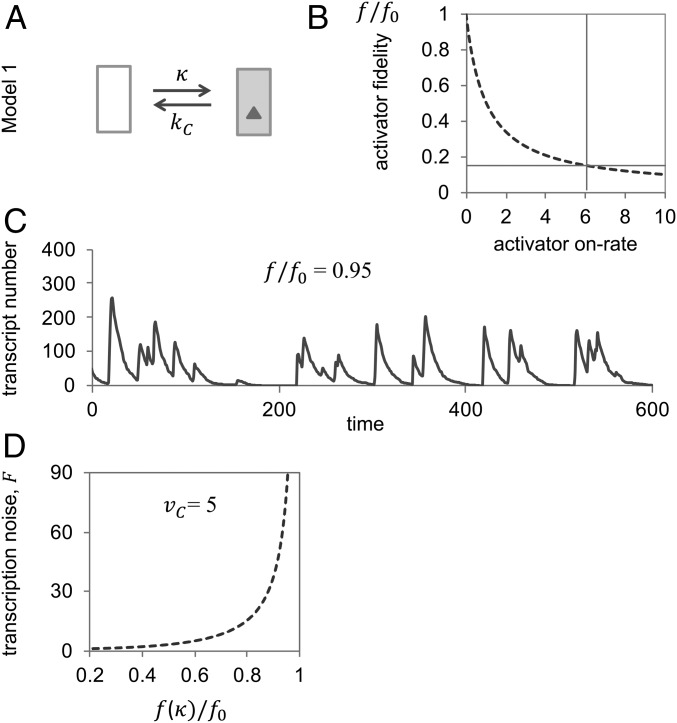
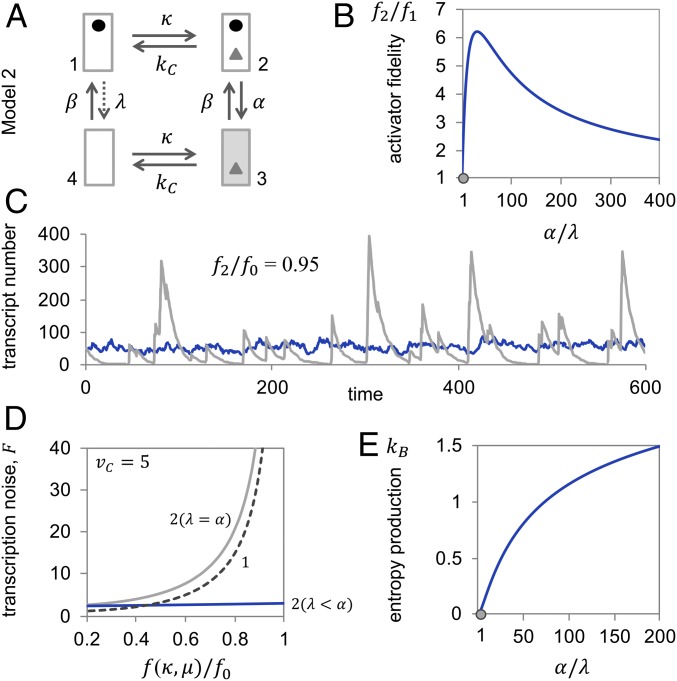
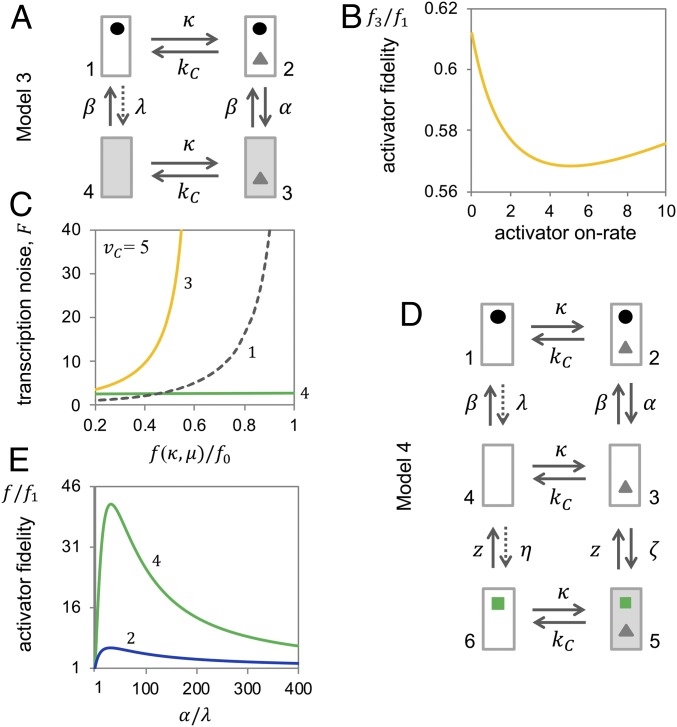
Specificity in transcriptional regulation is imparted by transcriptional activators that bind to specific DNA sequences from which they stimulate transcription. Specificity may be increased by slowing down the kinetics of regulation: by increasing the energy for dissociation of the activator-DNA complex or decreasing activator concentration. In general, higher dissociation energies imply longer DNA dwell times of the activator; the activator-bound gene may not readily turn off again. Lower activator concentrations entail longer pauses between binding events; the activator-unbound gene is not easily turned on again and activated transcription occurs in stochastic bursts. We show that kinetic proofreading of activator-DNA recognition-insertion of an energy-dissipating delay step into the activation pathway for transcription-reconciles high specificity of transcriptional regulation with fast regulatory kinetics. We show that kinetic proofreading results from the stochastic removal and reformation of promoter nucleosomes, at a distance from equilibrium.

Keywords: entropy production; irreversibility; kinetic proofreading; nucleosome; transcriptional regulation.


Conflict of interest statement

The authors declare no competing interest.

Figures

Fig. 1.
Fig. 1.
Standard two-state promoter model (Model 1): activator fidelity is bounded by the Hopfield barrier. (A) Transition graph of Model 1. (B) Activator fidelity approaches its upper limit or Hopfield barrier, f0=eΔΔG°/RT, as the activator on rate, κ, tends to zero. To calculate the graph, we assumed kC=1, ki=100. Actual fidelities must be markedly lower than f0: for instance, measured off-rates for Pho4 of yeast (the activator of PHO5) for specific and nonspecific sequences are ∼0.01 and 1 s−1, respectively (7, 9). From Pho4’s equilibrium dissociation constant for correct binding of Kd=11 nM (9), and nuclear concentration of 60 nM (47) (assuming a nuclear volume of 4 femtoliters), both the on-rate, κ=0.06s1 (indicated by a vertical line), and relative fidelity (indicated by horizontal line) may be calculated; the unit on the abscissa, then, is 0.01s1. (C) Representative “sample path” (single cell trajectory of mRNA abundance) at relative activator fidelity of 0.95; the sample path was obtained with the Gillespie stochastic simulation algorithm (48) with κ=0.05, kC=1, δ=0.1 (rate constant for mRNA degradation), and average rate of transcription, vC=5. (D) The Fano factor tends to infinity as activator fidelity, f1, approaches the Hopfield barrier (i.e.,f1/f0=1). Calculations were based on the assumption of kC=1, δ=0.1, and average rate of transcription vC=5. Both Fano factor and fidelity were calculated as functions of the activator on-rate, κ (SI Appendix).
Fig. 2.
Fig. 2.
Nucleosome dynamics away from, but not in, equilibrium allow for increased activator fidelity and attenuation of transcription noise. (A) Transition graph of Model 2. (B) Activator fidelity of Model 2 (f2) normalized by the fidelity of Model 1 (f1), as a function of the rate of nucleosome removal in the activator-bound state, α, normalized by the rate of removal in the unbound state, λ. For calculations, we assumed κ=1, kC=1, ki=100, β=2, and λ=0.1. The gray dot indicates the equilibrium state. (C) Representative sample paths at relative activator fidelity f2/f0=0.95 and vC=5 for nonequilibrium nucleosome dynamics (dark gray; α=2, λ=0.1), which required κ=4.26 and μ=13.26; and equilibrium dynamics (light gray; α,λ=2), which required κ=0.053 and μ=198.68. For both simulations, we assumed δ=0.1. (D) Transcription noise as a function of relative activator fidelity, f(κ,μ)/f0, for Model 2 in equilibrium (light gray, 2 [α = λ]; α, λ = 2), away from equilibrium (blue, 2 [α > λ]; α=2, λ=0.1), and Model 1 (dashed line, 1; same as in Fig. 1D). For all calculations, we assumed, as above, kC=1, δ=0.1, and vC=5. Fano factor and activator fidelity were calculated as functions of the activator on-rate, κ, and the rate of transcription in the active state, μ (SI Appendix). (E) Entropy production (in units of kB, the Boltzmann constant) as a function of nucleosome removal rate in the activator-bound state, α, relative to the rate in the unbound state, λ=0.1, for κ=1, kC=1, and β=2. The gray dot indicates the equilibrium state.
Fig. 3.
Fig. 3.
Kinetic proofreading requires coupling of transcript initiation to activator binding; multiple proofreading steps improve fidelity. (A) Transition graph of Model 3. (B) Activator fidelity of Model 3 (f3) relative to the fidelity of Model 1 (f1), as a function of activator on-rate, κ; with kC=1, ki=100, α = β=2, and λ=0 (for λ>0, fidelities further decrease). (C) Transcription noise as a function of relative activator fidelity, f(κ,μ)/f0, for Model 3 (yellow, 3), Model 4 (green, 4), and Model 1 (gray dashed line, 1). As in calculations for Fig. 2, we assumed δ=0.1 and vC=5; for Model 4 alone: λ=0.1 and z,ζ=10 to reflect both active removal (by Mot1) and high concentration of TBP; all other parameters were as indicated above. Fano factor and fidelity were calculated as functions of the activator on-rate, κ, and the rate of transcription in the active state, μ (SI Appendix). (D) Transition graph of Model 4. (E) Activator fidelities of Model 4 (green, 4) and Model 2 (blue, 2) relative to fidelity for Model 1 as a function of α/λ. For Model 4, we assumed α=ζ (thus, both parameters are varied equally) and λ,η=0.1. Other rate constants were kC=1, ki=100, β=2, and z=10. (For smaller λ,η,β, and z than assumed here, fidelity further increases; SI Appendix.)

References

    1. Mao C., et al. , Quantitative analysis of the transcription control mechanism. Mol. Syst. Biol. 6, 431 (2010). - PMC - PubMed
    1. Ptashne M., Gann A., Transcriptional activation by recruitment. Nature 386, 569–577 (1997). - PubMed
    1. Bryant G. O., Ptashne M., Independent recruitment in vivo by Gal4 of two complexes required for transcription. Mol. Cell 11, 1301–1309 (2003). - PubMed
    1. Cosma M. P., Tanaka T., Nasmyth K., Ordered recruitment of transcription and chromatin remodeling factors to a cell cycle- and developmentally regulated promoter. Cell 97, 299–311 (1999). - PubMed
    1. Kuras L., Borggrefe T., Kornberg R. D., Association of the Mediator complex with enhancers of active genes. Proc. Natl. Acad. Sci. U.S.A. 100, 13887–13891 (2003). - PMC - PubMed

Publication types

MeSH terms