. 2020 Jan 22:26:e919566.
doi: 10.12659/MSM.919566.

Trop2 Promotes Multidrug Resistance by Regulating Notch1 Signaling Pathway in Gastric Cancer Cells

Affiliations

Trop2 Promotes Multidrug Resistance by Regulating Notch1 Signaling Pathway in Gastric Cancer Cells

Xingwang Kuai et al. Med Sci Monit. .

Abstract

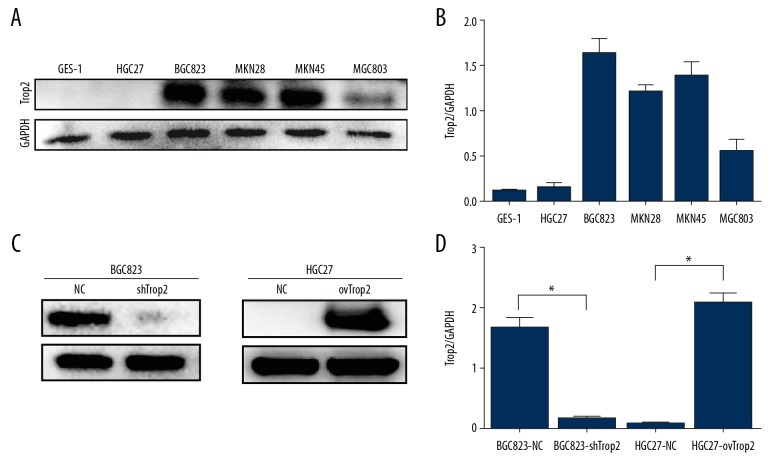
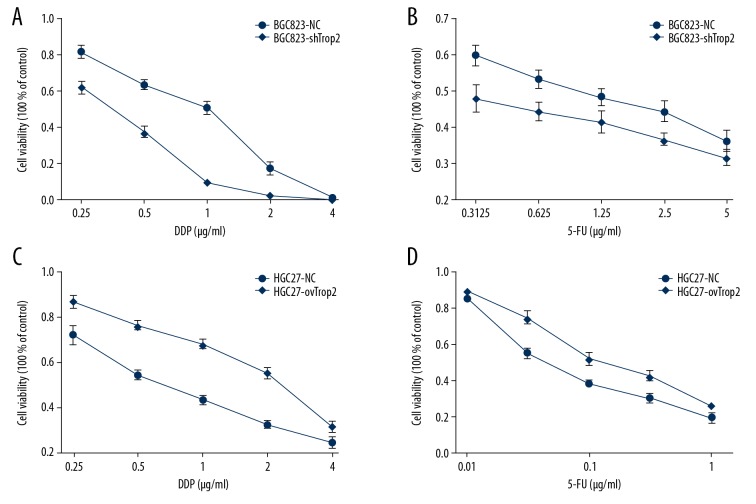
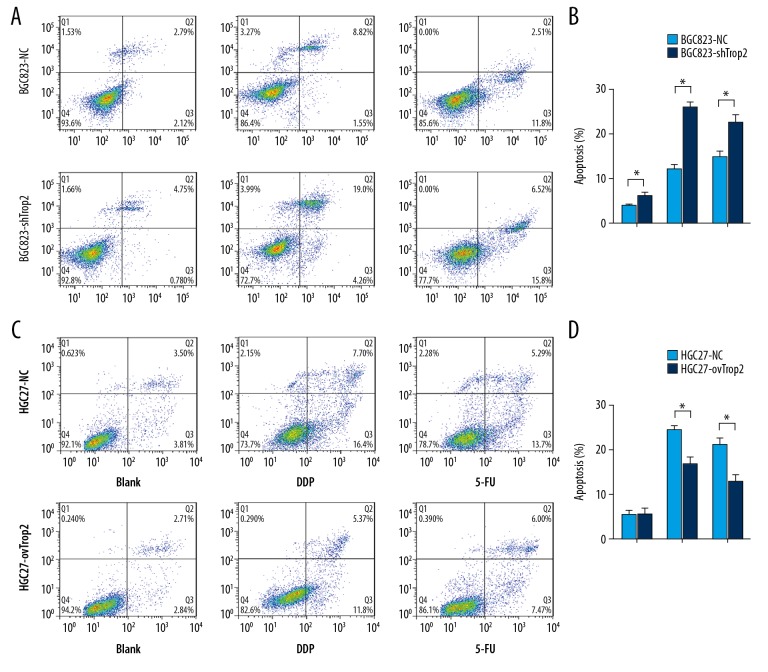
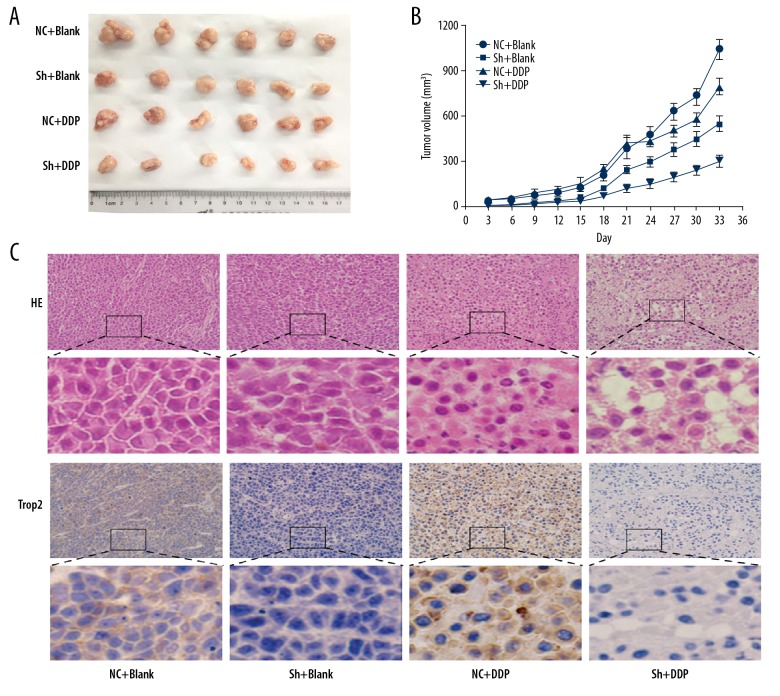
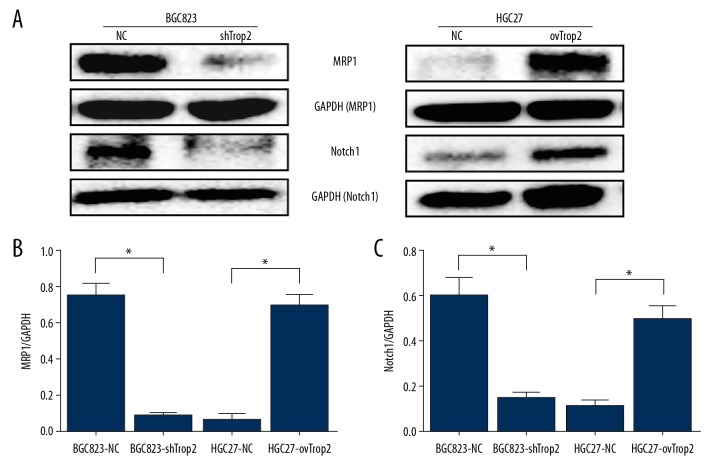
BACKGROUND Chemotherapy is widely used in gastric cancer treatment, but multidrug resistance remains a leading cause of chemotherapy failure. Trop2 is highly expressed in gastric tumor tissues and greatly influences cancer progression. However, little is known about the relationship between Trop2 and drug resistance in gastric cancer. MATERIAL AND METHODS In the present study, Trop2 was knocked down in BGC823 cells and overexpressed in HGC27. CCK-8 assay was performed to explore the relationship of Trop2 expression and cell proliferation treated with anticancer drugs. Flow cytometry was performed to assess the relationship between Trop2 and cell apoptosis after chemotherapy. Subcutaneous xenograft models were generated to explore the curative effect of DDP to GC in vivo. MRP1 and Notch1 expressions were assessed by Western blot. RESULTS Trop2 decreased cell proliferation inhibition and apoptosis after chemotherapeutic treatments. DDP showed stronger therapeutic effects on Trop2-knockdown tumor than control in vivo. MRP1 and Notch1 signaling pathway were confirmed to participate in Trop2-induced drug resistance. CONCLUSIONS Our findings suggest that Trop2 promotes the resistance of gastric cancer to chemotherapy by activating the Notch1 pathway.


Conflict of interest statement

Conflict of interest

None.

Figures

Figure 1
Figure 1
Trop2 expression in gastric cells and the constructions of stable cell lines. (A, B) Western blot analysis showed that HGC27 cells had relatively low Trop2 expression, and Trop2 protein level in BGC823 cells was higher than in other cell lines. (C, D) BGC823-shTrop2 cells expressed less Trop2 protein than BGC823-NC cells, and HGC27-ovTrop2 cells showed significantly more expression of Trop2 than HGC27-NC cells.
Figure 2
Figure 2
Trop2 dysregulation affected GC cell proliferation inhibition induced by drugs. (A) The IC50 value of DDP in BGC823-shTrop2 cells was 0.355±0.033 μg/ml, lower than that of BGC823-NC (0.701±0.083μg/ml) (P=0.002). (B) BGC823-shTrop2 treated with 5-FU showed a lower IC50 value(0.338±0.253μg/ml) than that of BGC823-NC (1.101±0.470/ml) (P=0.011). (C) The IC50 value of DDP in HGC27-ovTrop2 cells was 2.102±0.274μg/ml, higher than that of HGC27-NC cells (0.749±0.163μg/ml) (P=0.002). (D) HGC27-ovTrop2 cells treated with 5-FU showed a higher IC50 value (0.172±0.038μg/ml) than that of HGC27-NC cells (0.069±0.007/ml) (P=0.01).
Figure 3
Figure 3
Trop2 variation regulated GC cell apoptosis after chemotherapy. (A, B) The apoptosis rates of BGC823-NC and BGC823-shTrop2 cells were 3.84±0.635% and 6.31±2.13%, respectively. The apoptosis rates of BGC823-NC and BGC823-shTrop2 exposed to DDP were 11.907±1.571% and 26.407±2.784%, respectively. The apoptosis rates of BGC823-NC and BGC823-shTrop2 exposed to 5-FU were 17.707±2.479% and 22.227±3.822%, respectively. (C, D) The apoptosis rates of HGC27-NC and HGC27-ovTrop2 were 5.533±1.854% and 5.503±2.340%, respectively. The apoptosis rates of HGC27-NC and HGC27-ovTrop2 exposed to DDP were 24.533±1.512% and 16.687±3.222%, respectively. The apoptosis rates of HGC27-NC and HGC27-ovTrop2 exposed to 5-FU were 21.157±2.486% and 12.830±2.923%, respectively. * P<0.05
Figure 4
Figure 4
Downregulation of Trop2 increased drug response to DDP in the xenograft mouse model. (A, B) The growth rate of tumors in mouse models were inhibited after DDP treatment in vivo. The efficacy of chemotherapy was higher in the Trop2-knockdown group. (C) H&E staining of tumor samples showed that morphologic change of cells and more foci of hemorrhage and necrosis appeared after chemotherapy. Especially in the Trop2 knockdown group, greater degrees of vacuolar formation indicated more chemotherapeutic effect. Original widow is ×200, magnified window is ×800.
Figure 5
Figure 5
Trop2 promoted MRP1 expression by Notch1 signal pathway. (A) Western blot showed that Trop2 knockdown inhibited the expressions of MRP1 and Notch1, and Trop2 overexpression promoted the expressions of MRP1 and Notch1. (B, C) IOD value of Western blot.

References

    1. Van CE, Sagaert X, Topal B, et al. Gastric cancer. Lancet. 2016;388:2654–64. - PubMed
    1. Yuan D-D, Zhu Z-X, Zhang XIA, Liu JIE. Targeted therapy for gastric cancer: Current status and future directions (Review) Oncol Rep. 2016;35:1245–54. - PubMed
    1. Lipinski M, Parks DR, Rouse RV, Herzenberg LA. Human trophoblast cell-surface antigens defined by monoclonal antibodies. Proc Natl Acad Sci USA. 1981;78:5147–50. - PMC - PubMed
    1. Zhao W, Zhu H, Zhang S, et al. Trop2 is overexpressed in gastric cancer and predicts poor prognosis. Oncotarget. 2016;7:6136–45. - PMC - PubMed
    1. Vazirigohar A, Houston KD. GPER1-mediated IGFBP-1 induction modulates IGF-1-dependent signaling in tamoxifen-treated breast cancer cells. Mol Cell Endocrinol. 2015;422:160–71. - PMC - PubMed

MeSH terms