. 2020 Jan 21;11(1):409.
doi: 10.1038/s41467-019-14038-9.

Golgi organization is regulated by proteasomal degradation

Affiliations

Golgi organization is regulated by proteasomal degradation

Avital Eisenberg-Lerner et al. Nat Commun. .

Abstract

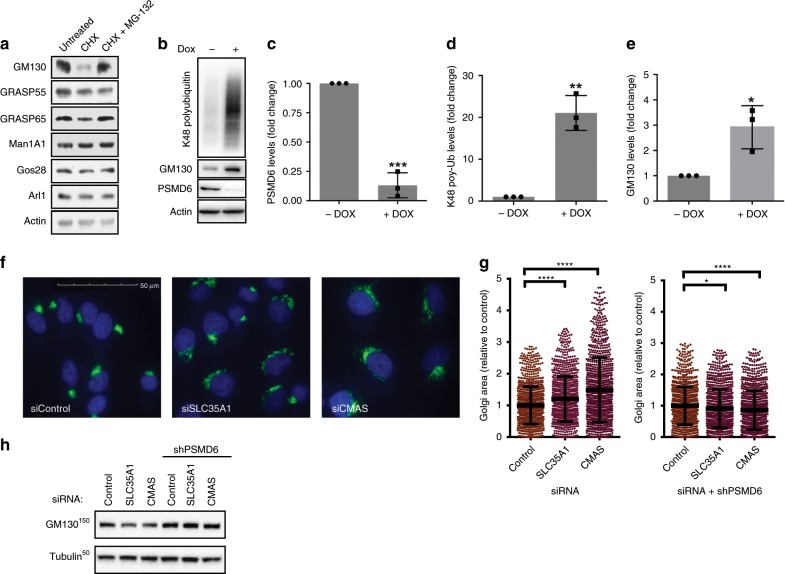
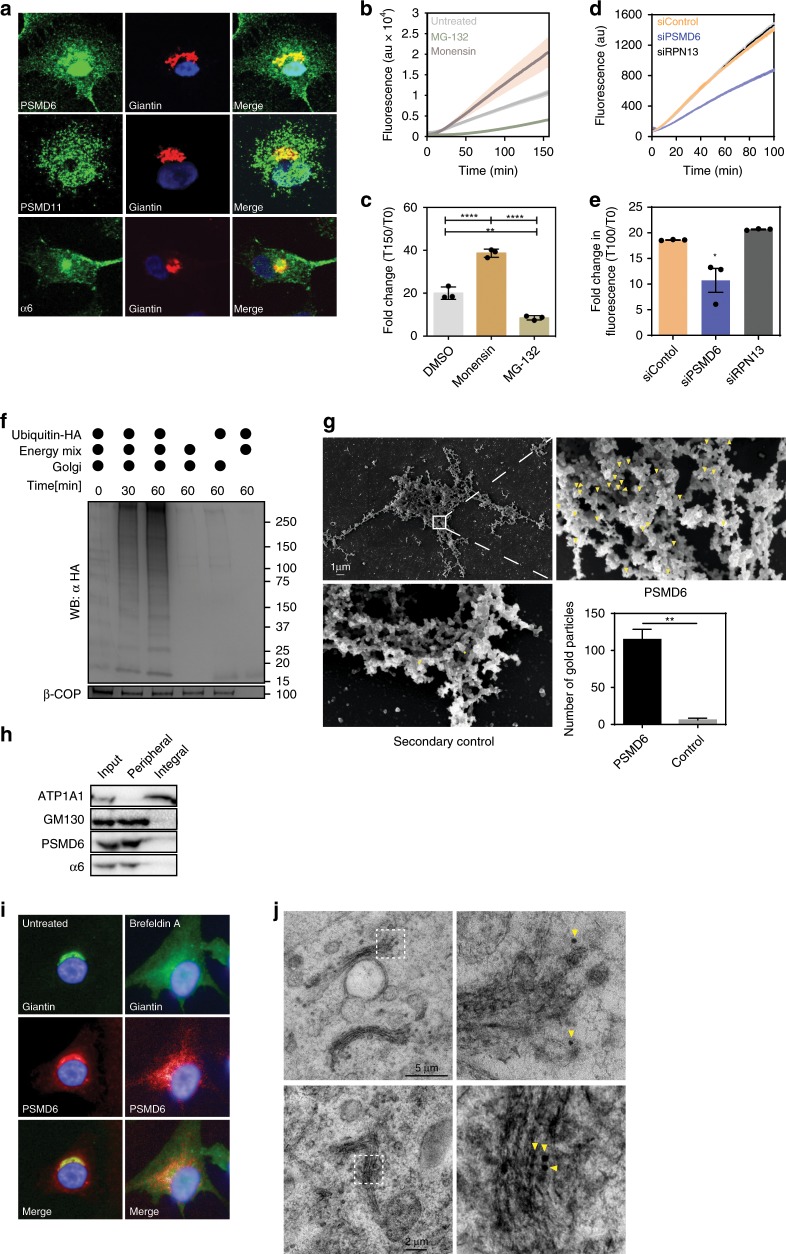
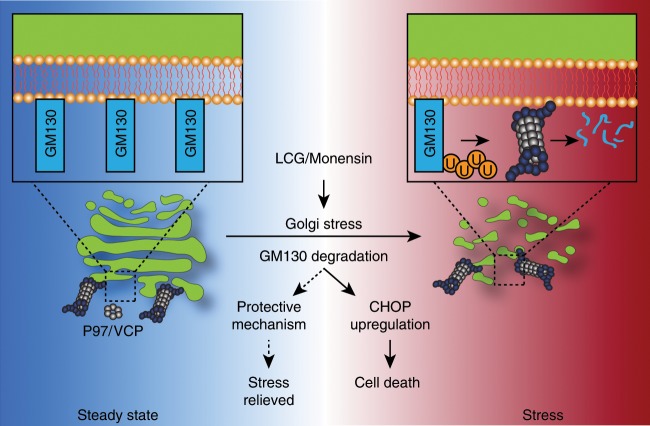
The Golgi is a dynamic organelle whose correct assembly is crucial for cellular homeostasis. Perturbations in Golgi structure are associated with numerous disorders from neurodegeneration to cancer. However, whether and how dispersal of the Golgi apparatus is actively regulated under stress, and the consequences of Golgi dispersal, remain unknown. Here we demonstrate that 26S proteasomes are associated with the cytosolic surface of Golgi membranes to facilitate Golgi Apparatus-Related Degradation (GARD) and degradation of GM130 in response to Golgi stress. The degradation of GM130 is dependent on p97/VCP and 26S proteasomes, and required for Golgi dispersal. Finally, we show that perturbation of Golgi homeostasis induces cell death of multiple myeloma in vitro and in vivo, offering a therapeutic strategy for this malignancy. Taken together, this work reveals a mechanism of Golgi-localized proteasomal degradation, providing a functional link between proteostasis control and Golgi architecture, which may be critical in various secretion-related pathologies.


Conflict of interest statement

The authors declare no competing interests.

Figures

Fig. 1
Fig. 1. Golgi stress induces proteasomal degradation of GM130.
a HeLa cells were treated with either cycloheximide (CHX 100 µg/ml, 8 h), CHX and MG-132 (20 µM, 8 h) or left untreated and analyzed by WB with the indicated antibodies. be HeLa cells expressing an inducible knockdown shRNA vector targeting PSMD6 were either treated with DOX to induce shRNA expression, or left untreated. b The expression levels of PSMD6, GM130, or K48-linked poly-ubiquitination were evaluated by WB analysis. Image is representative of three experiments. p(PSMD6) = 0.0001; p(K48) = 0.0011; p(GM130) = 0.0175. ce Band intensities relative to actin were quantified using ImageLab. n = 3 independent experiments. Error bars = SD. p(PSMD6) = 0.0065, p(K48) < 0.0001,p(GM130) = 0.0039 (t-test, log relative intensity). f, g A549 cells stably expressing an inducible shRNA for PSMD6 were transfected with siRNA targeting wither SLC35A1, CMAS, or non-targeting control and incubated in the presence of either DOX (to induce PSMD6 shRNA) or DMSO as control for 72 h. f Representative images of Giantin immunostaining in the different cells. Scale bar = 50 μM. g The relative Golgi size was determined based on Giantin staining. Each dot represents a single cell. Error bars = SD. n = 1000 cells; *p = 0.0123; ****p < 0.0001 (one way ANOVA with Sidak’s multiple comparisons test). h Cells treated as in F were analyzed by WB for GM130 expression. Source data are provided as a Source Data file.
Fig. 2
Fig. 2. The 26S proteasome is required for dispersal of the Golgi apparatus.
a A549 cells treated with LCG or EtOH for 8 h. n = 5900 cells in three independent experiments. GRASP65 (green); Giantin (red); Nuclei (blue). Scale bar = 20 μM (b, c) Golgi size (c) and roundness (d) of cells treated as in a were measured based on GRASP65 staining relative to EtOH, 2 h. n = 3 independent experiments, 6790 cells on average/condition. p = 0.0001 (Dunnet multiple comparisons test). Error bars = SEM. d A549 cells were treated with LCG (200 μM), monensin (2 μM), or control for 6 h and imaged by transmission electron microscopy. e, f HeLa cells expressing shRNA targeting either PSMD6 or luciferase (shLuc) were treated with LCG or EtOH. e Representative images. GM130 (green); Nuclei (blue). Scale bar = 20 μM. f The relative Golgi size compared to control was determined based on GM130 staining. FC: fold change. n = 1687 cells on average/condition. Error bars = SD. **p = 0.0082; ****p < 0.0001 (one way ANOVA with Sidak’s multiple comparison test). g RPMI-8226 cells were treated with cycloheximide (CHX 100 µg/ml) and either LCG (200 µM) or EtOH for the indicated times, and analyzed by WB with the indicated antibodies. Image is representative of three experiments. Provided also as a Source Data file. h HeLa cells were treated with either Monensin (2 µM) or LCG (200 µM) and stained for GM130. Left: representative cell images. The intensity of GM130 per cell was analyzed using Harmony software. n = 500 cells per condition. p < 0.0001 (one way ANOVA). i RPMI-8226 cells were treated with LCG (200 µM), LCG (200 µM) + MG132 (20 µM) or EtOH as control for 4 h, and analyzed by WB with the indicated antibodies. n = 3 experiments. j HeLa cells were fractionated on sucrose cushions and Golgi-enriched fractions were incubated for either 0 or 3 h at 37 °C and supplemented with MG-132 (20 µM) where indicated. Image is representative of three experiments. k Quantification of H. n = 3 independent experiments; Error bars = SD; ***p < 0.001, ****p < 0.0001 (one-way ANOVA with Holm-Sidak’s multiple comparison test). l HeLa cells expressing GalT-YFP were treated with LCG (200 µM) or EtOH for six hours, then washed three times with medium and imaged in 20 min intervals for 4 h.
Fig. 3
Fig. 3. 26S proteasomes are localized to the cytosolic surface of the Golgi apparatus.
a Confocal immunofluorescence images of the proteasome subunits PSMD6, PSMD11, and Alpha 6 (Green), the Golgi marker Giantin (red), and nuclei (blue) in A549 cells. Cells were permeabilized by digitonin prior to fixation. Images are representative of >30 cells. b, c Suc-LLVY-AMC proteasomal degradation assay of Golgi fractions from cells treated with monensin or MG-132 or untreated. Colored backgrounds represent SEM. c Quantification of the fold increase in AMC fluorescence at the final measurement (t = 150) from the initial time-point (t = 0) ± SEM. n = 3 independent experiments; p(untreated) = 0.002; p(monensin) = 0.01; p(MG-132) = 0.002 (one way ANOVA with Tukey’s multiple comparison test). d, e Suc-LLVY-AMC proteasomal degradation assay of Golgi-enriched fractions from cells in which the expression of either PSMD6, RPN13 or control were knocked down by specific siRNAs. Standard error shown as faded area around primary line. n = 3 biologically independent repeats. e Quantification of the fold increase in AMC fluorescence at the final measurement (t = 100) from the initial time-point (t = 0). n = 3 independent experiments. Error bars = SD. p(siControl) = 0.0004; p(siPSMD6) = 0.0001; p(siRPN13) = 4.13 × 10−5 (one way ANOVA with Tukey’s multiple comparisons test). f Purified Golgi fractions were supplemented with ATP and HA-ubiquitin (HA-ub) and incubated for 0, 30, and 60 min at 37 degrees. β-COP was used for normalization. Image is representative of three experiments. Source data are provided as a Source Data file. g Scanning electron microscopy images of Golgi-enriched fractions that were immuno-gold labeled with antibodies against either PSMD6 (inset) or primary antibody control (bottom). Arrowheads mark labeled spots. Images are representative of two independent experiments. Graph shows the quantification of gold particles in samples labeled with antibodies against either PSMD6 or control. n = 3 measurements from two independent experiments. Error bars = SD. p = 0.0015 (unpaired two-tailed t-test). h Golgi-enriched fractions were washed in alkali buffer to dissociate peripheral proteins. Images are representative of two experiments. i Immunofluorescence images of HeLa cells treated with Brefeldin A (where indicated). Giantin (Green); PSMD6 (red). Images are representative of >30 cells. j Immuno-gold labeling of PSMD6 after high pressure freezing. Insets = zoom in on gold particle labeling at the Golgi, marked by yellow arrowheads. Images are representative of two experiments.
Fig. 4
Fig. 4. Localized degradation of GM130 is mediated by p97/VCP and 26S proteasomes.
a Western blot analysis of various subcellular organelle markers following sucrose cushion fractionation (see Methods for details). Image is representative of >3 experiments. b Golgi-enriched fractions were supplemented with DBeQ (10 µM) where indicated and incubated for three hours at 37 °C. Top: Representative WB. Bottom: Quantification of three experiments. Source data are provided as a Source Data file. c, d A549 cells were treated with either LCG (200 μM), monensin (2 μM), or control, in the presence of either DBeQ (1 μM), CB-5083 (0.5 μM), or DMSO as control, for 6 hours. Cells were then fixed and stained with anti Giantin antibodies. c Representative cell images. Scale bar = 20 μM. d Golgi area was measured and calculated relative to control cells. n > 1000 cells. *p(DBeQ vs. DBeQ + mon) = 0.0121; *p(CB5083 vs. CB5083 + mon) = 0.0261; **p (DBeQ vs. control) = 0.0086; ****p < 0.0001 (one-way ANOVA with Sidak multiple comparisons test).
Fig. 5
Fig. 5. Golgi stress-induced death of Multiple myeloma cells is GM130-dependent.
a Western blot analysis of K48-linked polyubiquitin chains in Golgi-enriched fractions collected from RPMI-8226 cells either untreated or treated with monensin for 2 h. Images are representative of three experiments. b Live/dead cell count of the indicated cell lines following 48 h of monensin treatment (2 µM). n = 2 independent experiments. c Live/dead cell count of RPMI-8226 cells over three days of treatment with monensin (2 µM). n = 2 independent experiments. d The indicated cell lines were treated with either LCG (200 μM, left) or monensin (2 μM, right), for 6 h and stained for nuclei by Hoechst. Apoptotic cells were determined based on nuclear morphology and DNA condensation in Imaging Flow Cytometer ImageStreamX mark II (mm cell lines). n > 25,000 cells. eg The indicated cell lines were treated with either LCG (200 μM), monensin (2 μM) or control for 6 h and imaged by Imaging Flow Cytometer ImageStreamX mark II (Multiple myeloma cell lines) or fluorescent microscopy (adherent cell lines) for Golgi by Giantin staining and nuclei by Hoechst. e Shown are representative images of cells with intact or fragmented nuclei. f, g Golgi area of cells treated with monensin (f) or LCG (g) was measured and calculated relative to control cells. Error bars = SD. n(LCG) = 9668 cells. n(monensin) = 7183 cells. *p = 0.019; ****p < 0.0001 (Bonferroni multiple comparisons one way ANOVA test). i RPMI-8226 cells were either untreated or treated with LCG (200 µM) either with or without transfection to ectopically express GM130. Live cells were counted based on trypan blue exclusion in the indicated times after treatment. Error bars = SD. n = 2 independent experiments. p = 0.0223 (unpaired two tailed t-test, 16 h).
Fig. 6
Fig. 6. Golgi stress is toxic to Multiple myeloma cells in vivo.
a, b 5TGM1 cells were treated with monensin (2 µM, 6 h) and where indicated Bortezomib (40 nM) was added for the last 2 h of incubation. Cells were imaged by the Imaging Flow Cytometer ImageStreamX mark II using anti-GRASP65 antibodies, anti K48-TUBE and Hoechst. K48 intensity was calculated per the Golgi area based on GRASP65 localization. A representative image is shown in b. n = 11,872 cells. Error bars = SD. p < 0.0001 (one-way ANOVA with Tukey’s multiple comparisons test). c, d 5TGM1 cells were treated with either LCG (200 μM), monensin (2 μM), or control for 6 h and imaged by Imaging Flow Cytometer ImageStreamX mark II for Golgi using GRASP65 antibodies and nuclei by Hoechst. Golgi area was measured in cells treated with either monensin (c) or LCG (d) and calculated relative to control cells. Error bars = SD. n = 3076 cells. p < 0.0001(Bonferroni multiple comparisons one way ANOVA test). e 5TGM1 cells were treated with either LCG (200 μM), monensin (2 μM), or control for 6 h and CHOP mRNA levels were determined by qPCR. n = 3 independent biological repeats. Error bars = SD. p(monensin) = 0.0098; p(LCG) = 0.0009 (two tailed t-test). f Schematic outline of the 5TGM1 mm mouse model experiment. g Blood IgG2β levels were measured by ELISA from mice injected with mm5TGM1 cells over a period of 32 days. Test mice were split into two groups, A1 (control) and A2 (monensin treated) and labeled individually as A1.1–4 and A2.1–4. Individual mice A1.2 and A2.4 died before treatment could begin. h FACS analysis and quantification of mm (CD138+) and normal B cells (CD19+) in bone marrow of control vs. monensin-treated mice. n = 12 mice. Error bars = SEM. p(mm untreated vs. monensin) = 0.008. (One-way ANOVA with Tukey’s multiple comparison test) i FACS analysis and quantification of mm cells and normal B cells (BC) in spleens of control vs. monensin-treated mice. n = 12 mice. p(mm untreated vs. monensin) = 0.001 (one way ANOVA with Tukey’s multiple comparison test). j Spleen images and quantification of sizes. n = 12 mice. Error bars = SEM. ns: non-significant. *p < 0.05; ****p < 0.0001 (One-way ANOVA with Tukey’s multiple comparison test).
Fig. 7
Fig. 7. Golgi organization is regulated by proteasomal degradation.
Proteasomes are constitutively associated with the Golgi membranes and mediate the degradation of the Golgi tethering protein GM130. Golgi-apparatus related degradation (GARD) is activated in response to Golgi-stress, such as block of sialylation by LCG, and induces enhanced degradation of GM130, leading to dispersal of the Golgi apparatus, upregulation of CHOP, and cell death. Accurate morphology of the Golgi may be retained upon relief of the stress (dotted line), suggesting that proteasome-dependent control of Golgi organization might serve as a cell-fate dictating mechanism during the stress-response.

References

    1. Lowe M. Structural organization of the Golgi apparatus. Curr. Opin. Cell Biol. 2011;23:85–93. doi: 10.1016/j.ceb.2010.10.004. - DOI - PubMed
    1. Colanzi A, Suetterlin C, Malhotra V. Cell-cycle-specific Golgi fragmentation: how and why? Curr. Opin. Cell Biol. 2003;15:462–467. doi: 10.1016/S0955-0674(03)00067-X. - DOI - PubMed
    1. Yadav S, Puri S, Linstedt AD. A primary role for Golgi positioning in directed secretion, cell polarity, and wound healing. Mol. Biol. Cell. 2009;20:1728–1736. doi: 10.1091/mbc.e08-10-1077. - DOI - PMC - PubMed
    1. Wilson C, et al. The Golgi apparatus: an organelle with multiple complex functions. Biochem. J. 2011;433:1–9. doi: 10.1042/BJ20101058. - DOI - PubMed
    1. Xiang Y, et al. Regulation of protein glycosylation and sorting by the Golgi matrix proteins GRASP55/65. Nat. Commun. 2013;4:1659. doi: 10.1038/ncomms2669. - DOI - PMC - PubMed

Publication types

MeSH terms