. 2020 Jan 21;10(1):798.
doi: 10.1038/s41598-020-57602-w.

Investigating Chaperonin-Containing TCP-1 subunit 2 as an essential component of the chaperonin complex for tumorigenesis

Affiliations

Investigating Chaperonin-Containing TCP-1 subunit 2 as an essential component of the chaperonin complex for tumorigenesis

Anne E Showalter et al. Sci Rep. .

Abstract

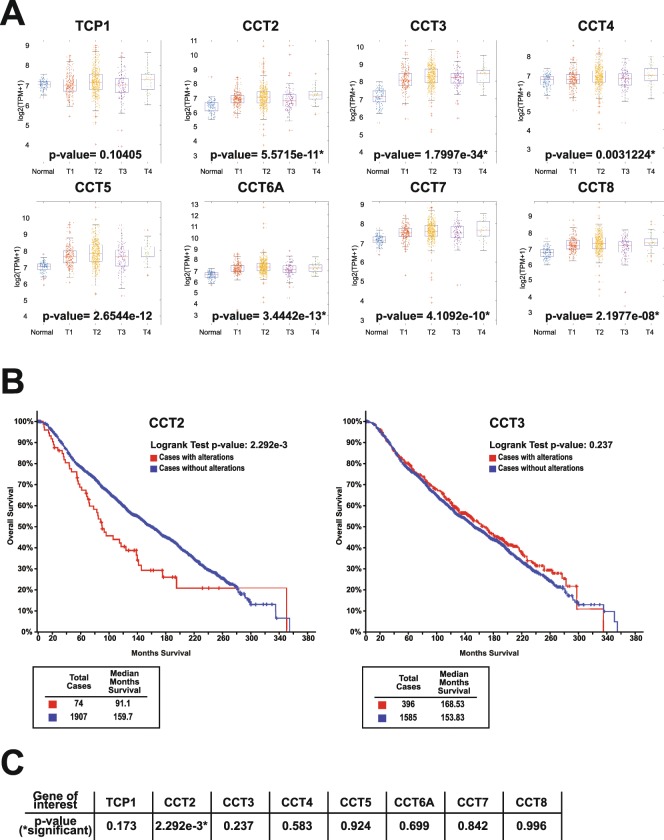
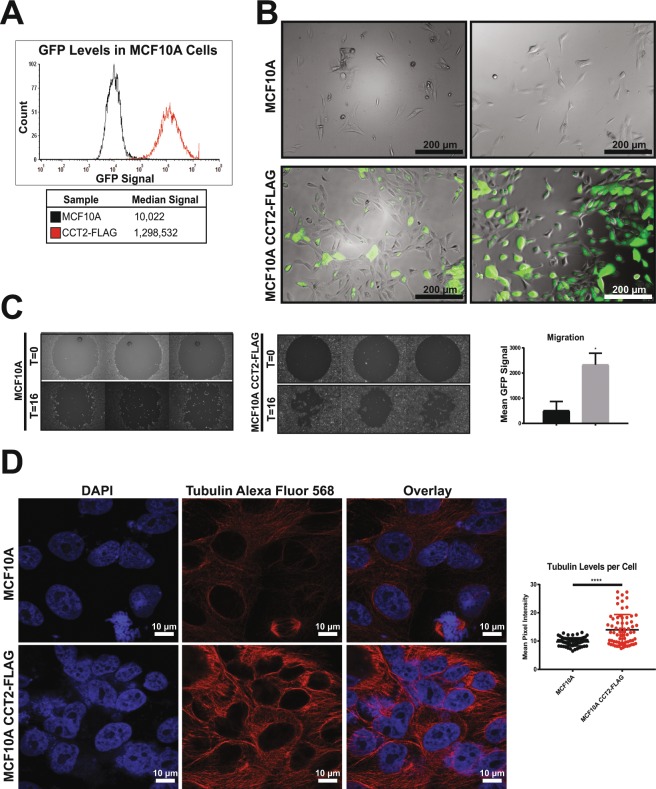
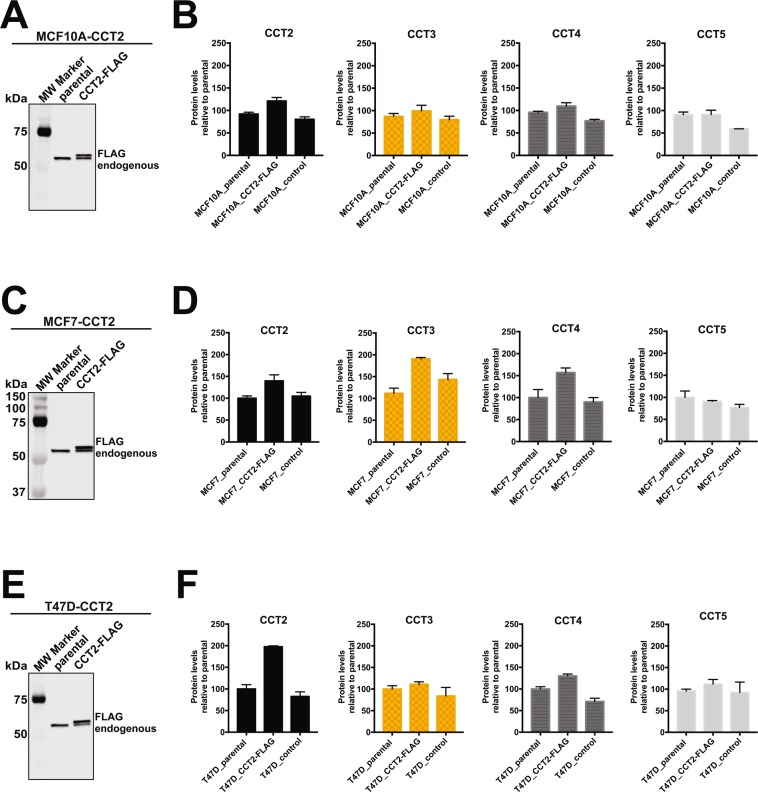
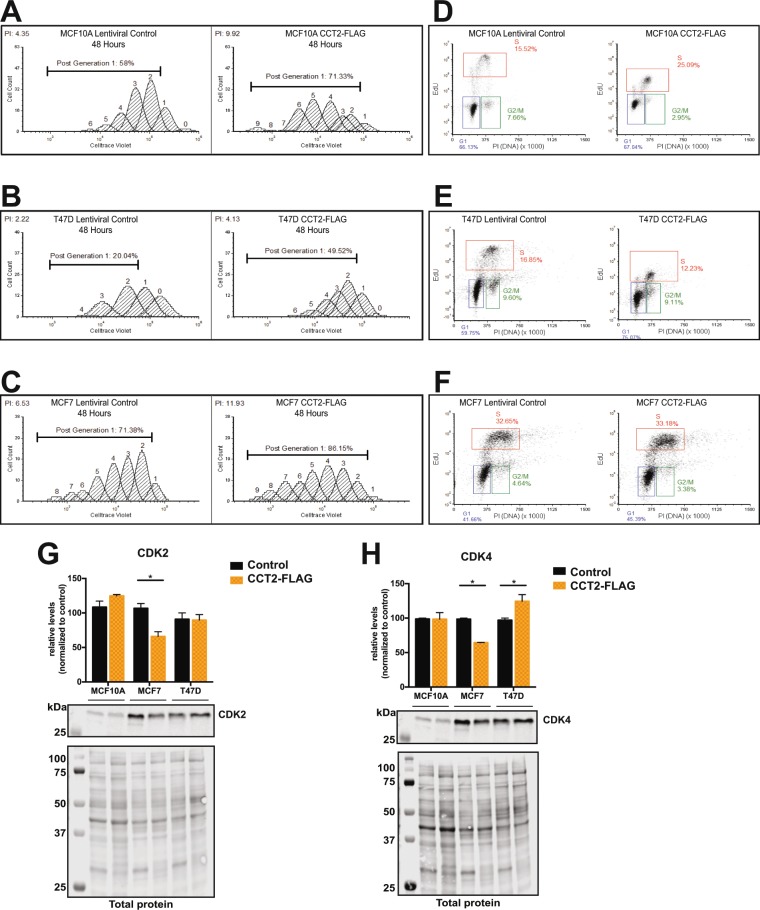
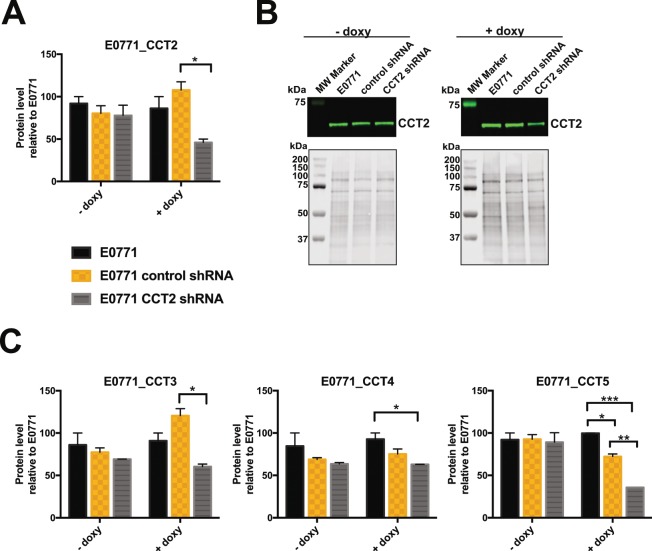
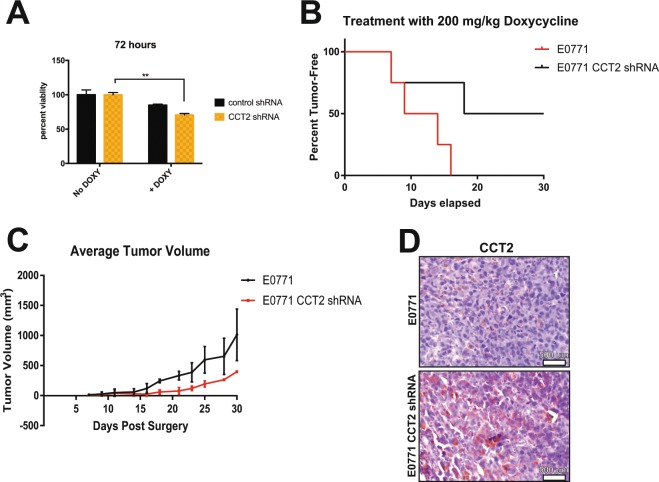
Chaperonin-containing TCP-1 (CCT or TRiC) is a multi-subunit complex that folds many of the proteins essential for cancer development. CCT is expressed in diverse cancers and could be an ideal therapeutic target if not for the fact that the complex is encoded by eight distinct genes, complicating the development of inhibitors. Few definitive studies addressed the role of specific subunits in promoting the chaperonin's function in cancer. To this end, we investigated the activity of CCT2 (CCTβ) by overexpressing or depleting the subunit in breast epithelial and breast cancer cells. We found that increasing total CCT2 in cells by 1.3-1.8-fold using a lentiviral system, also caused CCT3, CCT4, and CCT5 levels to increase. Likewise, silencing cct2 gene expression by ~50% caused other CCT subunits to decrease. Cells expressing CCT2 were more invasive and had a higher proliferative index. CCT2 depletion in a syngeneic murine model of triple negative breast cancer (TNBC) prevented tumor growth. These results indicate that the CCT2 subunit is integral to the activity of the chaperonin and is needed for tumorigenesis. Hence CCT2 could be a viable target for therapeutic development in breast and other cancers.


Conflict of interest statement

A.R.K. is shareholder in Seva Therapeutics, Inc. The other authors have no competing interests.

Figures

Figure 1
Figure 1
Expression levels of CCT subunits increase with breast cancer stage, while CCT2 levels inversely correlate with patient survival. Expression levels of all eight CCT subunits were analyzed according to stage and survival in breast cancer patients. (A) Plots are shown comparing expression levels of all eight CCT subunits in normal (n = 116) and breast cancer tissues (n = 1110) across stage as indicated by T1-T4. The p-value shown in the box was calculated based on determining the Pearson Correlation Coefficients between the CCT expression level and cancer stage. Source was the Xena Public Data Hubs. (B) Kaplan-Meier plots comparing survival in patients with and without alterations in CCT2 and CCT3 genes. (C) Table showing the p-values comparing patient survival with genomic alterations of all CCT subunits. Source was the TCGA database using the cBioPortal for cancer genomics,.
Figure 2
Figure 2
Expression of CCT2-FLAG causes phenotypic changes in MCF10A cells. MCF10A cells expressing CCT2-FLAG show (A) expression of plasmid-driven GFP measured by flow cytometry and (B) changes in morphology (100X). (C) Migration of MCF10A and MCF10A CCT2-FLAG cells was measured after 16 hours (T = 16) using the Oris Migration assay as described in Materials and Methods by detection of cells loaded with CFSE in the zone cleared by the plug. Start of the experiment (T = 0) is shown for comparison. Significance was determined using paired student’s T test with p-value = 0.0144. (D) MCF10A and MCF10A CCT2-FLAG cells were stained with DAPI (nucleus) and tubulin (Alexa Fluor 568) and assessed by confocal microscopy using Zeiss LSM 710 confocal microscope (100X). Tubulin levels were quantified per cell based on the mean pixel intensity. Significance was determined using paired student’s T test with p-value < 0.0001. Data shown is representative of three experiments.
Figure 3
Figure 3
Expression of CCT2-FLAG leads to increased levels of other CCT subunits. Relative protein levels of CCT2, CCT3, CCT4 and CCT5 were determined by immunoblot analysis in cells stably expressing CCT2-FLAG. (A,C,E) Immunoblot of MCF10A (A), MCF7 (C) and T47D (E) to determine CCT2 levels in Parental (untransfected) and CCT2-FLAG cells. Note that CCT2-FLAG band runs at a slightly higher molecular weight than endogenous CCT2, confirming the presence of FLAG-tagged protein. The fold increase of total CCT2 levels (compared to Parental) in MCF10-CCT2, MCF7-CCT2 and T47D-CCT2 were 1.3, 1.5 and 1.8 respectively. Total CCT2 = endogenous + CCT2-FLAG. Cropped blots for CCT2 is shown; refer to Supplemental Fig. S3 for full blot and total protein images (used for signal normalization). (B,D,F) Relative protein levels between Parental, CCT2-FLAG and Control (GFP vector only) of CCT2, CCT3, CCT4 and CCT5 calculated from immunoblot analyses. The bar graphs represent protein levels relative to Parental cells. Signal was normalized to total protein as previously described and in Materials and Methods. Error bars represent the mean with s.e.m of technical replicates. Representative data of at least three independent experiments is shown. Refer to Supplemental Fig. S3 for full blot images.
Figure 4
Figure 4
Expression of CCT2-FLAG promotes cell proliferation. MCF10A, T47D, and MCF-7, Lentiviral Control (Control) and CCT2-FLAG cells were analyzed for proliferation by flow cytometry and immunoblot. (AC) Proliferation was assessed using Celltrace Violet Fluor® for 48 hours by flow cytometry (Cytoflex). Generation time and Proliferation Index (upper left) was calculated with FCS Express 6 software. The percent of original cells post-generation 1 is shown. Representative data of three experiments is shown. (DF) Cell cycle phase was determined using Clickit EdU Alexa 647 and propidium iodide staining and analyzed by flow cytometry (Cytoflex) using FCS Express 6 software. Representative data of three experiments is shown. (G,H) Analyses of immunoblots is shown comparing CDK2 and CDK4 levels between control cells (black bars) and CCT2-FLAG (yellow bars) cells. The bar graphs represent protein levels relative to the control cells in each dataset. Signal was normalized to total protein as previously described and in Methods. (G) CDK2 level was significantly decreased in MCF7-CCT2 compared to MCF7-Control cells (*p = 0.0220). (H) CDK4 level was significantly decreased in MCF7-CCT2 compared to MCF7-Control cells (*p = 0.0161) and significantly higher in T47D-CCT2 (*p = 0.0426). Error bars represent the mean with s.e.m. Two-way ANOVA (Sidak’s multiple comparison test) was used to calculate significance between control and CCT2-FLAG signal. Blots were performed once with technical replicates for each lysate. Cropped blot for CDKs is shown. Refer to Supplemental Fig. S4C,D for full blot images.
Figure 5
Figure 5
CCT2 depletion leads to the decreased levels of other CCT subunits. Using a doxycycline inducible lentiviral system to express CCT2 shRNA, CCT2 was knocked down in E0771 cells and relative levels of CCT2, CCT3, CCT4, and CCT5 in E0771, E0771 control shRNA, and E0771 CCT2 shRNA cells treated with (+doxy) or without (−doxy) 0.5 μg/ml doxycycline were determined by immunoblotting. (A) CCT2 levels decreased significantly (p = 0.0140) upon expression of CCT2 shRNA when compared to control shRNA in the doxy group. (B) Images of representative blots used for the analysis of CCT2 levels shown in A. Note the decrease in CCT2 signal in E0771-CCT2shRNA in the presence of doxy while CCT2 signal remains constant in the no doxy group. Total protein image corresponding to the blot above shows equal load between the lanes. Images were cropped to show CCT2 band only. Refer to Supplemental Fig. S7A,B for full blot images. (C) Relative levels of CCT3, CCT4, and CCT5 in E0771, E0771 control shRNA and E0771 CCT2 shRNA were also assessed from immunoblot data shown in Supplemental Fig. 7A–D. Two-way ANOVA analysis performed using Tukey’s multiple comparison test between -doxy and +doxy groups (p < 0.05). In + doxy group CCT3 *p = 0.0261. In +doxy group CCT4 *p = 0.0241, CCT5 *p = 0.0290 **p = 0.0078, ***p = 0.0004. Error bars represent the mean with s.e.m of technical replicates. Representative data of three independent experiments is shown.
Figure 6
Figure 6
CCT2 depletion kills TNBC cells and inhibits tumor growth in syngeneic model of TNBC. (A) Viability of E0771 cells expressing control or CCT2 shRNA treated with or without 0.5 μg/ml doxycycline (doxy) was determined 96hrs after treatment using Live/Dead assay as described in Materials and Methods. Silencing cct2 in vitro decreased viability by ~25% in E0771 cells compared to control shRNA. B-C) E0771 and E0771 cells expressing the inducible CCT2 shRNA were orthotopically implanted in C57BL/6 mice (n = 4). Four days post-tumor implantation, mice were fed 200 mg/kg doxycycline chow. Tumor appearance (p-value = 0.0786 for survival curve) (B) and volume (C) were assessed by caliper measurements as described in Materials and Methods for 4 weeks. Data shown is representative of two experiments, each with n = 4 mice per group. (D) CCT2 protein levels in tumors from mice at experimental endpoints were assessed by immunohistochemistry (IHC). Representative data is shown.

References

    1. Hanahan D. & Robert. Hallmarks of Cancer: The Next Generation. Cell. 2011;144:646–674. doi: 10.1016/j.cell.2011.02.013. - DOI - PubMed
    1. Hanahan D, Weinberg RA. The hallmarks of cancer. Cell. 2000;100:57–70. doi: 10.1016/S0092-8674(00)81683-9. - DOI - PubMed
    1. Solimini NL, Luo J, Elledge SJ. Non-oncogene addiction and the stress phenotype of cancer cells. Cell. 2007;130:986–988. doi: 10.1016/j.cell.2007.09.007. - DOI - PubMed
    1. Liu Y, Ye Y. Proteostasis regulation at the endoplasmic reticulum: a new perturbation site for targeted cancer therapy. Cell Res. 2011;21:867–883. doi: 10.1038/cr.2011.75. - DOI - PMC - PubMed
    1. Klaips CL, Jayaraj GG, Hartl FU. Pathways of cellular proteostasis in aging and disease. J. Cell Biol. 2018;217:51–63. doi: 10.1083/jcb.201709072. - DOI - PMC - PubMed

Publication types

Substances