. 2020 Jan 21;3(1):34.
doi: 10.1038/s42003-020-0759-x.

Mice adaptively generate choice variability in a deterministic task

Affiliations

Mice adaptively generate choice variability in a deterministic task

Marwen Belkaid et al. Commun Biol. .

Erratum in

Abstract

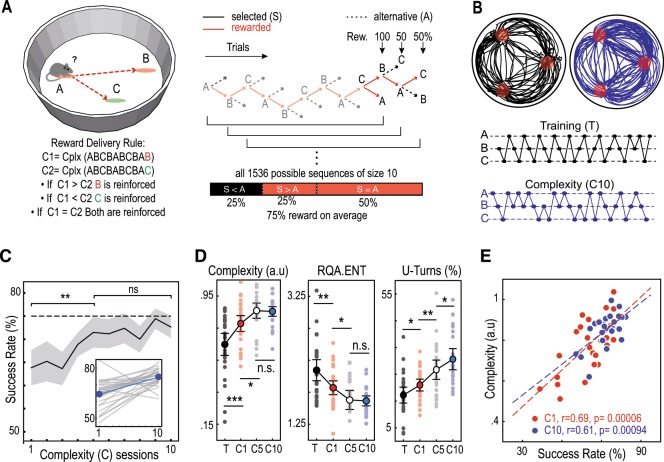
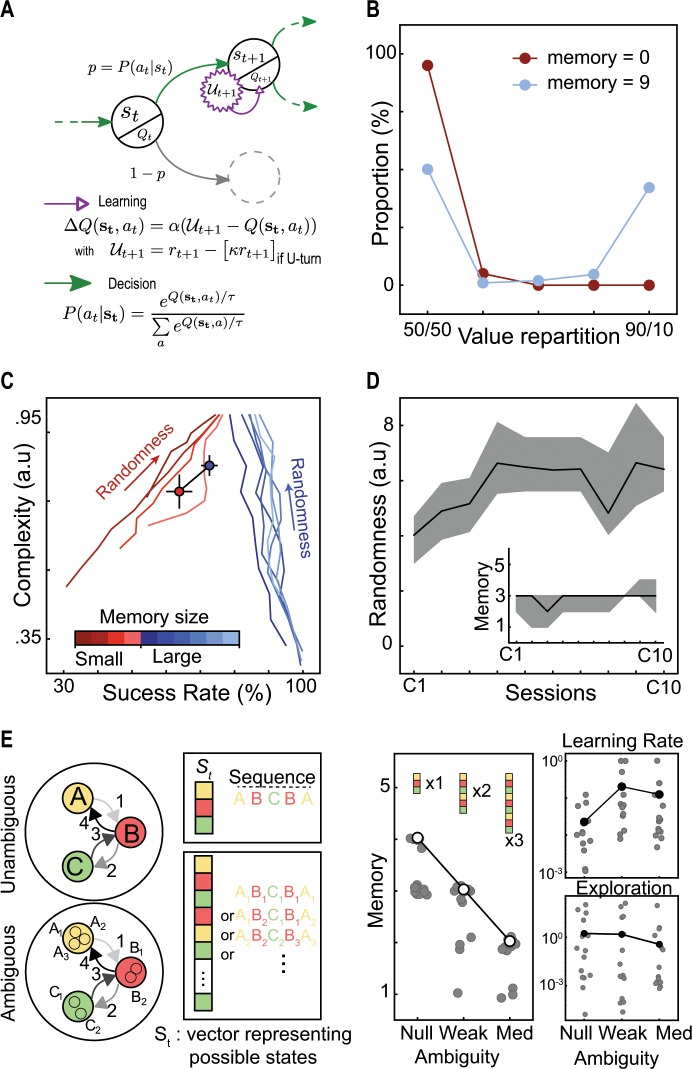
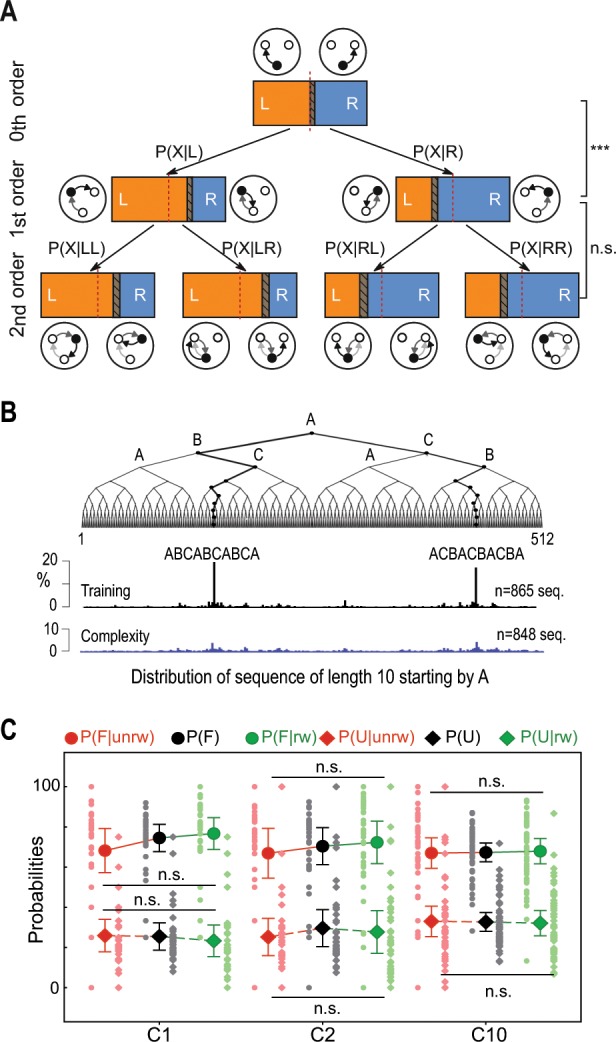
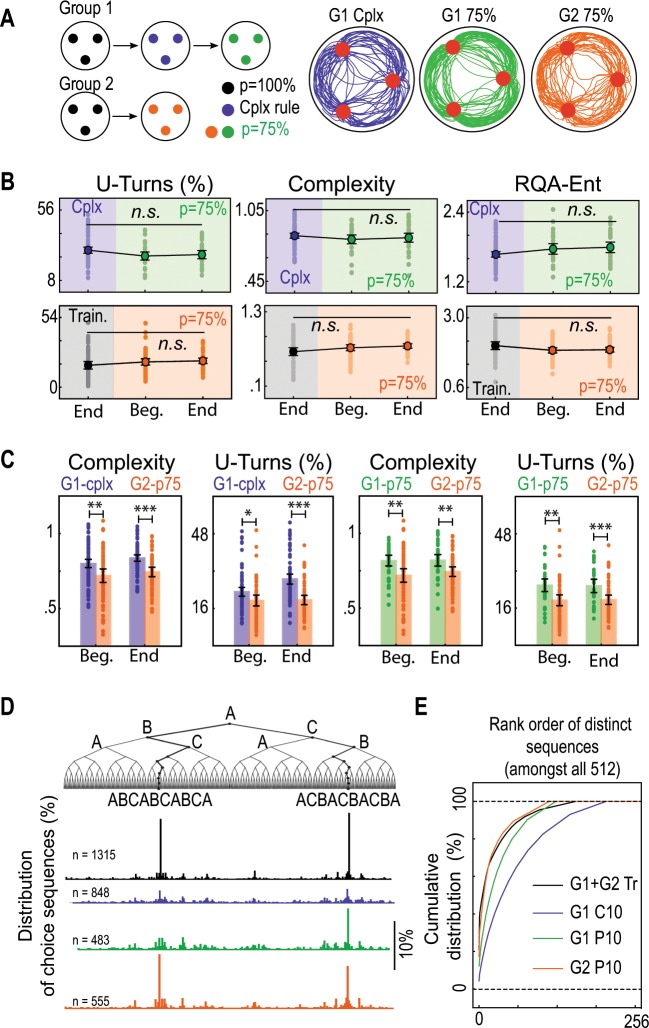
Can decisions be made solely by chance? Can variability be intrinsic to the decision-maker or is it inherited from environmental conditions? To investigate these questions, we designed a deterministic setting in which mice are rewarded for non-repetitive choice sequences, and modeled the experiment using reinforcement learning. We found that mice progressively increased their choice variability. Although an optimal strategy based on sequences learning was theoretically possible and would be more rewarding, animals used a pseudo-random selection which ensures high success rate. This was not the case if the animal is exposed to a uniform probabilistic reward delivery. We also show that mice were blind to changes in the temporal structure of reward delivery once they learned to choose at random. Overall, our results demonstrate that a decision-making process can self-generate variability and randomness, even when the rules governing reward delivery are neither stochastic nor volatile.


Conflict of interest statement

The authors declare no competing interests.

Figures

Fig. 1
Fig. 1. Mice generate unpredictable decisions.
a Left: task setting and complexity algorithm for reward delivery (see text) Right: tree structure of the task and reward distribution. b Typical trajectories in training (T) and complexity (C) conditions. c Increase of the success rate over sessions in the complexity setting. Mice improved their performance in the first sessions (c01 versus c05, T = 223.5, p = 0.015, Wilcoxon test) then reached a plateau (c05 versus c10, t(25) = −0.43, p = 0.670, paired t-test) close to the theoretical 75% success rate of random selection (c10, t(25) = −1.87, p = 0.073, single sample t-test). The shaded area represents a 95% confidence interval. Inset, linear regressions of individual mice performance increase for individual mice (gray line) and average progress (blue line). d Increase of the behavior complexity over sessions: the NLZcomp measure of complexity increased in the beginning (training versus c01, T = 52, p = 0.0009, Wilcoxon test, c01 versus c05, t(26) = −2.67, p = 0.012, paired t-test) before reaching a plateau (c05 versus c10, T = 171, p = 0.909, Wilcoxon test). The average complexity reached by animal is lower than 1 (c10, t(25) = −9.34, p = 10–9, single sample t-test), which corresponds to the complexity of random sequences. The RQA ENT entropy-based measure of complexity decreased over sessions (training versus c01, t(26) = 2.81, p = 0.009, paired t-test, c01 versus c05, T = 92, p = 0.019, Wilcoxon test, c05 versus c10, T = 116, p = 0.13, Wilcoxon test). The rate of U-turns increased over sessions (training versus c01, t(26) = −2.21, p = 0.036, c01 versus c05, t(26) = −3.07, p = 0.004, paired t-test, c05 versus c10, T = 75, p = 0.010, Wilcoxon test). Error bars represent 95% confidence intervals. e Correlation between individual success rate and complexity of mice sequences. Also noteworthy is the decrease in data dispersion in session c10 compared to c1. N = 27 in all sessions except c10 where N = 26.
Fig. 2
Fig. 2. Computational modeling suggests a memory-free pseudo-random selection behind mice choice variability.
a Schematic illustration of the computational model fitted to mouse behavior. b Repartition of the values learned by the model with memory size equal to 0 or 9. c Influence of increased randomness on success rate and complexity for various memory sizes. Each line describes the trajectory followed by a model with a certain memory size (see color scale) when going from a low to high level of randomness (defined as τ/κ). Red and blue dots represent experimental data of mice in the last training and complexity sessions, respectively. d Model fitting results. With an increase of randomness and a small memory, the model fits the increase in mice performance. The shaded areas represent values of the 15 best parameter sets. Dark lines represent the average randomness value (continuous values) and the best fitting memory size (discrete values), respectively. e Schematic of ambiguous state representations and simulation results. The main simulations rely on an unambiguous representation of states in which each choice sequence is represented by one perfectly recognized code. With ambiguous states, the same sequence can be encoded by various representations. In the latter case, the model best fits mouse performance with a smaller memory (null, weak and medium ambiguity, H = 27.21, p = 10–6, Kruskal–Wallis test, null versus weak, U = 136, p = 0.006, weak versus med, U = 139, p = 0.002, Mann–Whitney test) and with a higher learning rate (null, weak, and medium ambiguity, H = 7.61, p = 0.022, Kruskal–Wallis test, null versus weak, U = 45.5, p = 0.016, null versus med, U = 54, p = 0.026, weak versus med, U = 101, p = 0.63, Mann–Whitney test) but a similar exploration rate (null, weak and medium ambiguity, H = 3.64, p = 0.267, Kruskal–Wallis test). Gray dots represent the 15 best fitting parameter sets. White dots represent the best fit in case of a discrete variable (memory) while black dots represent the average in case of continuous variables (temperature and learning rate). N = 15.
Fig. 3
Fig. 3. Behavioral evidence of the absence of memorization in mouse choices.
a Tree representation of the Markovian structure of mouse behavior in session c10 (N = 26). In the expression of probabilities, P(X) refers to P(L) (L Left) or P(R) (R right), whose repartition is illustrated in the horizontal bars (respectively in orange and blue). Dashed areas inside the bars represent overlapping 95% confidence intervals. The probability of a transition (i.e. to the left or to the right) is different from the probability of the same transition given the previous one (p < 0.05, paired t-test, see “Methods” for detailed analysis). However, the probability given two previous transitions is not different from the latter (p > 0.05, paired t-test, see “Methods” for detailed analysis). b Distribution of subsequences of length 10. c Absence of influence of rewards on mice decisions. P(F) and P(U) respectively refer to the probabilities of going forward (e.g. A → B → C) and making a U-turn (e.g. A → B → A). These probabilities were not different from the conditional probabilities given that the previous choice was rewarded or not (p > 0.05, Kruskal–Wallis test, see “Methods” for detailed analysis). This means that the change in mice behavior under the complexity condition was not stereotypically driven by the outcome of their choices (e.g. “u-turn if not rewarded”). Error bars in B represent 95% confidence intervals. N = 34 in c01, N = 38 in c02, and N = 52 in c10.
Fig. 4
Fig. 4. Comparison of mice behavior under the complexity condition and a probabilistic condition.
a Experimental setup and typical trajectories under the two conditions. For a first group of mice (G1), the complexity condition was followed by a probabilistic condition. For a second group (G2), the probabilistic condition was experienced right after training. Under the probabilistic condition all targets were rewarded with a 75% probability. b G1 and G2 mice behavior in the probabilistic setting compared to the end of the preceding condition (resp. complexity and training). The U-turn rate, NLZcomp complexity, and RQA ENT measure remain unchanged for G1 (pooled “end vc”, “beg. p75” and “end p75”, U-turn rate, H = 4.22, p = 0.120, Complexity, H = 0.90, p = 0.637, RQA ENT, H = 4.57, p = 0.101, Kruskal–Wallis test) and for G2 (pooled “end tr”, “beg. p75”, and “end p75”, U-turn rate, H = 5.68, p = 0.058, Complexity, H = 4.10, p = 0.128, RQA ENT, H = 2.66, p = 0.073, Kruskal–Wallis test). c Comparison of G2 behavior in the probabilistic setting with G1 behavior under the complexity and the probabilistic conditions. G1 mice exhibit higher sequence complexity and U-turn rate than G2 under both the complexity condition (G1-cplx versus G2-p75, Complexity, pooled “beg”, t(136) = 2.99, p = 0.003, pooled “end”, t(136) = 4.72, p = 7.10−6, Welch t-test, U-turn, pooled “beg”, U = 2866.5, p = 0.015, pooled “end”, U = 3493, p = 10−7, Mann–Whitney test) and the probabilistic condition (G1-p75 versus G2-p75, Complexity, pooled “beg”, U = 1375, p = 0.005, Mann–Whitney test, pooled “end”, t(91) = 2.92, p = 0.004, t-test, U-turn, pooled “beg”, U = 1478, p = 0.0003, pooled “end”, U = 1424, p = 0.001, Mann–Whitney test). N = 80 for G1-cplx, N = 36 for G1-p75, N = 54 for G2-p75. d Distribution of subsequences of length 10 performed by G1 and G2 animals in the last sessions of the training, the complexity (same as in Fig. 3b), and the probabilistic conditions. e Cumulative distribution of ranked patterns of length 10.

References

    1. Wu HG, Miyamoto YR, Gonzalez Castro LN, Ölveczky BP, Smith MA. Temporal structure of motor variability is dynamically regulated and predicts motor learning ability. Nat. Neurosci. 2014;17:312–321. doi: 10.1038/nn.3616. - DOI - PMC - PubMed
    1. Aronov D, Andalman AS, Fee MS. A specialized forebrain circuit for vocal babbling in the juvenile songbird. Science. 2008;320:630–634. doi: 10.1126/science.1155140. - DOI - PubMed
    1. Driver, P. M. & Humphries, D. A. Protean behaviour. (Oxford University Press, USA, 1988).
    1. Rapoport A, Budescu DV. Generation of random series in two-person strictly competitive games. J. Exp. Psychol. Gen. 1992;121:352–363. doi: 10.1037/0096-3445.121.3.352. - DOI
    1. Sutton, R. S. & Barto, A. G. Reinforcement Learning. (MIT Press, 1998).

Publication types