. 2020 Jan 14;4(1):016102.
doi: 10.1063/1.5127302. eCollection 2020 Mar.

Site-directed targeting of transcriptional activation-associated proteins to repressed chromatin restores CRISPR activity

Affiliations

Site-directed targeting of transcriptional activation-associated proteins to repressed chromatin restores CRISPR activity

René Daer et al. APL Bioeng. .

Abstract

Previously, we used an inducible, transgenic polycomb chromatin system to demonstrate that closed, transcriptionally silenced chromatin reduces Cas9 editing. Here, we investigated strategies to enhance Cas9 editing efficiency by artificially perturbing closed chromatin. We tested UNC1999, a small molecule inhibitor that blocks enhancer of zeste homolog 2, an enzyme that maintains closed polycomb chromatin. We also tested DNA-binding, transiently expressed activation-associated proteins (AAPs) that are known to support an open, transcriptionally active chromatin state. When cells that carried a polycomb-repressed transgene (luciferase) were treated with UNC1999 or the AAP fusion Gal4P65, we observed loss of histone 3 lysine 27 trimethylation (H3K27me3), a silencing-associated chromatin feature, at the transgene. Only Gal4P65 treatment showed full restoration of luciferase expression. Cas9 activity, determined by insertion deletion mutations, was restored in Gal4P65-expressing cells, while no CRISPR enhancement was observed with UNC1999 treatment. CRISPR activity was also restored by other Gal4-AAP fusions that did not activate luciferase expression. Our results demonstrate the use of DNA-binding, activator-associated fusion proteins as an effective method to enhance Cas9 editing within polycomb-repressed chromatin.


Figures

FIG. 1.
FIG. 1.
Research of Cas9 activity in chromatin suggests that facultative heterochromatin inhibits Cas9 editing, while open chromatin is permissive to Cas9. (a) PRC2 (polycomb repressive complex 2) generates the silencing mark histone 3 lysine 27 trimethylation (H3K27me3) (purple M). PRC2 includes suppressor of Zeste 12 (SUZ12), embryonic ectoderm development (EED), retinoblastoma-binding protein (RbAp), and enhancer of zeste 2 (EZH2). Polycomb repressive complex 1 (PRC1) includes chromobox protein homolog (CBX), ring finger protein 1b (RING1B), and polycomb group RING finger protein 4 (BMI1). Polycomb proteins support histone compaction and block access of DNA to RNA polymerase and Cas9. Chromatin remodelers, histone acetyltransferases (HATs), and histone methyltransferases (HMTs) generate modifications that support open chromatin, accessible DNA, and a transcriptionally permissive state. (b) Inhibitors of chromatin-modifying enzymes, such as UNC1999 that blocks EZH2, disrupt closed chromatin in a global, nonspecific manner. (c) Synthetic fusion proteins containing a DNA binding domain (DBD) and activation-associated protein (AAP) can be used to recruit open-chromatin-associated proteins to a specific locus.
FIG. 2.
FIG. 2.
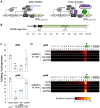
H3K27me3 and gene expression levels at the ectopic PRC-silenced Tk-luciferase reporter after treatment with EZH2 inhibitor UNC1999 or Gal4P65. (a) Open chromatin is characterized by expression of Tk-luciferase and absence of the silencing mark histone 3 lysine 27 trimethylation (H3K27me3). Closed chromatin is induced upon addition of doxycycline (dox) and is characterized by reduced expression of Tk-luciferase and accumulation of H3K27me3. (b) Chromatin immunoprecipitation followed by quantitative PCR (ChIP-qPCR) was used to determine H3K27me3 levels at Tk-luciferase after treatment with UNC1999 or expression of Gal4P65 compared to the inhibitor vehicle control DMSO. A constitutively active housekeeping gene, TATA-binding protein (TBP), was used as a negative control for H3K27me3 enrichment. Dots represent replicate IPs from a single chromatin prep, each normalized by the mean ChIP enrichment value for closed chromatin (Gal4EED/luc +dox DMSO luc qPCR). (c) Expression of Tk-luciferase was determined by luciferase activity assays. Dots, 3 independent treatments normalized by the average value for closed chromatin (Gal4EED/luc +dox DMSO). In (b) and (c): wide bars, mean values; error bars, standard deviation, *p <0.01.
FIG. 3.
FIG. 3.
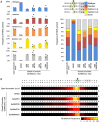
Effects of UNC1999 and Gal4P65 on Cas9-mediated editing in closed chromatin, determined by insertion-deletion mutations (INDELs) at Tk-luciferase. (a) Overview of the transgene states that were tested for CRISPR accessibility. Treatment of Gal4EED/luc +dox cells with UNC1999 inhibits enhancer of zeste 2 (EZH2), resulting in the loss of H3K27me3 [Fig. 2(b)]. Expression of Gal4P65 results in the loss of H3K27me3 and increased Tk-luciferase expression [Fig. 2(b)]. (b) Scaled map of the Tk-luciferase transgene and the gRNA target sites. (c) Charts show Cas9 editing efficiencies at each target site. Editing efficiencies were measured 3 days after transfection with Cas9/sgRNA plasmids. Dots, biological replicates; wide bars, mean values; error bars, standard deviation, *p <0.01. (d) Heat maps indicate the frequency at which each DNA base position was affected by an insertion or deletion (INDEL).
FIG. 4.
FIG. 4.
CRISPR activity is enhanced by Gal4 fusions that do not activate Tk-luciferase expression. (a) Frequencies of the four most common INDELs generated by NHEJ. In the bar charts, dots represent data from selected individual sequencing reactions where the knockout (KO) and Synthego ICE scores were greater than 40. Wide bars, mean values; error bars, standard deviation; *p <0.01 for Gal4-fusions vs the closed chromatin control (Gal4EED/luc +dox DMSO). The stacked bar chart shows the distribution of INDEL variants (averaged values) for each sample. (b) Heat maps indicate the frequency at which each DNA base position was affected by an insertion or deletion (INDEL).

References

    1. Jinek M., Chylinski K., Fonfara I., Hauer M., Doudna J. A., and Charpentier E., Science 337, 816 (2012).10.1126/science.1225829 - DOI - PMC - PubMed
    1. Gilbert L. A., Larson M. H., Morsut L., Liu Z., Brar G. A., Torres S. E., Stern-Ginossar N., Brandman O., Whitehead E. H., Doudna J. A., Lim W. A., Weissman J. S., and Qi L. S., Cell 154, 442 (2013).10.1016/j.cell.2013.06.044 - DOI - PMC - PubMed
    1. Tiwari V. K., Cope L., McGarvey K. M., Ohm J. E., and Baylin S. B., Genome Res. 18, 1171 (2008).10.1101/gr.073452.107 - DOI - PMC - PubMed
    1. Bell O., Tiwari V. K., Thomä N. H., and Schübeler D., Nat. Rev. Genet. 12, 554 (2011).10.1038/nrg3017 - DOI - PubMed
    1. Aoto T., Saitoh N., Sakamoto Y., Watanabe S., and Nakao M., J. Biol. Chem. 283, 18905 (2008).10.1074/jbc.M709322200 - DOI - PubMed