. 2020 Mar;19(3):e13104.
doi: 10.1111/acel.13104. Epub 2020 Jan 22.

A high-fat diet reverses metabolic disorders and premature aging by modulating insulin and IGF1 signaling in SIRT6 knockout mice

Affiliations

A high-fat diet reverses metabolic disorders and premature aging by modulating insulin and IGF1 signaling in SIRT6 knockout mice

Zhongchi Li et al. Aging Cell. 2020 Mar.

Abstract

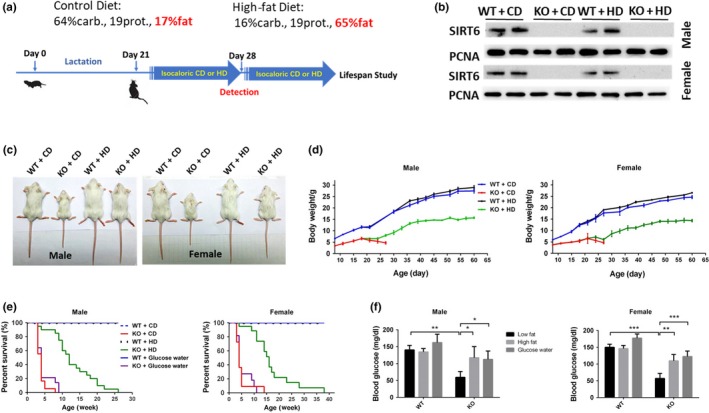
Mammalian sirtuin 6 (SIRT6) is involved in the regulation of many essential processes, especially metabolic homeostasis. SIRT6 knockout mice undergo premature aging and die at age ~4 weeks. Severe glycometabolic disorders have been found in SIRT6 knockout mice, and whether a dietary intervention can rescue SIRT6 knockout mice remains unknown. In our study, we found that at the same calorie intake, a high-fat diet dramatically increased the lifespan of SIRT6 knockout mice to 26 weeks (males) and 37 weeks (females), reversed multi-organ atrophy, and reduced body weight, hypoglycemia, and premature aging. Furthermore, the high-fat diet partially but significantly normalized the global gene expression profile in SIRT6 knockout mice. Regarding the mechanism, excessive glucose uptake and glycolysis induced by the SIRT6 deficiency were attenuated in skeletal muscle through inhibition of insulin and IGF1 signaling by the high-fat diet. Similarly, fatty acids but not ketone bodies inhibited glucose uptake, glycolysis, and senescence in SIRT6 knockout fibroblasts, whereas PI3K inhibition antagonized the effects of a high-fatty-acid medium in vitro. Overall, the high-fat diet dramatically reverses numerous consequences of SIRT6 deficiency through modulation of insulin and IGF1 signaling, providing a new basis for elucidation of SIRT6 and fatty-acid functions and supporting novel therapeutic approaches against metabolic disorders and aging-related diseases.

Keywords: SIRT6; fatty acid; glycolysis; high-fat diet; insulin/IGF1 signaling; organ atrophy.


Conflict of interest statement

Authors declare no competing interests.

Figures

Figure 1
Figure 1
The high‐fat diet significantly extends the lifespan of SIRT6 KO mice. (a) According to the different genotypes and diets, the mice were subdivided into four groups, including SIRT6 knockout (KO) mice and wild‐type (WT) littermates treated with the high‐fat diet (groups WT + HD and KO + HD, respectively) or normal control diet (groups WT + CD and KO + CD, respectively). The time points in this process are indicated. (b) The expression of SIRT6 in the liver from both male and female mice was tested by Western blotting, and PCNA served as a reference. (c) The appearances of mice in different groups at 4 weeks of age. (d) The body weight was measured every 3–5 days starting at 1 week after the mice were born (n = 10–15). (e) The numbers of deaths in different groups of mice were recorded to build a survival curve (n = 15–30). (f) The blood glucose levels in both male and female mice were tested after 3 hr fasting (n = 6). Data are presented as mean ± SD. *p < .05, **p < .01, ***p < .001. See also Figure S1
Figure 2
Figure 2
The high‐fat diet reverses the SIRT6 KO‐induced multi‐organ and multi‐tissue atrophy features. Epididymal white adipose tissue (a), BAT (b), the liver (c), skeletal muscle (d), and cardiac muscle (e) from male mice were stained with H&E to visualize the structural differences among different groups (n = 6–10). Data are presented as mean ± SD. * p < .05, ** p < .01*** p < .001. (f) Representative Western blots show the expression of myostatin (Mstn) in muscles, and the statistical significance of the results was demonstrated (n = 6). Data are presented as mean ± SD. ***p < .001. See also Figure S2 and Table S1
Figure 3
Figure 3
The high‐fat diet inhibits SIRT6 KO‐induced activation of NF‐κB in muscle. Representative Western blots illustrate the phosphorylation of IκB and expression of IκB, IL‐6, and p16 in the liver, BAT, and muscle. PCNA served as a reference (n = 6). Data are presented as mean ± SD. *p < .05, ***p < .001
Figure 4
Figure 4
The metabolic pattern and gene expression profile are changed by the high‐fat diet in SIRT6 KO mice. (a) The respiratory quotient (VCO2/VO2) during 24 hr in each group was determined by means of metabolic chambers (n = 3). Whole‐genome sequencing was performed on the liver and muscle tissue samples from male mice. (b) The number of differentially expressed genes in the overlap between gene sets corresponding to genotypes and diets in muscle tissue. The screening criteria were p < .001 and the expression change greater than fourfold. (c) The heat map that was built from hierarchical clustering of 271 highly differentially expressed genes (p < .0001, fold change more than 8) out of the 916 genes in the overlap between the two sets of differentially expressed genes in muscle tissue. The heat map presents the gene expression patterns of different groups. (d) GO analysis of the 271 genes—out of the 916 genes in the overlap—indicates the signaling cascades and other pathways that were involved. (e) The number of differentially expressed genes in liver tissue. The screening criteria were p < .001 and the expression change greater than fourfold. (f) The heat map that was built from hierarchical clustering of 75 highly differentially expressed genes (p < .0001, fold change more than 8) out of the 610 genes in liver tissue. (g) GO analysis of the 75 genes indicates the signaling cascades and other pathways that were involved. (h) Representative blots show the acetylation level of histone 3 at lysine 9 and lysine 56 in muscle and liver tissues. See also Figure S3
Figure 5
Figure 5
The high‐fat diet decreases glucose uptake, glycolysis, and activation of insulin and IGF1 signaling pathways in SIRT6 KO mice. (a) 2‐NBDG was injected intravenously (10 mg/kg body weight) after the starvation for 12 hr. The fluorescence signaling was tested in liver and muscle tissues, and the relative fluorescence units (RFU) were shown (n = 4). Data are presented as mean ± SD. *p < .05, **p < .01. (b) Representative Western blots show the amounts of GLUT1, AKT, p‐AKT, PDHK1, and PFK1 in the liver, BAT, and muscle from male mice. (c) The lactic acid levels in serum and muscle (n = 6). Data are presented as mean ± SD. *p < .05, **p < .01. (d) The serum levels of insulin and IGF1 were tested in male mice (n = 6 to 8). Data are presented as mean ± SD. **p < .01, ***p < .001. (e) Representative blots reveal the expression of insulin receptor (IR), phosphorylated IR (p‐IR), insulin‐like growth factor 1 receptor (IGF1R), phosphorylated IGF1R (p‐IGF1R), and insulin receptor substrate 2 (IRS2) in the liver, BAT, and muscle of male mice. See also Figure S4
Figure 6
Figure 6
Fatty acids rather than ketone bodies inhibit glucose uptake and glycolysis in SIRT6 KO MEFs. (a) The plasma was collected from male mice at 3 hr postprandially, and the levels of FFAs and β‐hydroxybutyrate were measured next (n = 8). Data are presented as mean ± SD. *p < .05, **p < .01. (b) The lactic acid levels in WT and SIRT6 KO MEFs treated with fatty acids or ketone bodies were tested by an ELISA (n = 4). Data are presented as mean ± SD. *p < .05. (c) A luciferase reporter gene under the control of the HIF1α promoter was transfected into WT MEFs or SIRT6 KO MEFs, and these cells were cultured in a low‐glucose medium supplemented with glucose, fatty acids, or β‐hydroxybutyrate. Cell lysates were analyzed for luciferase activity (n = 3). Data are presented as mean ± SD. *p < .05, **p < .01. (d) Representative Western blots and statistical results indicate the phosphorylation of IR, AKT, and IκB and expression of HIF1α, PDHK1, and GLUT1. β‐Tubulin served as a reference. *p < .05, **p < .01. (e) WT MEFs or SIRT6 KO MEFs were cultured in the low‐glucose medium supplemented with glucose, fatty acids, or β‐hydroxybutyrate and were subjected to β‐Gal staining to demonstrate the cell senescence (n = 3). *p < .05, **p < .01, ***p < .001 compared with WT under same culture medium; # p < .05 compared with KO under high glucose medium. See also Figure S5
Figure 7
Figure 7
The PI3K inhibitor antagonizes the influence of fatty acids on SIRT6 KO MEFs. SIRT6 WT and KO MEFs were cultured with the medium supplemented with mixed fatty acids or DMSO. (a) Representative blots show the acetylation level of histone 3 at lysine 3 and lysine 56 and the statistical results are shown (n = 3). **p < .01, ***p < .001. (b) SIRT6 KO MEFs were treated with a PI3K inhibitor (LY294002) at 5 and 10 μM separately and with insulin at 17 μM. Representative blots and statistical results show the amounts of p‐AKT, AKT, p‐IκB, IκB, HIF1α, PDHK1, and GLUT1 (n = 4). *p < .05, **p < .01, ***p < .001 versus DMSO under same amount of inhibitor; ### p < .001 versus no inhibitor group under DMSO treatment. (c) A proposed mechanism of the SIRT6 KO‐induced abnormalities and the reversing effect of the high‐fat diet: SIRT6 deficiency induces overactivation of IR and IGF1R, subsequently increasing the expression of IRS and phosphorylation of AKT, which increases phosphorylation of IκB. p‐IκB separates from the NF‐κB complex, thereby promoting the translocation of p65 and p50 into the nucleus to increase the expression of myostatin and other aging‐related genes. Upregulated HIF1α raises the expression of PDHK1, PFK1, and GLUT1, which strengthen glucose uptake and glycolysis. The high‐fat diet provides fatty acids and increases the circulating FFA levels in the blood and effectively inhibits insulin‐ and IGF1 signaling‐dependent glucose uptake and glycolysis. This mechanism may be the main reason for the reversal of the SIRT6 KO‐induced abnormalities by the high‐fat diet

References

    1. Carrer, A. , Parris, J. L. D. , Trefely, S. , Henry, R. A. , Montgomery, D. C. , Torres, A. M. , … Wellen, K. E. (2017). Impact of a high‐fat diet on tissue acyl‐CoA and histone acetylation levels. Journal of Biological Chemistry, 292(8), 3312–3322. 10.1074/jbc.M116.750620 - DOI - PMC - PubMed
    1. Chang, L. , Chiang, S. H. , & Saltiel, A. R. (2004). Insulin signaling and the regulation of glucose transport. Molecular Medicine, 10(7–12), 65–71. 10.2119/2005-00029.Saltiel - DOI - PMC - PubMed
    1. Cross, D. A. , Alessi, D. R. , Cohen, P. , Andjelkovich, M. , & Hemmings, B. A. (1995). Inhibition of glycogen synthase kinase‐3 by insulin mediated by protein kinase B. Nature, 378(6559), 785–789. 10.1038/378785a0 - DOI - PubMed
    1. Finkel, T. , Deng, C. X. , & Mostoslavsky, R. (2009). Recent progress in the biology and physiology of sirtuins. Nature, 460(7255), 587–591. 10.1038/nature08197 - DOI - PMC - PubMed
    1. Fujita, K. , Hayashi, T. , Matsushita, M. , Uemura, M. , & Nonomura, N. (2019). Obesity, inflammation, and prostate cancer. Journal of Clinical Medicine, 8(2), 201 10.3390/jcm8020201 - DOI - PMC - PubMed

Publication types