. 2020 Mar;19(3):e13105.
doi: 10.1111/acel.13105. Epub 2020 Jan 22.

Physical fitness in community-dwelling older adults is linked to dietary intake, gut microbiota, and metabolomic signatures

Affiliations

Physical fitness in community-dwelling older adults is linked to dietary intake, gut microbiota, and metabolomic signatures

Josué L Castro-Mejía et al. Aging Cell. 2020 Mar.

Abstract

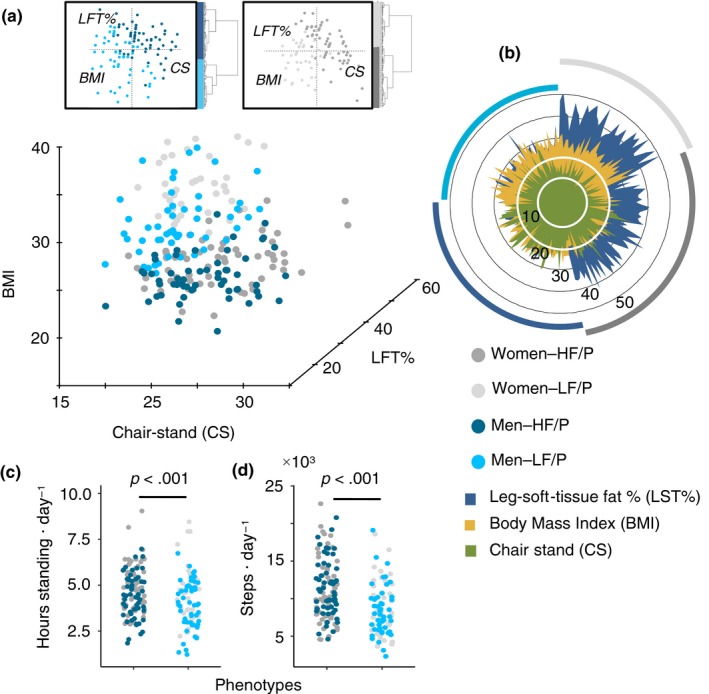
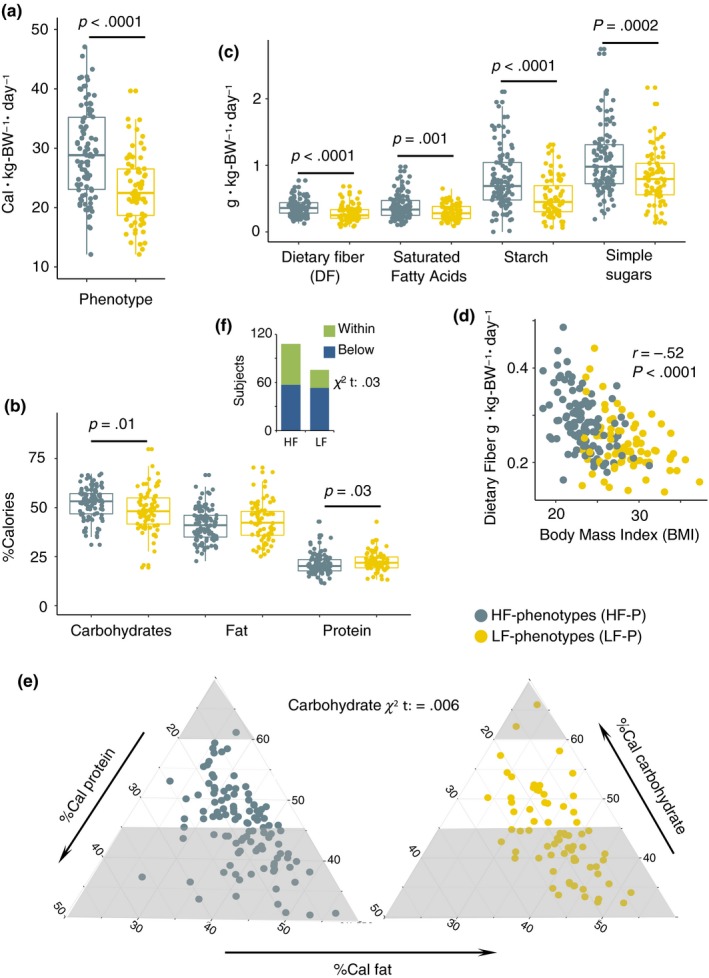
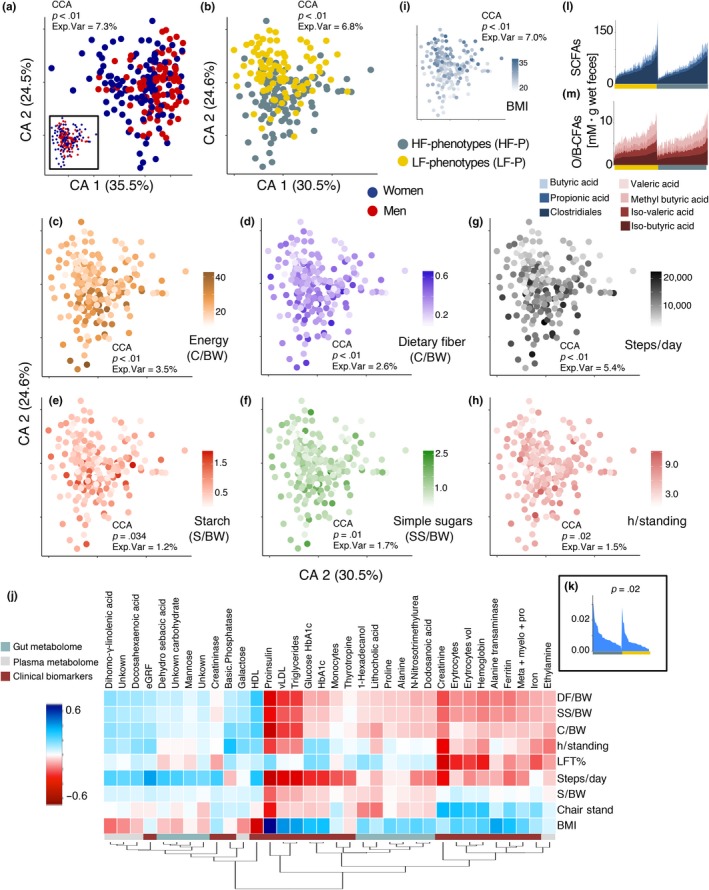
When humans age, changes in body composition arise along with lifestyle-associated disorders influencing fitness and physical decline. Here we provide a comprehensive view of dietary intake, physical activity, gut microbiota (GM), and host metabolome in relation to physical fitness of 207 community-dwelling subjects aged +65 years. Stratification on anthropometric/body composition/physical performance measurements (ABPm) variables identified two phenotypes (high/low-fitness) clearly linked to dietary intake, physical activity, GM, and host metabolome patterns. Strikingly, despite a higher energy intake high-fitness subjects were characterized by leaner bodies and lower fasting proinsulin-C-peptide/blood glucose levels in a mechanism likely driven by higher dietary fiber intake, physical activity and increased abundance of Bifidobacteriales and Clostridiales species in GM and associated metabolites (i.e., enterolactone). These factors explained 50.1% of the individual variation in physical fitness. We propose that targeting dietary strategies for modulation of GM and host metabolome interactions may allow establishing therapeutic approaches to delay and possibly revert comorbidities of aging.

Keywords: aging; energy and dietary fiber intake; gut microbiota; host metabolome; physical fitness; proinsulin-C-peptide.


Conflict of interest statement

None declared.

Figures

Figure 1
Figure 1
Stratification of fitness phenotypes. (a) Stratification of subjects (n = 207) by hierarchical clustering analysis of principal components analysis (HCA‐PCA). Stratification data matrix: [obj × vars] = [207 × 3]. HCA‐PCA was performed within sexes and based on ABP measurements. HF/P: high‐fitness (n = 116) and LF/P: low‐fitness phenotypes (n = 91). (b) ABP measurements distribution among phenotypes and sexes. (c) 4‐day activity monitoring displaying hours standing and steps on daily basis for both phenotypes. 4‐day activity data matrix: [obj × vars] = [196 × 2]
Figure 2
Figure 2
Dietary intake and distribution. (a) Total energy consumption per kg‐body‐weight per day (Cal kg body weight−1 day−1). (b) Distribution of Calories proportionally obtained from macronutrients intake in HF and LF phenotypes. (c) Intake of carbohydrates by quality and saturated free fatty acids (g kg body weight−1 day−1). (d) Pearson correlation between dietary fiber (g kg body weight−1 day‐1) and BMI depicted according to phenotypes category. (e) Proportion of subjects complying with recommended carbohydrates distribution ranges. The gray areas correspond to nonrecommended ranges as suggested by the Nordic Nutrition Recommendations. (f) Proportion of subjects complying with recommended distribution ranges of dietary fiber according to the Nordic Nutrition Recommendations. Dietary data matrix: [obj × vars] = [181 × 11]
Figure 3
Figure 3
Dietary intake and fitness phenotypes are linked with species‐level GM patterns. (a) Gut microbiota (GM) composition determined through Correspondence Analysis of 16S rRNA gene (V3‐region) amplicons (summarized zOTUs at species level) determined in the stool samples of the study participants. (b) Correspondence Analysis revealed compositional GM differences between fitness phenotypes. (c) Constrained Correspondence Analysis (CCA) displays discrimination of phenotypes based on permutational test (p = .03, explained variance = 3.2%). (d) Correspondence Analysis of GM composition depicting gradients of total energy consumption (Cal kg body weight−1 day−1), intake of (e) starch (g kg body weight−1 day−1) and (f) dietary fiber (g kg body weight−1 day−1), (g) steps per day, and (h) BMI. (i) Regularized canonical correlation (rCC) analysis depicting the relationship between gradients of energy consumption, starch and dietary fiber intake, steps per day and BMI, and variations in the abundance of GM members. Heatmap displays the correlation of 161 species with a minimum correlation coefficient of |0.2|r from 1st to 3rd components. Species are depicted based on family‐level phylogeny. Figure S3 displays taxonomy at species level, as well as correlations per canonical axis and explained variance between GM composition and lifestyle covariates derived from rCC analysis. GM profiling was based on 11.3 million reads derived from the 16S rRNA gene V3‐region with an average of 116,476 (48,872 SD) sequences per subject. Adonis tests were performed on Bray–Curtis distances. GM data matrix: [obj × vars] = [184 × 874].
Figure 4
Figure 4
Profiling of host metabolome in relation to dietary intake. (a) Correspondence Analysis on combined fecal, plasma metabolomes and clinical biomarkers of the study participants. Significant differences due to sex were determined with constrained correspondence analysis (CCA). Inset shows a partial Correspondence Analysis after conditioning for the cofounding effect of sex. (b) Correspondence Analysis discriminates compositional differences in metabolomic profiles between fitness phenotypes. (c) Correspondence Analysis of metabolites in relation to total energy consumption (Cal kg body weight−1 day−1), intake of (d) dietary fiber (g kg body weight−1 day−1), (e) starch (g kg body weight−1 day−1) and (f) simple sugars (g kg body weight−1 day−1), (g) steps per day, (h) hours standing, and (i) BMI. (j) Regularized canonical correlation (rCC) analysis showing the relationship between gradients of energy consumption, dietary fiber, starch and simple sugar intake, steps per day, hours standing and BMI, with variations in metabolome composition. Heatmap displays the correlation of 34 clinical/metabolome variables with a minimum correlation coefficient of |0.2|r from 1st to 4th components. Figure S4 shows correlations per canonical axis as well as explained variance between metabolome composition and lifestyle covariates derived from rCC analysis. (k) Significantly (t test, p = .02) different relative distributions in enterolactone determined in fecal samples of HF and LF phenotypes. (l,m) Range of fecal SCFAs and O/B‐CFAs concentrations sorted according to fitness phenotype. Metabolome data matrix: [obj × vars] = [184 × 335]
Figure 5
Figure 5
Signatures discriminating physical phenotypes. (a) Heatmap displaying mean centered normalized abundance of 55 features selected using Random Forest toward discrimination of phenotypes and (b) their importance as determined on the basis of Mean Decrease in Accuracy. (c) Multidimensional scaling plot discriminates subjects' phenotype based on the selected features. (d) ROC curves and out‐of‐bag error rate (OOB) for Random Forest classifier based on the selected variables, for combined datasets (all selected features), GM and metabolome, dietary intake, and physical activity. (e) Captured variance for fitness variables (BMI, chair stand, and LST%) as a function of selected features through redundancy analysis (RDA). Individual Explained Variance displays the size effect of a given dataset, CE variance represents the cumulative explained variance and CE variance | physical activity shows the accumulative explained variance conditioned by physical activity. Pie charts summarize the total proportion of explained variance before and after conditioning for physical activity. Data matrix: [obj × vars] = [181 × 56]

References

    1. Allin, K. H. , Tremaroli, V. , Caesar, R. , Jensen, B. A. H. , Damgaard, M. T. F. , Bahl, M. I. , … Pedersen, O. (2018). Aberrant intestinal microbiota in individuals with prediabetes. Diabetologia, 61, 810–820. 10.1007/s00125-018-4550-1 - DOI - PMC - PubMed
    1. Aoki, R. , Kamikado, K. , Suda, W. , Takii, H. , Mikami, Y. , Suganuma, N. , … Koga, Y. (2017). A proliferative probiotic Bifidobacterium strain in the gut ameliorates progression of metabolic disorders via microbiota modulation and acetate elevation. Scientific Reports, 7, 43522 10.1038/srep43522 - DOI - PMC - PubMed
    1. Bechshøft, R. L. , Reitelseder, S. , Højfeldt, G. , Castro‐Mejía, J. L. , Khakimov, B. , Ahmad, H. F. B. , … Holm, L. (2016). Counteracting Age‐related Loss of Skeletal Muscle Mass: A clinical and ethnological trial on the role of protein supplementation and training load (CALM Intervention Study): Study protocol for a randomized controlled trial. Trials, 17, 397 10.1186/s13063-016-1512-0 - DOI - PMC - PubMed
    1. Biagi, E. , Nylund, L. , Candela, M. , Ostan, R. , Bucci, L. , Pini, E. , … De Vos, W. (2010). Through ageing, and beyond: Gut microbiota and inflammatory status in seniors and centenarians. PLoS ONE, 5, e10667 10.1371/journal.pone.0010667 - DOI - PMC - PubMed
    1. Black, A. E. (2000). Critical evaluation of energy intake using the Goldberg cut‐off for energy intake: Basal metabolic rate. A practical guide to its calculation, use and limitations. International Journal of Obesity, 24, 1119–1130. - PubMed

Publication types

MeSH terms