. 2020 Jul 21;31(16):1774-1787.
doi: 10.1091/mbc.E19-01-0027. Epub 2020 Jan 22.

Mechanical stress triggers nuclear remodeling and the formation of transmembrane actin nuclear lines with associated nuclear pore complexes

Affiliations

Mechanical stress triggers nuclear remodeling and the formation of transmembrane actin nuclear lines with associated nuclear pore complexes

Laura M Hoffman et al. Mol Biol Cell. .

Abstract

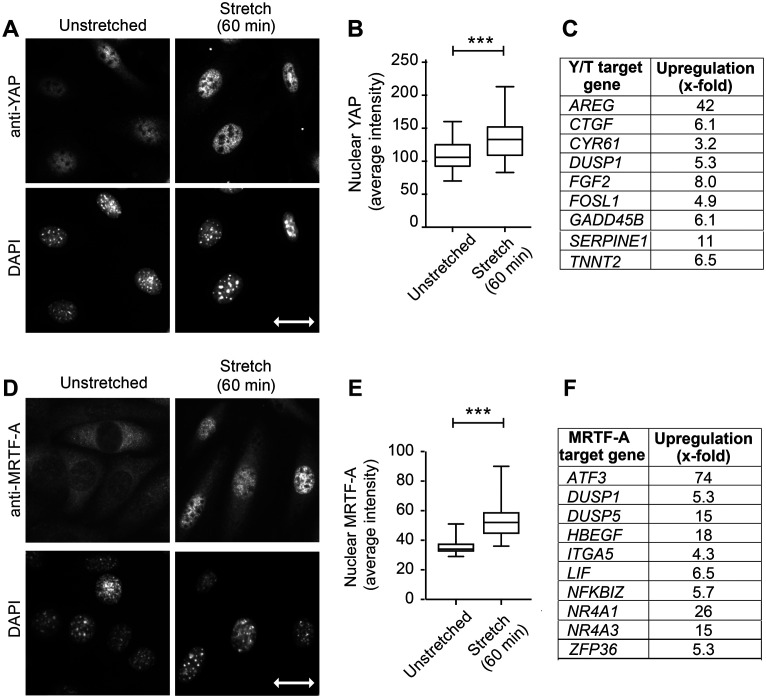
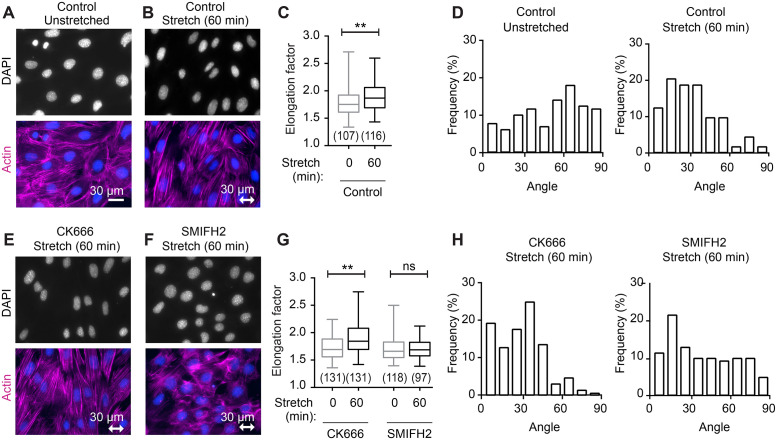
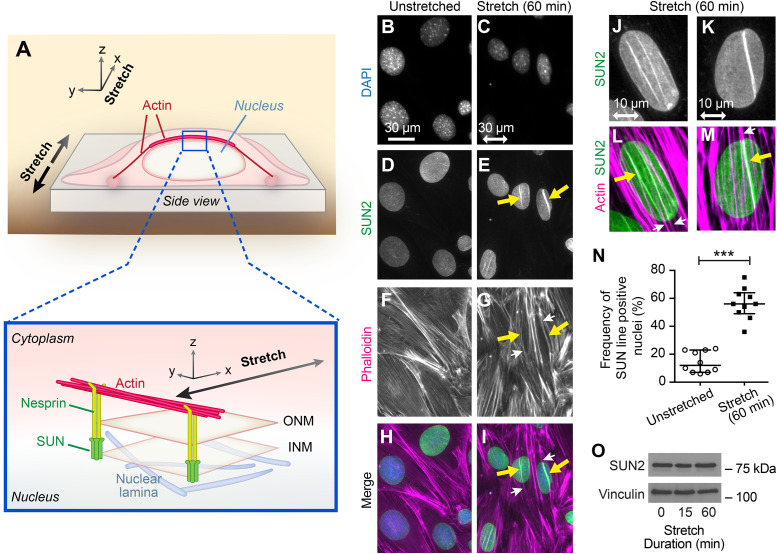
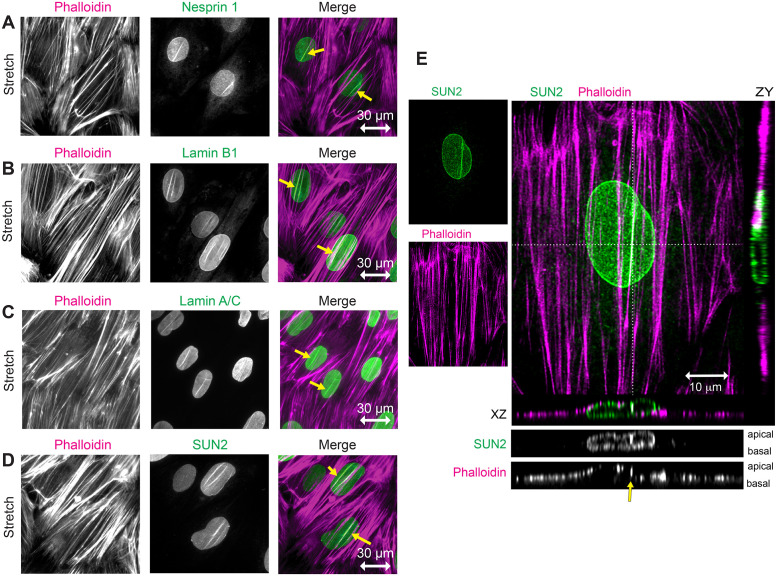
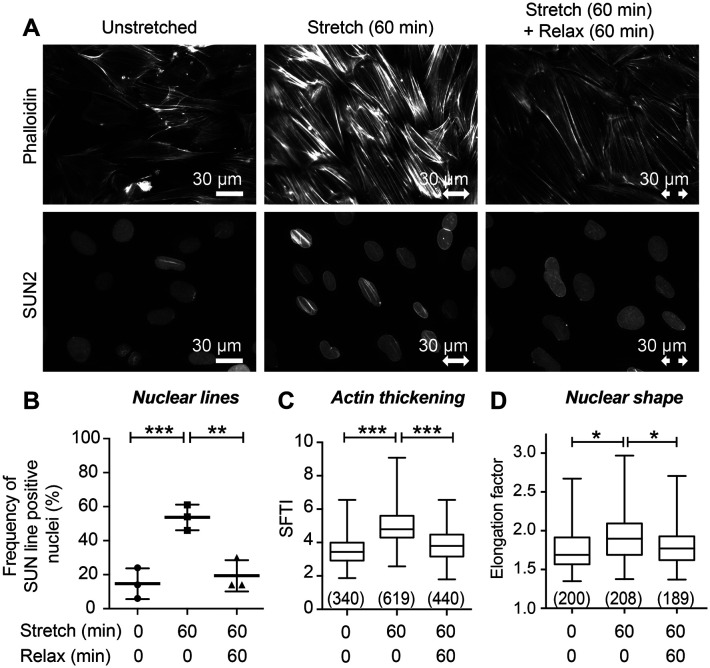
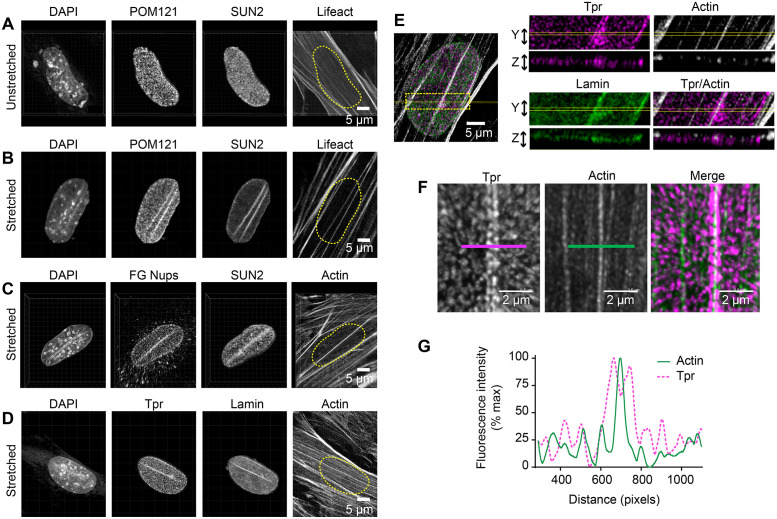
Mechanical stimulation of fibroblasts induces changes in the actin cytoskeleton including stress fiber (SF) reinforcement and realignment. Here we characterize the nuclear response to mechanical stimulation (uniaxial cyclic stretch). Using fluorescence microscopy and quantitative image analysis we find that stretch-induced nuclear elongation and alignment perpendicular to the stretch vector are dependent on formin-regulated actin polymerization. The mechanosensitive transcription factors Yes-associated protein/Transcriptional coactivator with PDZ domain (YAP/TAZ) and myocardin-related transcription factor (MRTF-A, also known as MKL1 and MAL1) accumulate in the nucleus and activate their target genes in response to uniaxial cyclic stretch. We show that transmembrane actin nuclear (TAN) lines are induced by stretch stimulation and nuclear envelope (NE) proteins including nesprins, SUN2, and lamins form Linkers of the Nucleoskeleton and Cytoskeleton (LINC) complexes aligned with actin SFs. These NE structures are altered by pharmacological treatments (Cytochalasin D and Jasplakinolide) or genetic disruption (zyxin gene deletion) that alter actin, and their persistence requires maintenance of stretch stimulation. Nuclear pore complexes (NPCs) accumulate at TAN lines providing a potential mechanism for linking mechanical cues to NPC function.


Figures

FIGURE 1:
FIGURE 1:
Linking YAP/TAZ and MRTF-A to uniaxial cyclic stretch response. (A) YAP immunolocalization to fibroblast nuclei (DAPI staining) on unstretched membranes and following uniaxial cyclic stretch (15% 0.5Hz 60 min). (B) Quantitation of nuclear YAP signal (region of interest selected from DAPI image; n = 61 nuclei in unstretched condition and n = 76 nuclei following stretch stimulation). (C) YAP/TAZ target genes identified as up-regulated in RNA seq analysis comparing four pairs of unstretched and stretch-stimulated (15% 0.5 Hz 6 h) cell mRNAs are presented as increased-fold change. (D) MRTF-A immunolocalization and DAPI-stained nuclei are shown for unstretched and stretch-stimulated cells. (E) Quantitation of nuclear MRTF-A signal (region of interest selected from DAPI image; n = 108 nuclei in unstretched condition and n = 110 nuclei following stretch stimulation). (F) MRTF-A target genes up-regulated by stretch stimulation in RNA seq analysis described above; 10 highest responders are shown here and all 25 target genes are shown in Supplemental Figure S1. Stretch vector is shown as a double-headed arrow of 30 micron scale on the DAPI image. Graphs of nuclear signals are box and whisker plots with median shown and minimum to maximum range. Unpaired t tests were used to determine p values ***p < 0.0001. RNA sequence gene descriptions with log twofold changes, p values, and references that identify the target genes are included as Supplemental Figure S1.
FIGURE 2:
FIGURE 2:
Stretch-induced change in nuclear shape and positioning requires formin-dependent actin cytoskeleton. (A) Fluorescence microscopy of DAPI-stained nuclei (blue) and F-actin (phalloidin, magenta) on unstretched cells and (B) in cells subjected to stretch-stimulation (uniaxial cyclic stretch 15% 0.5 Hz 60 min). (C) Quantitation of nuclear elongation factor for unstretched (107 nuclei) and stretch-stimulated (116 nuclei) cells. (D) Graph of nuclear alignment relative to the horizontal axis shows nuclei binned into 10o increments with respect to perpendicular (0o) alignment. Unstretched nuclei (n = 127) in relatively random alignment shifted to perpendicular alignment in stretch-stimulated nuclei (n = 112), with 71% distributed to within 40o. DAPI (blue) and F-actin (magenta) staining of stretch-stimulated cells in the presence of inhibitors (E) CK666 (100 µm) Arp2/3 inhibitor or (F) SMIFH2 (15 µm) formin inhibitor. (G) Quantitation of nuclear elongation factor for cells stretch-stimulated in the presence of CK666 (n = 131, 131) or SMIFH2 (n = 118, 97), presented as median with minimum to maximum range. (H) Graph of nuclear alignment relative to the horizontal axis for cells stretch-stimulated in the presence of CK666 (n = 123) or SMIFH2 (n = 140). Box and whisker plots are presented as median with minimum to maximum range, and p values were determined by unpaired t tests. **p < 0.001 and n.s. is not statistically significant. The double-headed arrow indicates stretch vector and scale of 30 µm.
FIGURE 3:
FIGURE 3:
Linker of Nucleoskeleton and Cytoskeleton (LINC) complexes and associated actin SFs are stimulated by mechanical stress. (A) General model of stretch-stimulated cell with NE LINC complexes (nesprin and SUN proteins) shown in relation to the nuclear lamina (below) and the cytoplasmic actin cytoskeleton (above). Nesprin proteins in the outer nuclear membrane (ONM) and SUN proteins in the inner nuclear membrane (INM) complete the molecular chain from cytoplasmic actin to nuclear lamina. (B–I) Widefield fluorescent microscopy of cells in unstretched and stretch-stimulated conditions shows nuclei (DAPI, B and C), LINCs (SUN2 immunolocalization-Abcam antibody, D and E), and F-actin (Phalloidin, F and G). Merge overlay (H and I) shows actin SFs (magenta, white arrows) colocalized with SUN2 (green, yellow arrows) nuclear lines in stretch-stimulated cells. The stretch vector is shown in the horizontal plane with a double-headed arrow of scale 30 microns. (J–M) Widefield fluorescent microscopy of stretch-stimulated nuclei showing two examples of SUN2 immunolocalization (green) and F-actin (Phalloidin, magenta) codistribution (yellow arrows). The stretch vector is shown in the horizontal plane with double-headed arrow of scale 10 microns. (N) Nuclei from unstretched and stretch-stimulated cells were scored for nuclear lines and displayed as a percentage of cells positive for SUN2 nuclear lines. Graph (mean with SD) shows a compilation of population percentages from 10 experiments of paired unstretched nuclei (n = 845 nuclei) and stretch-stimulated nuclei (n = 1244 nuclei) revealing an average nuclear line detection of 14% in the unstretched population that increased to 56% in the stretched population. ***p < 0.0001 was determined by Student’s unpaired t test. (O) Western immunoblot analysis of SUN2 levels in cell lysates (15 µg) from unstretched and stretch-stimulated (uniaxial cyclic stretch 15% 0.5 Hz for 15 and 60 min) cells using vinculin as loading control.
FIGURE 4:
FIGURE 4:
Stretch-stimulated LINC components include Nesprin, SUN, and Lamin proteins. (A–D) Widefield fluorescence microscopy of F-actin (phalloidin, magenta) and LINC components (green) including Nesprin 1, Lamin B1, Lamin A/C, and SUN2 in stretch-stimulated cells. Merged images show codistribution of actin and LINC proteins (yellow arrows) in nuclei aligned perpendicular to the stretch vector (indicated by a horizontal double-headed arrow of 30 micron scale). (E) Confocal microscopy of stretch-stimulated fibroblast stained with SUN2-specific antibody (green, Burke #3.1E mab) and Phalloidin (magenta), shown as maximum intensity projections with 10 micron scale bar. Orthogonal z sections are designated by dashed lines in the x (below merge) and y (right of merge) planes. Grayscale z sections are shown with apical surface on top and basal surface on bottom. SUN2 is distributed throughout the NE and F-actin is distributed across the top of nucleus and along the flat cell edges. SUN2 localizes with one prominent actin SF (yellow arrow) but not with a neighboring SF crossing the nucleus; see associated Supplemental Videos S1–S3.
FIGURE 5:
FIGURE 5:
Actin and SUN2 nuclear line structures require sustained mechanical stimulation. (A) Widefield fluorescent microscopy of F-actin (phalloidin) and SUN2 immunolocalization on cells in unstretched condition prior to fixation, or subjected to stretch then fixed immediately, or subjected to stretch then allowed 60 min without stretch (“relaxation”) prior to fixation. Stretch vector is shown by a double-headed arrow of 30 micron scale. (B) Quantitation of cell population with SUN2 nuclear lines shows unstretched baseline of 15% of nuclei (n = 298 nuclei scored) increased to 54% of nuclei (n = 372 nuclei scored) with stretch-stimulation and decreased to 20% (n = 303 nuclei scored) following 60 min without stimulation. Graph is mean with SD of summary data points shown from three independent experiments. (C) SFTI analysis shows unstretched SF thickness (n = 340 measurements) increased with stretch stimulation (n = 619 measurements) and returned to baseline following 60 min without stretch (n = 440 measurements). (D) Nuclear Elongation factor (measured by Feret’s diameter analysis) of unstretched cells (n = 200) increased with 60 min of stretch (n = 208) and decreased following 60 min relaxation (n = 189). Graphs C and D are box and whisker plots showing median with minimum to maximum range and p values (*p < 0.05, **p < 0.001, ***p < 0.0001) determined by unpaired t tests.
FIGURE 6:
FIGURE 6:
SUN2 nuclear lines require robust actin filaments. (A) SFTI for cells in unstretched (n = 259 measurements) and stretch-stimulated (n = 283) conditions, or in the presence of 250 nM actin inhibitor Cytochalasin D (unstretched n = 149, stretch-stimulated n = 147) are presented as box and whisker plots of median with minimum to maximum range of measurements and p values are determined by unpaired Student’s t test. (B) Graph of mean with SD of SUN2 nuclear line-positive cells in three populations of unstretched and stretch-stimulated (n = 495 nuclei) cells and in cells stimulated in the presence of Cytochalasin D (n = 349 nuclei). The population percentages of cells positive for nuclear lines are presented from three independent experiments; p values determined by paired Student’s t tests. (C) Western immunoblot analysis for zyxin and SUN2 levels in WT, zyxin-null, and zyxin-null cells engineered to express GFP-zyxin; vinculin serves as a loading control (load 20 µg). (D) SUN2 immunolocalization in unstretched and stretch-stimulated cells expressing GFP-zyxin shows stretch-stimulated zyxin distribution along entire actin SFs and codistribution with SUN2 nuclear lines (yellow arrow). Stretch vector is shown as a double-headed arrow in the horizontal plane of a 30 micron scale. (E) Graph of nuclei (n > 200 nuclei per set) with SUN2-positive nuclear lines in unstretched and stretch-stimulated WT cells, zyxin-null cells, and zyxin-null cells expressing GFP-zyxin. Data were analyzed using Chi-square test (Fisher’s exact test) to determine p values. (F) Four examples of SUN2 immunolocalization in control nuclei not treated with inhibitor. (G) Four examples of SUN2 immunolocalization in nuclei from cells treated with Jasplakinolide (50 nM, 2 h). F-actin (phalloidin, green) and DAPI (blue) shown for untreated cells (H) and for cells treated with 50 nM Jasplakinolide for 2 h (I). YAP immunolocalization is shown for the same fields with scale bar of 30 microns. (J) Using a region of interest outlined by the DAPI signal, the nuclear YAP signal was identified and quantitated for control cells (n = 30 nuclei) and Jasplakinolide-treated cells (n = 32 nuclei) and presented as median with minimum to maximum range. *p < 0.05, ***p < 0.0001.
FIGURE 7:
FIGURE 7:
LINCs and NPCs codistribute following uniaxial cyclic stretch. Multichannel imaging of nuclei in unstretched condition (A) or following uniaxial cyclic stretch (B) includes DAPI (DNA), POM121-GFP (NPC component), SUN2 (inner nuclear membrane LINC), and Lifeact-apple (cytoplasmic F-actin). Nuclear position is outlined (yellow dashed line) on Lifeact image. (C) Multichannel imaging of stretch-stimulated nucleus stained for DAPI, FG Nucleoporins (mAb414), SUN2, and F-actin. (D) Multichannel imaging of stretch-stimulated nucleus stained for DAPI, TPR (NPC component), Lamin, and F-actin. Scale bar is 5 microns. (E) Maximum intensity projection of confocal images of TPR (magenta), F-actin (white), and Lamin A/C (green). Images were sampled (yellow box) in z plane (0.25 microns) to show the distribution of signals in a single plane. Scale bar 5 microns. (F) Confocal microscopy of NPC component TPR (magenta) and F-actin (green) resolves the NPCs aligned adjacent to the actin SF. Scale bar 2 microns. (G) Line scans of TPR (dashed magenta line) and F-actin (solid green line) images. Images presented are maximum intensity projections from a confocal stack of images.

Comment in

  • Editorial introduction.
    Yap AS. Yap AS. Mol Biol Cell. 2020 Jul 21;31(16):1651-1653. doi: 10.1091/mbc.E20-06-0414. Mol Biol Cell. 2020. PMID: 32692641 Free PMC article.

References

    1. Alam SG, Zhang Q, Prasad N, Li Y, Chamala S, Kuchibhotla R, Kc B, Aggarwal V, Shrestha S, Jones AL, et al (2016). The mammalian LINC complex regulates genome transcriptional responses to substrate rigidity. Sci Rep , 38063. - PMC - PubMed
    1. Aragona M, Panciera T, Manfrin A, Giulitti S, Michielin F, Elvassore N, Dupont S, Piccolo S. (2013). A mechanical checkpoint controls multicellular growth through YAP/TAZ regulation by actin-processing factors. Cell , 1047–1059. - PubMed
    1. Bell ES, Lammerding J. (2016). Causes and consequences of nuclear envelope alterations in tumour progression. Eur J Cell Biol , 449–464. - PMC - PubMed
    1. Ben-Yishay R, Ashkenazy AJ, Shav-Tal Y. (2016). Dynamic encounters of genes and transcripts with the nuclear pore. Trends Genet , 419–431. - PubMed
    1. Blobel G. (1985). Gene gating: a hypothesis. Proc Natl Acad Sci USA , 8527–8529. - PMC - PubMed

Publication types

LinkOut - more resources