. 2020 Jan 22;15(1):e0228039.
doi: 10.1371/journal.pone.0228039. eCollection 2020.

Neural effects of acute stress on appetite: A magnetoencephalography study

Affiliations

Neural effects of acute stress on appetite: A magnetoencephalography study

Chika Nakamura et al. PLoS One. .

Abstract

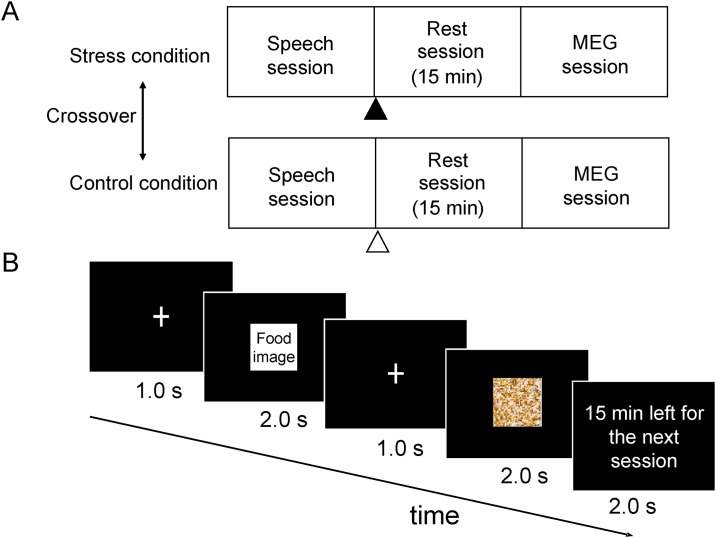
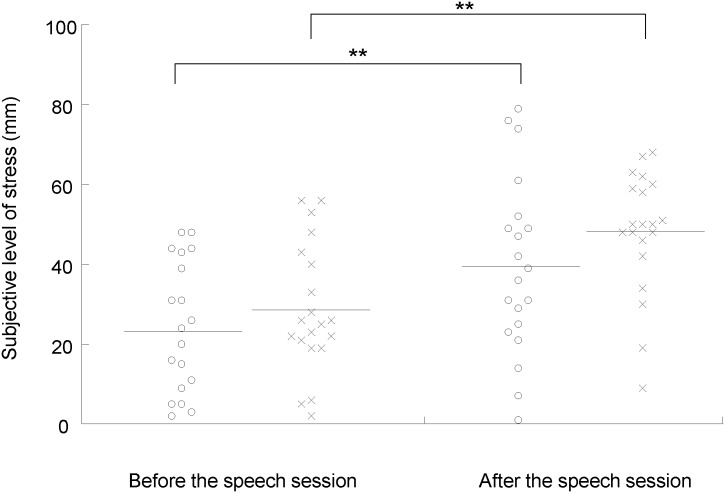
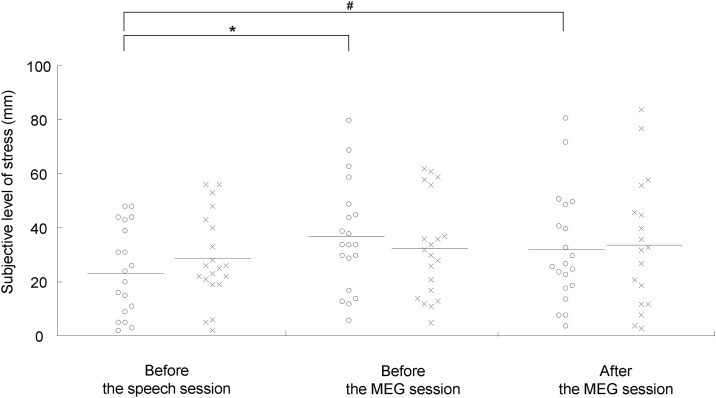
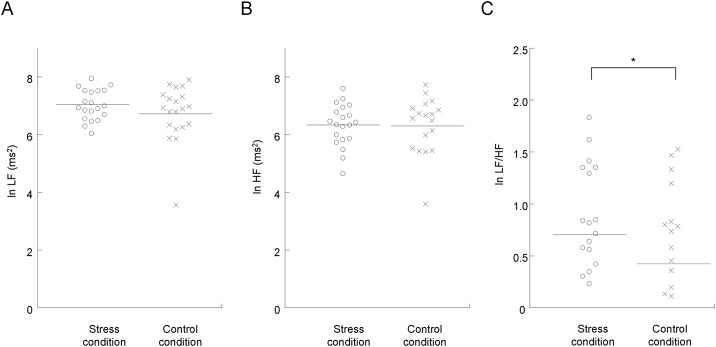
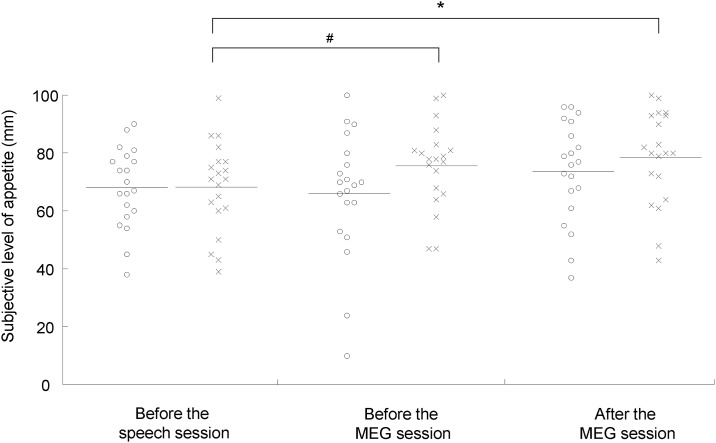
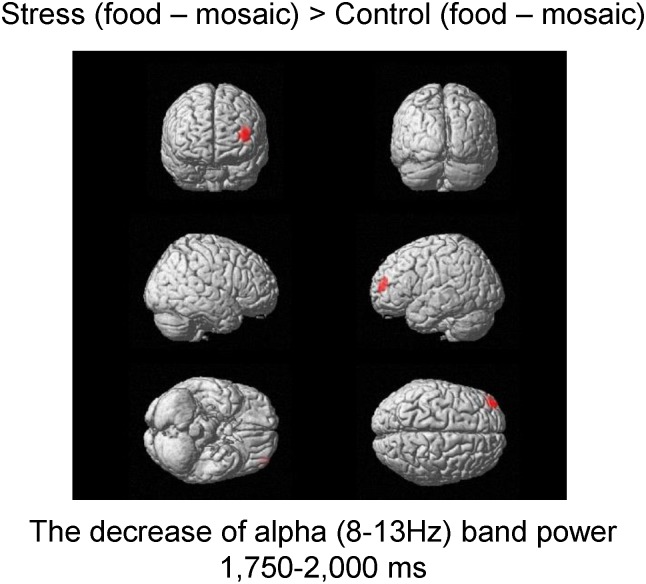
Stress is prevalent in modern society and can affect human health through its effects on appetite. Therefore, in the present study, we aimed to clarify the neural mechanisms by which acute stress affects appetite in healthy, non-obese males during fasting. In total, 22 volunteers participated in two experiments (stress and control conditions) on different days. The participants performed a stress-inducing speech-and-mental-arithmetic task under both conditions, and then viewed images of food, during which, their neural activity was recorded using magnetoencephalography (MEG). In the stress condition, the participants were told to perform the speech-and-mental-arithmetic task again subsequently to viewing the food images; however, another speech-and-mental-arithmetic task was not performed actually. Subjective levels of stress and appetite were then assessed using a visual analog scale. Electrocardiography was performed to assess the index of heart rate variability reflecting sympathetic nerve activity. The findings showed that subjective levels of stress and sympathetic nerve activity were increased in the MEG session in the stress condition, whereas appetite gradually increased in the MEG session only in the control condition. The decrease in alpha band power in the frontal pole caused by viewing the food images was greater in the stress condition than in the control condition. These findings suggest that acute stress can suppress the increase of appetite, and this suppression is associated with the frontal pole. The results of the present study may provide valuable clues to gain a further understanding of the neural mechanisms by which acute stress affects appetite. However, since the stress examined in the present study was related to the expectation of forthcoming stressful event, our present findings may not be generalized to the stress unrelated to the expectation of forthcoming stressful event.


Conflict of interest statement

The authors have declared that no competing interests exist.

Figures

Fig 1
Fig 1. Experimental design.
(A) This study consisted of two conditions: a stress and a control condition. Each condition was conducted on a different day in a two-crossover fashion. The mean interval between the two experimental days was approximately 1 week. Both conditions consisted of a speech session (i.e., a speech and mental arithmetic tasks), a 15-min rest session, and a magnetoencephalography (MEG) session. After the speech session under the stress condition, the participants were instructed to perform “another speech session” after the MEG session because their achievement in the speech session was poor (▲). On the other hand, under the control condition, they were instructed to fill out a simple questionnaire after the MEG session (Δ). (B) The visual stimulus presented during the MEG session consisted of a fixation cross for 1,000 ms followed by food or mosaic images for 2,000 ms. This visual presentation sequence was played 260 times with the food and mosaic image presented randomly (i.e., the food and mosaic images were each presented 130 times). The time remaining before the start of the next session was presented for 2,000 ms approximately every 78 s so that the participants would remember that they had to perform another session (i.e., “another speech session” under the stress condition and a “questionnaire session” under the control condition).
Fig 2
Fig 2. Subjective levels of stress before and after the speech sessions under the stress (open circles) and control (crosses) conditions.
Participants were asked to rate their subjective level of stress on a 100-mm visual analog scale (VAS) from 0 (minimum stress) to 100 (maximum stress). The horizontal line in each plot indicates mean value. **P < 0.01, paired t test with Bonferroni’s correction.
Fig 3
Fig 3. Subjective levels of stress before the speech session and before and after the magnetoencephalography (MEG) sessions under the stress (open circles) and control (crosses) conditions.
Participants were asked to rate their subjective level of stress on a 100-mm visual analog scale (VAS) from 0 (minimum stress) to 100 (maximum stress). The horizontal line in each plot indicates mean value. *P < 0.05 and #P < 0.10, paired t test with Bonferroni’s correction.
Fig 4
Fig 4. Alterations in autonomic activity as assessed by frequency analysis of R-R wave intervals of electrocardiography during the magnetoencephalography (MEG) session under the stress (open circles) and control (crosses) conditions.
Values were transformed by natural logarithm (ln). Low-frequency power (ln LF; A), high-frequency power (ln HF; B), and the LF/HF ratio (ln LF/HF; C) under the stress and control conditions are shown. The horizontal line in each plot indicates mean value. *P < 0.05, paired t test with Bonferroni’s correction.
Fig 5
Fig 5. Subjective levels of appetite before the speech session and before and after the magnetoencephalography (MEG) session under the stress (open circles) and control (crosses) conditions.
Participants were asked to rate their subjective level of appetite on a 100-mm visual analog scale (VAS) from 0 (minimum appetite) to 100 (maximum appetite). The horizontal line in each plot indicates mean value. *P < 0.05 and #P < 0.10, paired t test with Bonferroni’s correction.
Fig 6
Fig 6. Statistical parametric maps of brain areas where the decrease of alpha band power in the frontal pole (Brodmann’s area 10) in the time window of 1750–2000 ms was higher under the stress compared with the control condition.
Random-effect analyses of 17 participants, P < 0.05, family-wise error-corrected for the entire search volumes.

References

    1. McCann L, Hughes CM, Adair CG, Cardwell C. Assessing job satisfaction and stress among pharmacists in Northern Ireland. Pharmacy world & science: PWS. 2009;31(2):188–94. - PubMed
    1. Khoury B, Sharma M, Rush SE, Fournier C. Mindfulness-based stress reduction for healthy individuals: A meta-analysis. J Psychosom Res. 2015;78(6):519–28. 10.1016/j.jpsychores.2015.03.009 - DOI - PubMed
    1. Lederbogen F, Kirsch P, Haddad L, Streit F, Tost H, Schuch P, et al. City living and urban upbringing affect neural social stress processing in humans. Nature. 2011;474(7352):498–501. 10.1038/nature10190 - DOI - PubMed
    1. Chrousos GP. Stress and disorders of the stress system. Nature reviews Endocrinology. 2009;5(7):374–81. 10.1038/nrendo.2009.106 - DOI - PubMed
    1. Charmandari E, Tsigos C, Chrousos G. Endocrinology of the stress response. Annual review of physiology. 2005;67:259–84. 10.1146/annurev.physiol.67.040403.120816 - DOI - PubMed

Publication types