. 2020 May;177(10):2256-2273.
doi: 10.1111/bph.14977. Epub 2020 Feb 12.

Inducible epithelial resistance against acute Sendai virus infection prevents chronic asthma-like lung disease in mice

Affiliations

Inducible epithelial resistance against acute Sendai virus infection prevents chronic asthma-like lung disease in mice

David L Goldblatt et al. Br J Pharmacol. 2020 May.

Abstract

Background and purpose: Respiratory viral infections play central roles in the initiation, exacerbation and progression of asthma in humans. An acute paramyxoviral infection in mice can cause a chronic lung disease that resembles human asthma. We sought to determine whether reduction of Sendai virus lung burden in mice by stimulating innate immunity with aerosolized Toll-like receptor (TLR) agonists could attenuate the severity of chronic asthma-like lung disease.

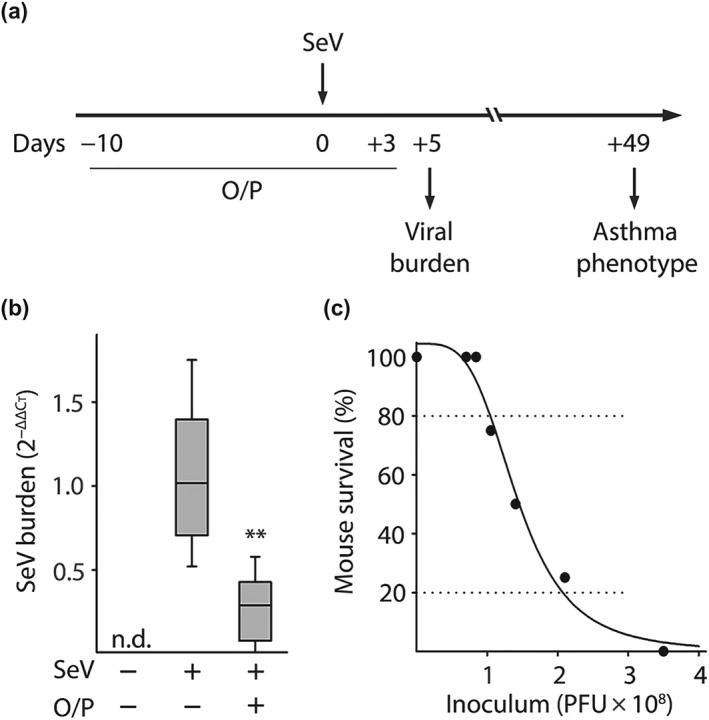
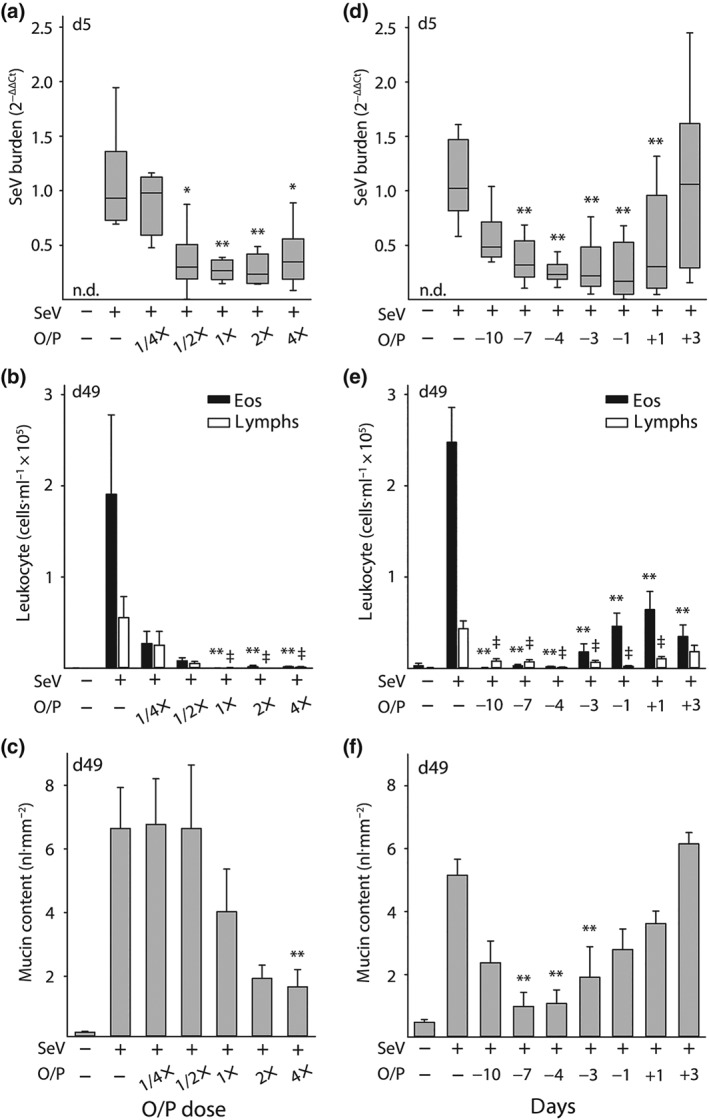
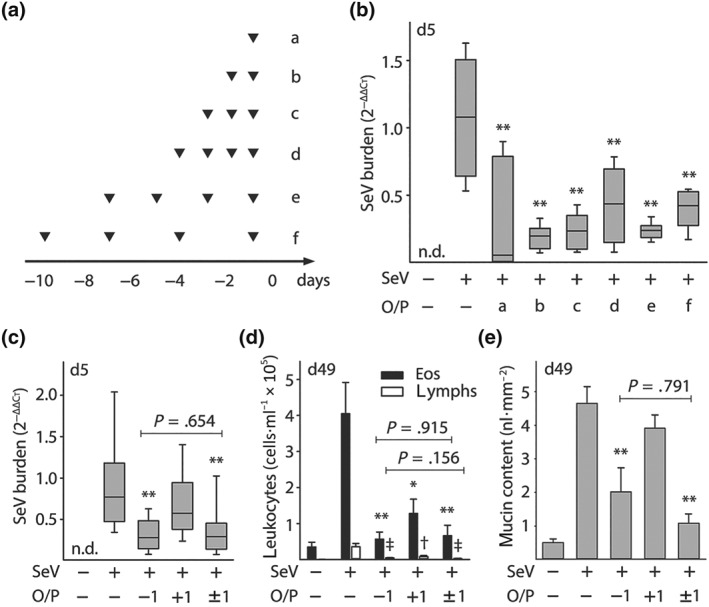
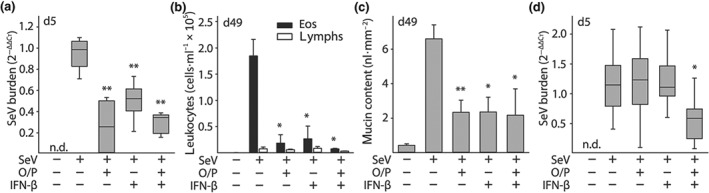
Experimental approach: Mice were treated by aerosol with 1-μM oligodeoxynucleotide (ODN) M362, an agonist of the TLR9 homodimer, and 4-μM Pam2CSK4 (Pam2), an agonist of the TLR2/6 heterodimer, within a few days before or after Sendai virus challenge.

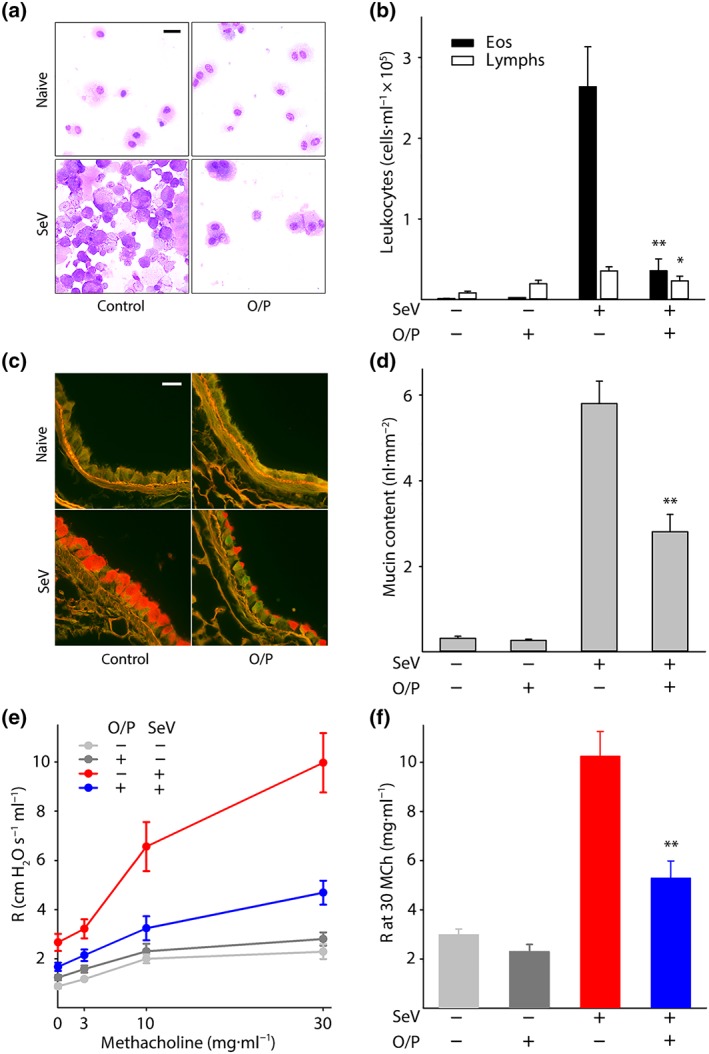
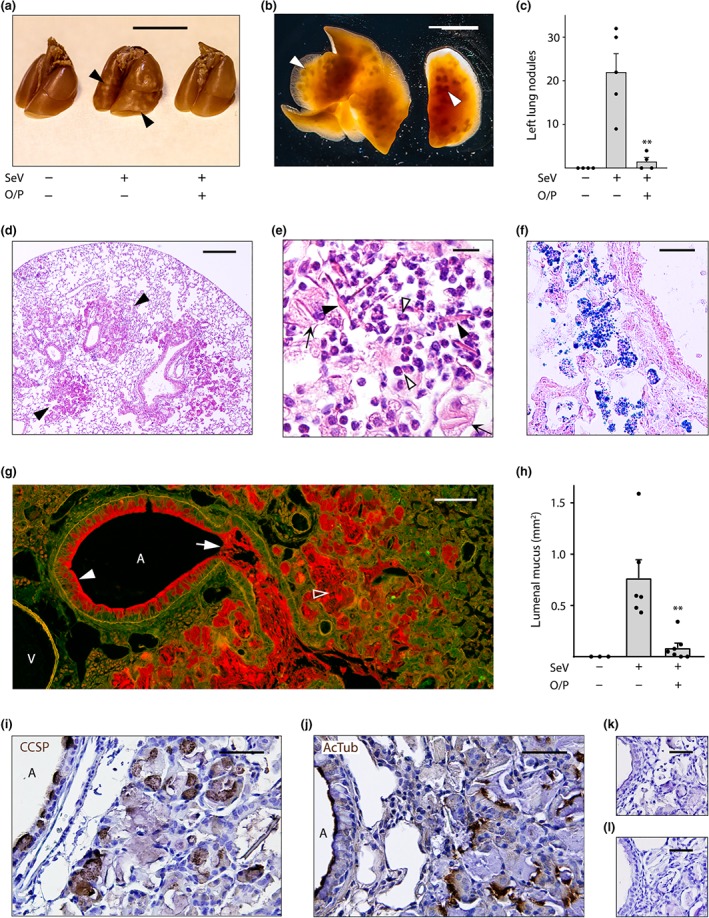
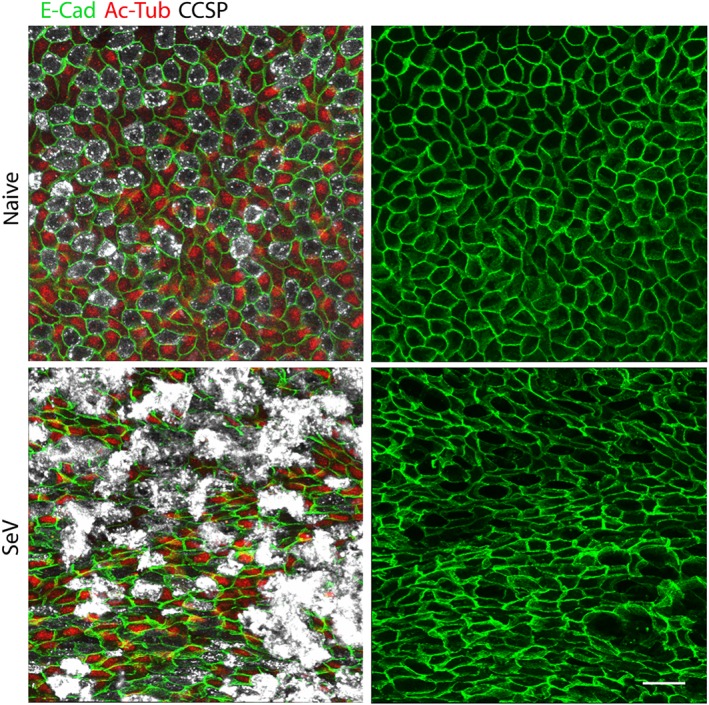
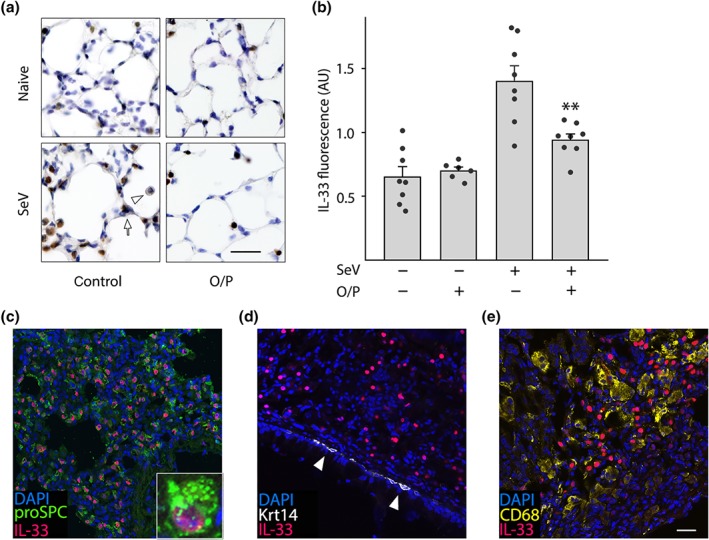
Key results: Treatment with ODN/Pam2 caused ~75% reduction in lung Sendai virus burden 5 days after challenge. The reduction in acute lung virus burden was associated with marked reductions 49 days after viral challenge in eosinophilic and lymphocytic lung inflammation, airway mucous metaplasia, lumenal mucus occlusion and hyperresponsiveness to methacholine. Mechanistically, ODN/Pam2 treatment attenuated the chronic asthma phenotype by suppressing IL-33 production by type 2 pneumocytes, both by reducing the severity of acute infection and by down-regulating Type 2 (allergic) inflammation.

Conclusion and implications: These data suggest that treatment of susceptible human hosts with aerosolized ODN and Pam2 at the time of a respiratory viral infection might attenuate the severity of the acute infection and reduce initiation, exacerbation and progression of asthma.


Conflict of interest statement

S.E.E., M.J.T. and B.F.D. are inventors on US patent 8,883,174 “Compositions for Stimulation of Mammalian Innate Immune Resistance to Pathogens,” which has been licensed by their employer, the University of Texas MD Anderson Cancer Center, to Pulmotect, Inc., which is developing O/P as a therapeutic for respiratory infections. In addition, B.L.S., S.E.E., M.J.T. and B.F.D. hold equity in Pulmotect, Inc. and B.L.S. is employed by Pulmotect, Inc.

Figures

Figure 1
Figure 1
Experimental paradigm, effect of O/P treatment on lung SeV burden and correlation between SeV burden and mouse survival. (a) Illustration of the experimental paradigm with O/P administered by aerosol a few days before or after SeV challenge, lung SeV burden assessed 5 days after challenge and development of an asthma phenotype assessed 49 days after challenge. (b) Lung SeV burden measured by qRT‐PCR 5 days after mice were challenged with SeV, with or without treatment 1 day earlier with O/P (boxes show median and interquartile range, whiskers show 10th and 90th percentiles; **P < .01 for [SeV+, O/P+] versus [SeV+, O/P−] by Mann–Whitney U test; N = 24 mice per group pooled from four experiments). (c) Various SeV inocula were administered to determine the correlation between lung SeV burden and mouse survival (N = 4 mice per group in a representative experiment performed five times)
Figure 2
Figure 2
Effects of O/P treatment on asthma phenotype 49 days after SeV challenge. (a) Leukocytes obtained by lung lavage were pelleted onto glass slides by centrifugation and stained with Wright‐Giemsa. Scale bar = 20 μm. (b) Eosinophils and lymphocytes in lung lavage fluid were enumerated (bars show mean ± SEM; *P < .05 and **P < .01 for [SeV+, O/P+] versus [SeV+, O/P−] by unpaired Student's t‐test; N = 21 mice per group pooled from three experiments). (c) Airway epithelium stained with PAFS to demonstrate intracellular mucin in red. Scale bar = 20 μm. (d) Quantification of intracellular mucin content by image analysis of airway as in (c) (bars and P values as in (b); N = 22–25 mice per group pooled from five experiments). (e) Dose–response relationship between the concentration of aerosolized methacholine and total respiratory resistance measured by forced oscillation (points show mean ± SEM; N = 9–14 mice per group pooled from three experiments). (f) Plot of total respiratory resistance at 30 mg·ml−1 methacholine (MCh) using data from (e) (bars and P values as in (b))
Figure 3
Figure 3
Dose and temporal response relationships between O/P treatment and acute lung SeV burden and late asthma phenotypes. (a) Relationship between O/P dose and lung SeV burden 5 days after SeV challenge (boxes show median and interquartile range, whiskers show 10th and 90th percentiles; *P < .05 and **P < .01 for ANOVA on ranks with Dunn's test for multiple comparisons against [SeV+, O/P−] control; N = 5–6 mice per group in a single experiment; n.d. = not detectable). (b) Relationship between O/P dose and lung lavage eosinophil and lymphocyte numbers 49 days after SeV challenge (bars show mean ± SEM; **P < .01 as in (a), ǂP < .01 for comparisons on lymphocytes; N = 5 mice/group in a single experiment). (c) Relationship between O/P dose and intracellular mucin content 49 days after SeV challenge (bars show mean ± SEM; **P < .01 as in (a); N = 6–7 in a single experiment). (d) Relationship of the interval in days between O/P treatment and SeV challenge in SeV lung burden 5 days after challenge (box plot and P values as in (a); N = 25–39 mice per group pooled from seven experiments). (e) Relationship of the interval between O/P treatment and SeV challenge in lung lavage eosinophil and lymphocyte numbers 49 days after challenge (bars and P values as in (b); N = 25–29 mice per group pooled from six experiments). (f) Relationship of the interval between O/P treatment and SeV challenge in intracellular mucin content 49 days after challenge (bars and P values as in (c); N = 6–12 mice per group pooled from three experiments)
Figure 4
Figure 4
Airway mucus occlusion, acidophilic pneumonitis and alveolar bronchiolization 49 days after SeV infection. (a) The lungs of mice treated or not with O/P, then challenged or not with SeV 1 day later, and then killed 49 days later with lungs inflated with 10% formalin to 20 cm H2O pressure. Arrowheads point to nodules on the lung surface. Scale bar = 1 cm. (b) Transilluminated lungs from a mouse challenged with SeV but not treated with O/P, as in (a). Arrowheads point to nodules in the lung interior. Scale bar = 1 cm. (c) Enumeration of nodules in the left lungs of mice treated with O/P and challenged with SeV as in (a) (bars indicate mean ± SEM; **P < .01 for [SeV+, O/P+] versus [SeV+, O/P−] by Student's t test; N = 4–5 in a single experiment). (d) Section of the lung of a mouse challenged with SeV but not treated with O/P, stained with H&E. Arrowheads point to nodules. Scale bar = 0.5 mm (N = 4 mice, d–f). (e) High magnification image of a nodule from a mouse as in (d), with closed arrowheads pointing to eosinophilic crystals, open arrowheads pointing to eosinophils and arrows pointing to foamy macrophages. Scale bar = 30 μm. (f) Image of a nodule from a mouse as in (d), but with lungs frozen and stained with Sudan black to show lipids within macrophages. Scale bar = 50 μm. (g) Section of the lung of a mouse challenged with SeV but not treated with O/P, fixed by immersion in methacarn and stained with PAFS. Closed arrowhead points to abundant intracellular mucin, arrow points to lumenal mucus occlusion, and open arrowhead points to mucus in the alveolar region. A = airway, V = vessel. Scale bar = 100 μm. (h) The area of lumenal mucus of mice treated or not with O/P, then challenged or not with SeV and then fixed and stained as in (g), with left lungs sectioned at fixed intervals using a precision cutting tool (bars indicate mean ± SEM; **P < .01 for [SeV+, O/P+] versus [SeV+, O/P−] by Mann–Whitney U test; N = 13–15 mice per group in a single experiment). (i–l) Alveolar region of a mouse challenged with SeV but not treated with O/P, stained with antibodies against (i) club cell specific protein (CCSP) or (j) acetylated tubulin (both brown) and counterstained with H&E (blue). A = airway lumen. Primary antibodies against (k) club cell specific protein or (l) acetylated tubulin were omitted to assess the specificity of antibody staining. Scale bar in all four images = 50 μm (N = 4 mice)
Figure 5
Figure 5
SeV infection alters the normal airway epithelial mosaic. Whole mount immunofluorescence images of proximal portions of the axial bronchi of mice infected or not with SeV 5 weeks earlier (N = 5 mice). Images on the left show staining for E‐cadherin (E‐Cad, green) to outline cell borders, acetylated tubulin (Ac‐Tub, red) to identify ciliated cells and club cell secretory protein (CCSP, white) to identify secretory cells. Images on the right only show staining for E‐cadherin to better illustrate changes in cell shape and pattern. Scale bar = 20 μm
Figure 6
Figure 6
Persistent IL‐33 expression after SeV challenge. (a) Images of the lungs of mice treated or not with O/P, then challenged or not with SeV 1 day later and then killed 49 days later. Brown colour is immunohistochemical staining for IL‐33. Arrow points to an intensely stained Type 2 pneumocyte, and arrowhead points to a faintly stained macrophage. Scale bar = 100 μm. (b) Same groups as in (a), but showing quantification of total IL‐33 immunofluorescence intensity (bars indicate mean ± SEM; **P < .01 for [SeV+, O/P+] versus [SeV+, O/P−] by unpaired Student's t‐test; N = 6–8 mice, with three fields examined per mouse). (c–e) Images of the lungs of mice challenged with SeV and then killed 49 days later. (c) Fluorescence staining for pro‐surfactant protein C (proSPC) to identify type 2 pneumocytes (green), IL‐33 (red) and DAPI to identify nuclei (blue). Inset shows IL‐33 expression in a type 2 pneumocyte. (d) Fluorescence staining for cytokeratin 14 (Krt14) to identify airway basal cells (white, white arrowhead), IL‐33 and DAPI as in (c), shows no apparent expression of IL‐33 in basal cells. (e) Fluorescence staining for CD68 to identify macrophages (yellow), and IL‐33 and DAPI as in (c), shows no apparent expression of IL‐33 in macrophages (scale bar for (c–e) = 200 μm, and for inset in (c) = 30 μm; N = 3 mice/antibody pair)
Figure 7
Figure 7
Effects of multiple O/P doses on tachyphylaxis and efficacy. (a) Experimental paradigm illustrating the timing of O/P doses for each experimental group in black triangles in relation to the SeV challenge given on Day 0. (b) Lung SeV burden by qRT‐PCR 5 days after mice were challenged with SeV, with or without pretreatment with O/P as outlined in (a) (boxes show median and interquartile range, whiskers show 10th and 90th percentiles; **P < .01 for analysis by ANOVA on ranks with Dunn's test for multiple comparisons against [SeV+, O/P−] control; N = 4–7 mice per group in a single experiment; n.d. = not detectable). (c) Lung SeV burden by RT‐qPCR 5 days after mice were challenged with SeV, with or without treatment with O/P 1 day before challenge (−1), 1 day after challenge (+1), or both (±1) (box plot and P values as in (b); bar and labelled P values for single comparison between [SeV+, O/P−1] versus [SeV+, O/P ± 1] by unpaired Student's t‐test; N = 14–25 mice per group pooled from three experiments). (d) Eosinophils and lymphocytes in lung lavage fluid were enumerated 49 days after SeV challenge, with or without treatment with O/P as in (c) (bars show mean ± SEM; *P < .05 and **P < .01 as in (b), P < .05 and ǂ P < .01 for comparisons on lymphocytes; bar and labelled P values as in (c); N = 8–11 mice per group pooled from two experiments). (e) Quantification of intracellular mucin content of airway epithelium 49 days after SeV challenge, with or without treatment with O/P as in (c) (bars and P values as in (c); N = 8–11 mice per group pooled from two experiments)
Figure 8
Figure 8
Comparison of the effects of O/P and IFN‐β on acute lung SeV burden and late asthma phenotypes. (a) Lung SeV burden by qRT‐PCR 5 days after mice were challenged with SeV, with or without pretreatment 1 day earlier with O/P, IFN‐β, or both (boxes show median and interquartile range, whiskers show 10th and 90th percentiles; *P < .05 and **P < .01 for [SeV+, drug+] versus [SeV+, drug−], with P > .05 for all other possible pairwise comparisons by one‐way ANOVA with Holm–Sidak's test for multiple comparisons; N = 4–6 mice per group in a single experiment; n.d. = not detectable). (b) Eosinophils and lymphocytes in lung lavage fluid were enumerated 49 days after SeV challenge as in (a) (bars show mean ± SEM; P values as in (a); N = 4–6 mice per group in a single experiment). (c) Quantification of intracellular mucin content of airway epithelium 49 days after SeV challenge as in (a) (bars and P values are as in (a); N = 3–4 in a single experiment). (d) Lung SeV burden by RT‐qPCR 5 days after mice were challenged with a high dose of SeV (2.5 × LD50), with or without pretreatment 1 day earlier with O/P, IFN‐β, or both (boxes show median and interquartile range, whiskers show 10th and 90th percentiles, n.d. = not detectable; *P < .05 for both drugs together versus either drug alone by one‐way ANOVA with Holm–Sidak's test for multiple comparisons; N = 3 for the uninfected group, 10 for all other groups in a single experiment)

References

    1. Adura, P. T. , Reed, E. , Macintyre, J. , del Rosario, A. , Roberts, J. , Pestridge, R. , … Djukanović, R. (2014). Experimental rhinovirus 16 infection in moderate asthmatics on inhaled corticosteroids. The European Respiratory Journal, 43, 1186–1189. 10.1183/09031936.00141713 - DOI - PubMed
    1. Alexander, S. P. H. , Fabbro, D. , Kelly, E. , Mathie, A. , Peters, J. A. , Veale, E. L. , … CGTP Collaborators (2019). The concise guide to pharmacology 2019/20: Catalytic receptors. British Journal of Pharmacology, 176: S247‐S296. 10.1111/bph.14751. - DOI - PMC - PubMed
    1. Alfaro, V. Y. , Goldblatt, D. L. , Valverde, G. R. , Munsell, M. , Quinton, L. J. , Walker, A. K. , … Dickey, B. F. (2014). Safety, tolerability, and biomarkers of the treatment of mice with aerosolized Toll‐like receptor ligands. Frontiers in Pharmacology, 5(8). 10.3389/fphar.2014.00008 - DOI - PMC - PubMed
    1. Annunziato, F. , Romagnani, C. , & Romagnani, S. (2015). The 3 major types of innate and adaptive cell‐mediated effector immunity. The Journal of Allergy and Clinical Immunology, 135, 626–635. 10.1016/j.jaci.2014.11.001 - DOI - PubMed
    1. Bønnelykke, K. , Vissing, N. H. , Sevelsted, A. , Johnston, S. L. , & Bisgaard, H. (2015). Association between respiratory infections in early life and later asthma is independent of virus type. The Journal of Allergy and Clinical Immunology, 136, 81–86.e4. - PMC - PubMed

Publication types