

Is the E. coli Homolog of the Formate/Nitrite Transporter Family an Anion Channel? A Computational Study
- PMID: 31968229
- PMCID: PMC7037574
- DOI: 10.1016/j.bpj.2019.12.024
Is the E. coli Homolog of the Formate/Nitrite Transporter Family an Anion Channel? A Computational Study
Abstract
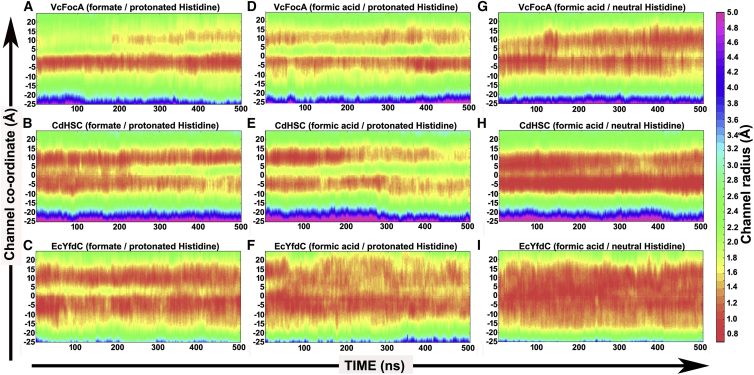
Formate/nitrite transporters (FNTs) selectively transport monovalent anions and are found in prokaryotes and lower eukaryotes. They play a significant role in bacterial growth and act against the defense mechanism of infected hosts. Because FNTs do not occur in higher animals, they are attractive drug targets for many bacterial diseases. Phylogenetic analysis revealed that they can be classified into eight subgroups, two of which belong to the uncharacterized YfdC-α and YfdC-β groups. Experimentally determined structures of FNTs belonging to different phylogenetic groups adopt the unique aquaporin-like hourglass helical fold. We considered the formate channel from Vibrio cholerae, the hydrosulphide channel from Clostridium difficile, and the uncharacterized channel from Escherichia coli (EcYfdC) to investigate the mechanism of transport and selectivity. Using equilibrium molecular dynamics and umbrella sampling studies, we determined temporal channel radius profiles, permeation events, and potential of mean force profiles of different substrates with the conserved central histidine residue in protonated or neutral form. Unlike the formate channel from V. cholerae and the hydrosulphide channel from C. difficile, molecular dynamics studies showed that the formate substrate was unable to enter the vestibule region of EcYfdC. Absence of a conserved basic residue and presence of acidic residues in the vestibule regions, conserved only in YfdC-α, were found to be responsible for high energy barriers for the anions to enter EcYfdC. Potential of mean force profiles generated for ammonia and ammonium ion revealed that EcYfdC can transport neutral solutes and could possibly be involved in the transport of cations analogous to the mechanism proposed for ammonium transporters. Although YfdC members belong to the FNT family, our studies strongly suggest that EcYfdC is not an anion channel. Absence or presence of specific charged residues at particular positions makes EcYfdC selective for neutral or possibly cationic substrates. Further experimental studies are needed to get a definitive answer to the question of the substrate selectivity of EcYfdC. This provides an example of membrane proteins from the same family transporting substrates of different chemical nature.
Copyright © 2019 Biophysical Society. Published by Elsevier Inc. All rights reserved.
Figures


Similar articles
-
Anion-selective Formate/nitrite transporters: taxonomic distribution, phylogenetic analysis and subfamily-specific conservation pattern in prokaryotes.BMC Genomics. 2017 Jul 24;18(1):560. doi: 10.1186/s12864-017-3947-4. BMC Genomics. 2017. PMID: 28738779 Free PMC article.
-
Mutational widening of constrictions in a formate-nitrite/H+ transporter enables aquaporin-like water permeability and proton conductance.J Biol Chem. 2022 Jan;298(1):101513. doi: 10.1016/j.jbc.2021.101513. Epub 2021 Dec 18. J Biol Chem. 2022. PMID: 34929166 Free PMC article.
-
Interplay between the Conserved Pore Residues Thr-91 and His-209 Controls Formate Translocation through the FocA Channel.Microb Physiol. 2022;32(3-4):95-107. doi: 10.1159/000524454. Epub 2022 Apr 7. Microb Physiol. 2022. PMID: 35390794
-
The formate/nitrite transporter family of anion channels.Biol Chem. 2013 Jun;394(6):715-27. doi: 10.1515/hsz-2012-0339. Biol Chem. 2013. PMID: 23380538 Review.
-
FocA and its central role in fine-tuning pH homeostasis of enterobacterial formate metabolism.Microbiology (Reading). 2022 Oct;168(10). doi: 10.1099/mic.0.001253. Microbiology (Reading). 2022. PMID: 36197793 Review.
Cited by
-
Microbial membrane transport proteins and their biotechnological applications.World J Microbiol Biotechnol. 2024 Jan 16;40(2):71. doi: 10.1007/s11274-024-03891-6. World J Microbiol Biotechnol. 2024. PMID: 38225445 Free PMC article. Review.
References
-
- Marchetti R.V., Lehane A.M., Kirk K. A lactate and formate transporter in the intraerythrocytic malaria parasite, Plasmodium falciparum. Nat. Commun. 2015;6:6721. - PubMed
-
- Wu B., Rambow J., Beitz E. Identity of a Plasmodium lactate/H(+) symporter structurally unrelated to human transporters. Nat. Commun. 2015;6:6284. - PubMed
-
- Lü W., Du J., Einsle O. The formate/nitrite transporter family of anion channels. Biol. Chem. 2013;394:715–727. - PubMed
Publication types
MeSH terms
Substances
LinkOut - more resources
Full Text Sources
Molecular Biology Databases
