. 2020 Jan 21;30(3):836-851.e5.
doi: 10.1016/j.celrep.2019.12.049.

Trypanosoma brucei ATR Links DNA Damage Signaling during Antigenic Variation with Regulation of RNA Polymerase I-Transcribed Surface Antigens

Affiliations

Trypanosoma brucei ATR Links DNA Damage Signaling during Antigenic Variation with Regulation of RNA Polymerase I-Transcribed Surface Antigens

Jennifer Ann Black et al. Cell Rep. .

Abstract

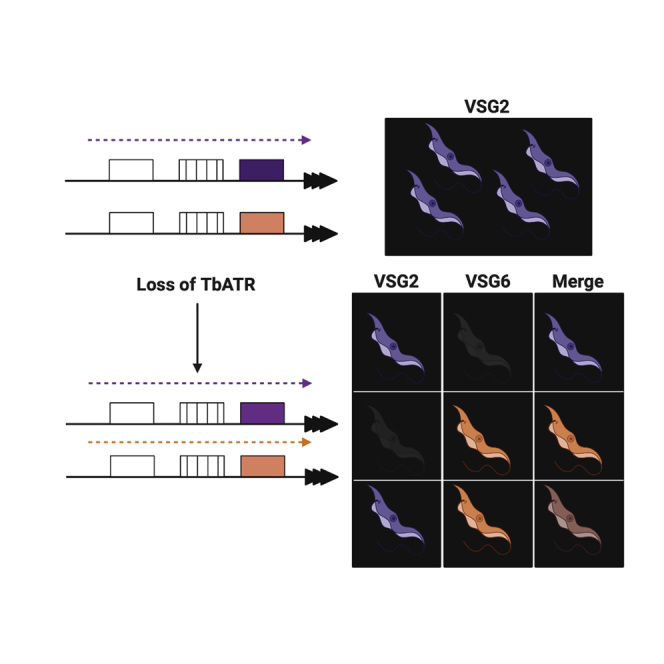
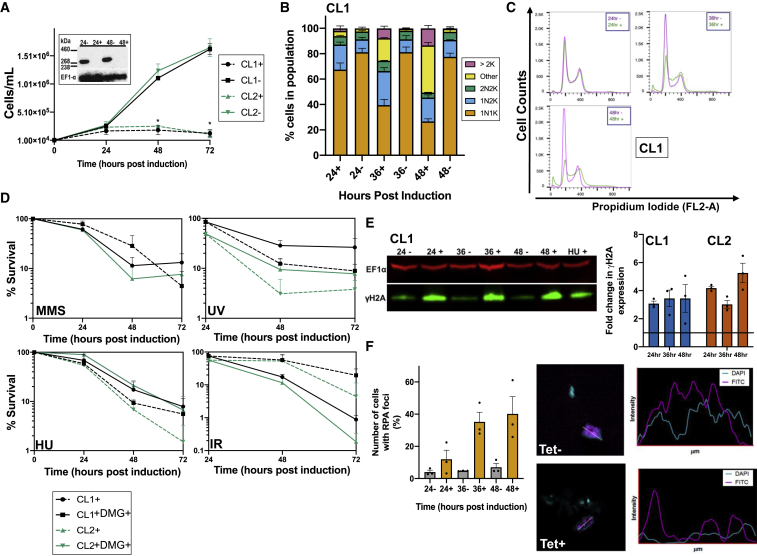
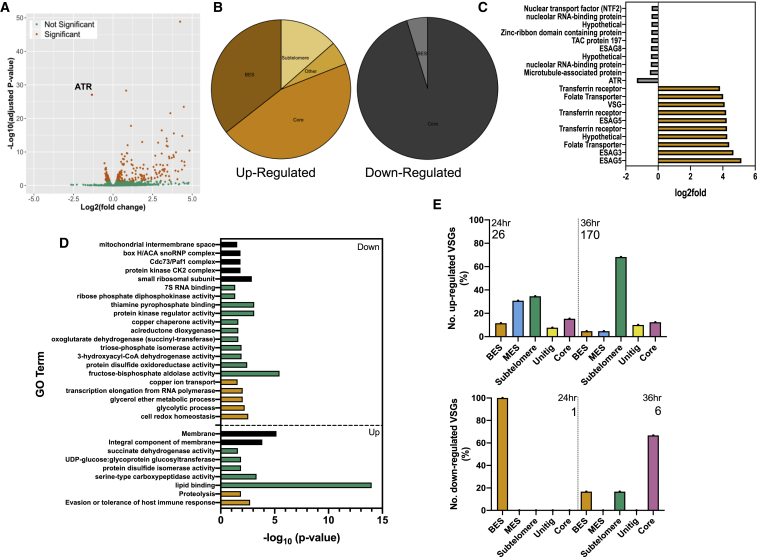
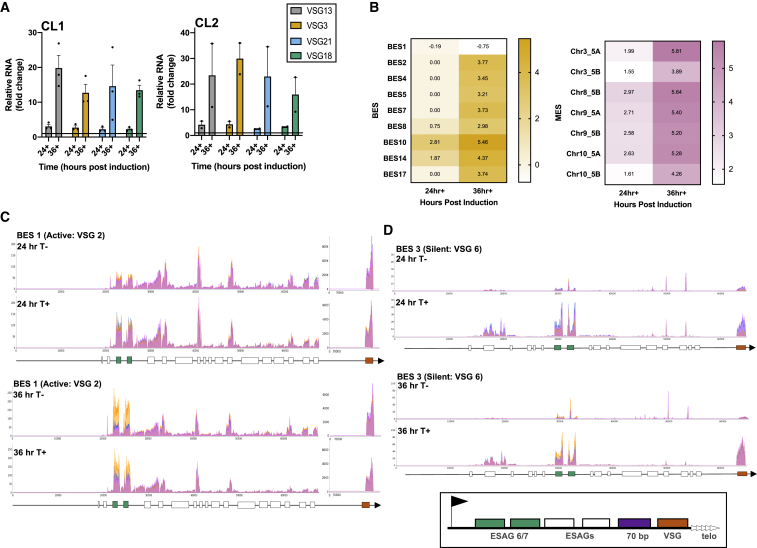
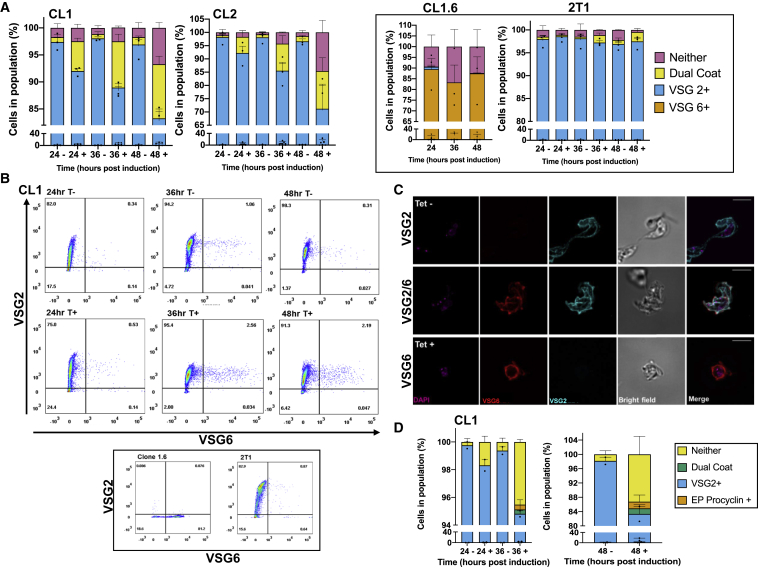
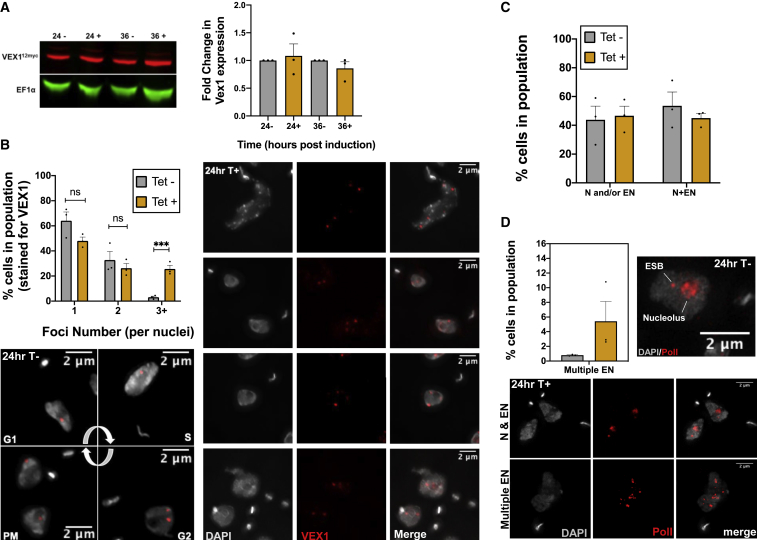
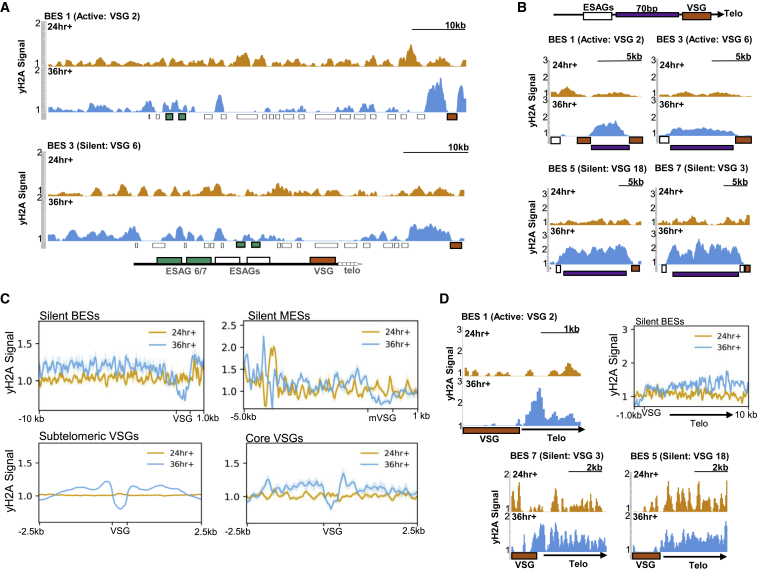
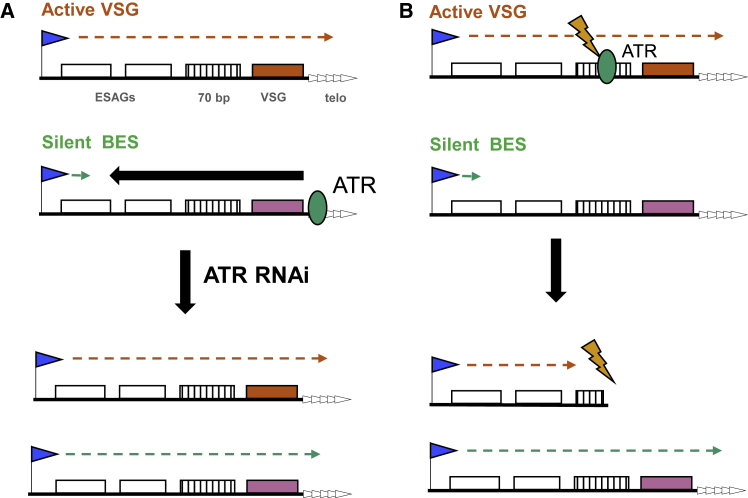
Trypanosoma brucei evades mammalian immunity by using recombination to switch its surface-expressed variant surface glycoprotein (VSG), while ensuring that only one of many subtelomeric multigene VSG expression sites are transcribed at a time. DNA repair activities have been implicated in the catalysis of VSG switching by recombination, not transcriptional control. How VSG switching is signaled to guide the appropriate reaction or to integrate switching into parasite growth is unknown. Here, we show that the loss of ATR, a DNA damage-signaling protein kinase, is lethal, causing nuclear genome instability and increased VSG switching through VSG-localized damage. Furthermore, ATR loss leads to the increased transcription of silent VSG expression sites and expression of mixed VSGs on the cell surface, effects that are associated with the altered localization of RNA polymerase I and VEX1. This work shows that ATR acts in antigenic variation both through DNA damage signaling and surface antigen expression control.

Keywords: ATR; DNA damage signaling; DNA replication stress; RNA polymerase I; Trypanosoma brucei; antigenic variation; immune evasion; monoallelic expression; protein kinase; variant surface glycoprotein.


Conflict of interest statement

Declaration of Interests The authors declare no competing interests.

Figures

None
Graphical abstract
Figure 1
Figure 1
Loss of TbATR Halts T. brucei Growth and Increases Nuclear Genome Damage (A) Growth of two clones (CL1, black; CL2, green) after TbATR RNAi induction (+, dashed lines) or when RNAi was not induced (−, solid lines). ± SEM is shown; p < 0.05, Mann-Whitney U test. Abundance of TbATR12myc in CL2 is shown (insert) after 24 or 48 h of growth with and without RNAi (+ and −, respectively); EF1α acts as a loading control. (B and C) Cell-cycle progression after RNAi monitored by DAPI staining (B) and flow cytometry (C). For DAPI, the number of cells ± SEM in each stage is displayed as a percentage of the total population; >200 cells counted per experiment. For flow cytometry, graphs depict the mode number of cells. (D) Survival of RNAi-induced (+) cells is shown as a proportion (± SEM) of uninduced cells over time in the absence (solid line) or presence (dashed line) of DNA damage (DMG) caused by methylmethanosulfonate (MMS; 0.0003%), UV radiation (UV; 1,500 J/m2), hydroxyurea (HU; 0.06 mM), and ionizing radiation (IR; 150 Gy); data are shown for CL1 (black lines) and CL2 (green lines). (E) Expression of γH2A (green) after 24, 36, or 48 h of growth with (+) and without (−) RNAi; EF1α (red) serves as a loading control, and levels are compared with 48 h of growth of uninduced cells in the presence (+) of 0.06 mM HU. The graph shows fold-change (± SEM) in the levels of γH2A in clones CL1 and CL2 after 24, 36, or 48 h of growth with RNAi relative to uninduced cells (set at 1) after normalization using the EF1α signal. (F) Quantification of the percentage (± SEM) of cells in the population that harbor RPA2-myc foci after 24, 36, or 48 h of growth with (+) and without (−) RNAi; >200 cells counted per experiment. Representative images of Tet− and Tet+ cells harboring RPA2-myc foci (magenta) are shown alongside an intensity plot of signal localization; DNA was DAPI stained (cyan).
Figure 2
Figure 2
ATR RNAi Leads to Derepression of Surface Antigen Gene Expression in Bloodstream Form T. brucei (A) A volcano plot showing differentially expressed transcripts 24 h after RNAi relative to uninduced controls. Log10-adjusted p values for each gene are plotted against the log2 transformed fold-change; data are averages from three biological replicates and transcripts are annotated as follows: significant change in abundance (orange), non-significant (green), and ATR (red). (B) Pie charts summarizing differentially expressed transcripts (left, increased; right, decreased) 24 h after RNAi; the number of genes in each category is expressed as a percentage of the total gene number, and genes were categorized based on their genomic location (core genome, BES, subtelomere, and unmapped unitigs). (C) Top 10 differentially increased (orange) or decreased (gray) transcripts following RNAi. (D) Summary of GO terms significantly enriched in the differentially expressed gene cohort relative to the expected number of genes in the genome. Enriched GO terms in the up- or downregulated cohorts are depicted as −log10 (p value) and categorized as biological process (yellow), cell location (black), and molecular process (green; see Table S1). (E) Graphs show the percentage of the total number (indicated) of significantly up-or downregulated VSGs found in BES, MES, subtelomere, unitig, or core locations 24 and 36 h post-RNAi.
Figure 3
Figure 3
Loss of TbATR Impairs Control of VSG Expression Site Transcription (A) qRT-PCR of VSGs within 4 silent BES are shown (24 and 36 h post-RNAi, +) as fold-change in level relative to uninduced cells (−; set at 1); data are shown for clones CL1 and CL2, and error bars denote ± SEM. (B) Heatmaps of differentially expressed BES and MES VSG transcripts, plotted as log2fold change in +RNAi relative to −RNAi. (C and D) RNA-seq read depth across the active BES (BES1; C) and one silent BES (BES3; D) after 24 and 36 h of growth with (T+) or without (T−) RNAi; data from three replicates are overlaid (pink, blue, and orange). ESAG6 and ESAG7 genes are shown in green, other ESAGs in white, and VSG in orange. The boxed graphic shows a simplified layout of a BES (telo, telomere; arrow, promoter).
Figure 4
Figure 4
Loss of ATR Results in Changes in VSG Coat Expression (A) VSG2 and VSG6 expression by immunofluorescence 24, 36, and 48 h after RNAi induction (+) in CL1 and CL2, or without induction (−). Individual cells were scored for the presence of just one VSG (VSG2+, cyan; VSG6+, red), both VSGs (dual coat, yellow), or neither VSG (gray); numbers are expressed as a percentage of the total population ± SEM (200 cells counted per time point per experiment). Control cell lines (CL1.6, expressing mainly VSG6, and the 2T1 parental RNAi cell line, expressing mainly VSG2) are shown in the black-outlined box. (B) Analysis of VSG2 and VSG6 expression by flow cytometry after 24, 36, and 48 h of growth with (T+) or without (T-) RNAi; >10,000 events were analyzed per sample and time point. For comparison, 2T1 and CL1.6 cells are shown. (C) Representative images of CL1 cells and + RNAi and −RNAi (Tet), stained with anti-VSG2 and anti-VSG6 antiserum; scale bars, 5 μm. (D) Expression of EP-procyclin and VSG2 24, 36, and 48 h +RNAi (+), or −RNAi (−). Individual cells were scored for the presence of VSG2 or EP-procyclin and quantified as in (B).
Figure 5
Figure 5
Altered Localization of VEX1 after ATR RNAi (A) Immunoblot of VEX1−12myc (red) expression after 24 or 36 h of growth with (+) and without (−) RNAi; EF1α (green) serves as a loading control. The graph depicts levels of VEX1−12myc protein after normalization using EF1α (set to 1.0). (B) Analysis of VEX1−12myc foci number at 24 h of growth with (Tet+, cyan bars) or without (Tet−, gray bars) RNAi. DNA was stained with DAPI and used to determine the number of individual cells harboring 1, 2, or ≥3 (3+) VEX1−12myc foci. Numbers are expressed as a percentage of the total number of cells counted (± SEM). Images show VEX1−12myc localization (red) after 24 h of growth with (T+) and without (T−) RNAi; DAPI-stained DNA is gray (scale bar, 2 μm). (C) Pol I and ESB after 24 h of growth with (Tet+) and without (Tet−) RNAi. Cells were categorized as having a single subnuclear focus, indicating either nucleolar (N) or extranucleolar staining (EN) staining (N and/or EN), or harboring two clearly distinct foci (N+EN), suggesting both a nucleolus and an ESB; values represent the percentage (± SEM, n = 3) of total cells counted (>100 per experiment). (D) Analysis of the number of cells harboring >2 extranucleolar foci (multiple EN) per single cell 24 h after RNAi (data plotted as in C). Image on the right is a representative example of Pol I (red) in an uninduced cell, while the images below show representative images of Pol I distribution following RNAi (see also Figure S5; DAPI-stained DNA is gray; scale bar, 2 μm).
Figure 6
Figure 6
TbATR Loss Results in the Accumulation of VSG-Associated Damage (A) γH2A ChIP-seq enrichment across the active BES (BES1, VSG2) and a silent BES (BES3, VSG6) after 24 (orange) and 36 h (blue) of growth with RNA induction (+). γH2A ChIP-seq signal enrichment (y axis) is shown as a ratio of reads in RNAi-induced samples relative to uninduced samples (each normalized to cognate input sample). VSG is shown as a red box, ESAG6 and ESAG7 as green boxes, and other ESAGs as white boxes. (B) Enrichment of γH2A in RNAi-induced cells relative to uninduced across the 70-bp repeats (purple box) in the active BES1 and in three silent BESs (3, 5, and 7). (C) Metaplots showing γH2A signal enrichment after RNAi across all silent BESs, silent MESs, subtelomeric VSGs, and core VSGs (in each, VSGs are scaled to 500 bp and regions up- and downstream are plotted). (D) γH2A signal enrichment after RNAi in the active BES1 and two silent BES (5 and 7) across the region extending from the end of the VSG (red) to the telomere (arrow, telo); the inset shows a metaplot of γH2A signal for all of the silent BESs across the same region.
Figure 7
Figure 7
Two Models for ATR Function in T. brucei VSG Expression (A) Transcription (green arrow) from the Pol I promoter (arrow) of a silent BES is suppressed (black arrow) by ATR (green circle) and does not traverse the ESAGs (white boxes), 70-bp repeats (hatched box), VSG (pink box), or telomere repeats (arrayed arrowheads). In contrast, TbATR does not impede the transcription (orange arrow) of the single active BES (active VSG, red box). After TbATR RNAi, silencing is compromised, and transcription can extend across the silent BES. (B) TbATR recognizes and signals the repair of lesions (orange lightning bolt) within the actively transcribed VSG BES. The loss of TbATR means that lesions are not effectively repaired and the integrity of the active BES is compromised (e.g., loss of VSG), which is lethal and selects for cells expressing a silent VSG BES.

References

    1. Afgan E., Baker D., Batut B., van den Beek M., Bouvier D., Cech M., Chilton J., Clements D., Coraor N., Grüning B.A. The Galaxy platform for accessible, reproducible and collaborative biomedical analyses: 2018 update. Nucleic Acids Res. 2018;46(W1):W537–W544. - PMC - PubMed
    1. Alexa A., Rahnenfuhrer J., Lengauer T. Improved scoring of functional groups from gene expression data by decorrelating GO graph structure. Bioinformatics. 2006;22:1600–1607. - PubMed
    1. Alsford S., Horn D. Single-locus targeting constructs for reliable regulated RNAi and transgene expression in Trypanosoma brucei. Mol. Biochem. Parasitol. 2008;161:76–79. - PMC - PubMed
    1. Alsford S., Horn D. Cell-cycle-regulated control of VSG expression site silencing by histones and histone chaperones ASF1A and CAF-1b in Trypanosoma brucei. Nucleic Acids Res. 2012;40:10150–10160. - PMC - PubMed
    1. Alsford S., Kawahara T., Glover L., Horn D. Tagging a T. brucei RRNA locus improves stable transfection efficiency and circumvents inducible expression position effects. Mol. Biochem. Parasitol. 2005;144:142–148. - PMC - PubMed

Publication types

MeSH terms

LinkOut - more resources