. 2020 Feb;578(7795):432-436.
doi: 10.1038/s41586-020-1957-x. Epub 2020 Jan 22.

Giant virus diversity and host interactions through global metagenomics

Affiliations

Giant virus diversity and host interactions through global metagenomics

Frederik Schulz et al. Nature. 2020 Feb.

Abstract

Our current knowledge about nucleocytoplasmic large DNA viruses (NCLDVs) is largely derived from viral isolates that are co-cultivated with protists and algae. Here we reconstructed 2,074 NCLDV genomes from sampling sites across the globe by building on the rapidly increasing amount of publicly available metagenome data. This led to an 11-fold increase in phylogenetic diversity and a parallel 10-fold expansion in functional diversity. Analysis of 58,023 major capsid proteins from large and giant viruses using metagenomic data revealed the global distribution patterns and cosmopolitan nature of these viruses. The discovered viral genomes encoded a wide range of proteins with putative roles in photosynthesis and diverse substrate transport processes, indicating that host reprogramming is probably a common strategy in the NCLDVs. Furthermore, inferences of horizontal gene transfer connected viral lineages to diverse eukaryotic hosts. We anticipate that the global diversity of NCLDVs that we describe here will establish giant viruses-which are associated with most major eukaryotic lineages-as important players in ecosystems across Earth's biomes.


Conflict of interest statement

The authors declare no competing interests.

Figures

Fig. 1
Fig. 1. Metagenomic expansion of the NCLDV diversity.
a, Maximum-likelihood phylogenetic tree of the NCLDV inferred from a concatenated protein alignment of five core NCVOGs. Branches in dark red represent published genomes and branches in black represent GVMAGs generated in this study. Shades of grey indicate boundaries of genus- and subfamily-level clades; previously described lineages are labelled. Tree annotations from inside to the outside: (1) superclade (SC), (2) GC content, (3) assembly size and (4) environmental origin. b, Distribution of NCLDV lineages across different habitats. The bars adjacent to the heat map show the total number of detected MCPs per habitat (facing to the right) and per lineage (facing downwards) as total count (total bar length) and corrected count on the basis of the average copy number of MCPs in the respective lineage (darker shaded bar length). The plot includes only lineages for which at least 100 MCPs could be detected. NCLDV lineages with available virus isolates are indicated in red. The turquoise dashed line indicates the total size of the metagenome assemblies that were screened in this analysis. Bars on the far right indicate, for each environment, the number of detected MCPs per assembled gigabase (Gb).
Fig. 2
Fig. 2. NCLDV coding potential and proteins that are probably involved in metabolic host reprogramming.
Copy numbers of selected Pfam domains with potential roles as light-driven proton pumps, in carbon fixation, in photosynthesis and in diverse substrate transport processes. Filled stars and circles specify observed modes of transmission of the respective Pfam-domain-containing proteins. Stars represent recent HGTs from either eukaryotes or bacteria; circles indicate vertical transmission after ancient HGT or gene birth in the NCLDV; a darker colour indicates the predominantly observed mode of transmission (five or more events). The stacked bars on the right side of the heat map show, for each observed protein domain, the proportional distribution across different habitat types. Bars on the far right indicate the total number of observations for each protein domain.
Fig. 3
Fig. 3. HGT between NCLDV and their putative eukaryotic hosts.
Undirected HGT network with nodes that represent previously described viral lineages and MGVLs, coloured on the basis of NCLDV superclade affiliation, with names above the node and their putative hosts (highlighted in black with names below the node, coloured on the basis of lifestyle); edges are weighted on the basis of the number of detected transfers. Connections comprising at least four transfers are shown. Experimentally verified virus–host associations are highlighted in yellow with names in bold. The proportion of HGT candidates assigned to hosts from different major eukaryotic lineages is shown as a pie chart.
Extended Data Fig. 1
Extended Data Fig. 1. Discovery pipeline for GVMAGs.
Approximately 46 million contigs that were longer than 5 kb and were available in IMG/M (June 2018) were screened for potential NCLDV contigs using a combination of 5,064 NCLDV-specific HMMs and a random-forest classifier based on gene density and RBS motifs. The resulting set of 1.2 million contigs was then subjected to metagenomic binning using MetaBAT2, with binning performed separately for each metagenome that contained putative NCLDV contigs. To the resulting approximately 72,000 GVMAGs, we added around 180,000 low-quality MAGs based on MIMAG that were generated by non-targeted binning of metagenomes in IMG/M. The resulting set of approximately 252,000 GVMAGs and MAGs were then filtered on the basis of assembly size and using a combination of the consensus of taxonomic affiliation of best blast hits across contigs, the presence or absence and copy numbers of frequently conserved NCLDV genes taking into account neighbouring taxa in the species tree and random-forest classifier based on gene density and RBS motifs. Outlier contigs were removed as described in the Methods and only MAGs that showed a copy-number distribution of frequently conserved NCLDV genes similar to closely related viral genomes were maintained in the final dataset.
Extended Data Fig. 2
Extended Data Fig. 2. The RBS classifier.
Unique features of NCLDV genomes and efficiency of random-forest classifiers based on these features. a, Gene density (y axis, average number of genes predicted per 10 kb of genome) for genomic sequences from different types of organisms or entities (x axis). Genomes were grouped on the basis of taxonomy (kingdom and domain ranks) as well as patterns of RBS motifs and gene density. ‘Other euk. viruses’, non-NCLDV eukaryotic viruses; ‘NCLDV Pandor.’, pandoravirus and similar NCLDVs; ‘NCLDV (Other)’, non-pandoravirus NCLDVs. Centre lines of box plots represent the median, bounds of the boxes indicate the lower and upper quartiles, whiskers extend to points that lie within 1.5× the interquartile range of the lower and upper quartiles. Sample sizes (number of genomes) are indicated. b, Frequency of RBS motifs identified across different genomes groups. RBS motif frequencies were based on prodigal gene prediction using the ‘full motif scan’ option. For clarity, only RBS motif frequencies >1% are displayed. RBS motif frequencies ≥30% are highlighted with a bold outline. ‘Other Euk. viruses’, non-NCLDV eukaryotic viruses; ‘NCLDV (pandoravirus)’, pandoravirus and similar NCLDVs; ‘NCLDV (Other)’, non-pandoravirus NCLDVs. c, Predictions of NCLDV origin on the basis of genome features and predicted RBS motifs by random-forest classifiers for complete genomes (top) and short genome fragments (bottom). Predictions for individual genomes were obtained through a tenfold cross-validation. Similar results were obtained when predicting only two classes (NCLDV and non-NCLDV, displayed here) or when predicting classes corresponding to the eight types of genomes. CPR, candidate phyla radiation; SD, Shine–Dalgarno sequence.
Extended Data Fig. 3
Extended Data Fig. 3. Features of GVMAGs.
a, Mean assembly size, GC content and coding density for each lineage in the NCLDV, coloured by superclade, individual data points are shown. Data are mean ± s.d. b, Assembly metrics of all GVMAGs compared to previously published NCLDV genomes included in this study. Centre lines of box plots represent the median, bounds of boxes indicate the lower and upper quartiles, whiskers extend to points that lie within 1.5× interquartile range of the lower and upper quartiles. Sample size for the published data is 205 genomes and for GVMAGs is 2,074 genomes.
Extended Data Fig. 4
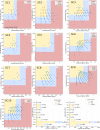
Extended Data Fig. 4. Estimated completeness and contamination of GVMAGs on the basis of the presence of conserved NCVOGs.
Scatter plots show estimated completeness and contamination for GVMAGs in each superclade (SC), previously published GVMAGs (pGVMAGs) and isolate genomes (filled circles with different colours) compared with the average of the respective superclade. Genomes in the red area were classified as low quality, genomes in the blue area were classified as medium quality and genomes in the yellow area were classified as high quality on the basis of the combination of completeness and contamination. Stacked bars (bottom right) summarize, for each NCLDV superclade, the total number of GVMAGs with low, medium and high contamination and completeness.
Extended Data Fig. 5
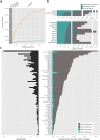
Extended Data Fig. 5. Shared and unique protein families within NCLDV lineages.
a, Collectors curve showing the increase in functional diversity estimated on the basis of the total number of protein families detected in NCLDV isolates, previously published GVMAGs and GVMAGs recovered in this study. The orange curve includes all detected protein families; the blue curve only includes protein families that included by at least two proteins. b, Top, the total number of different Pfam-A domains, total number of proteins with any Pfam-A domain and total number of proteins found in NCLDV isolates, previously published NCLDV genomes from metagenomes and GVMAGs recovered in this study. Bottom, NCLDV lineages with the greatest number of unique Pfam-A domains. c, The total number of genomes per lineage (left) and total number of protein families (at least two members) found in each lineage are indicated together with the proportion of genomes in the respective lineage that share protein families (right).
Extended Data Fig. 6
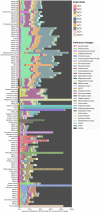
Extended Data Fig. 6. Similarity of proteins encoded in expanded NCLDV lineages and new MGVLs to known NCLDV proteins.
For each lineage the proportion of encoded proteins with homology (E-value cut-off of 1 × 10−5) to known NCLDV proteins is shown.
Extended Data Fig. 7
Extended Data Fig. 7. Distribution of NCLDV MCPs.
a, Global distribution of NCLDV MCPs. b, A detailed view of the Midwest and East Coast of the United States and Canada. Filled circles are coloured on the basis of the affiliation with superclade and the circle diameter correlates with the number of MCPs detected at the respective sampling location. Circles at the same coordinates are stacked by size with the largest circles at the bottom. The category ‘novel’ contains all MCPs that could not be assigned to any of the superclades.
Extended Data Fig. 8
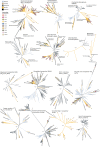
Extended Data Fig. 8. Maximum-likelihood phylogenetic trees.
Maximum-likelihood phylogenetic trees that underlie the analysis in Fig. 2. Trees were inferred using IQ-tree with the following models: Na+/Pi cotranporter, LG4M + R7; ammonium transporter, LG4M + R10; bacteriorhodopsin, LG + F + R10; bestrophin, LG4M + R5; carotenoid dioxygenase, LG + F + R10; Chlorophyll ab, LG4M + F + R10; chlorophyllase, LG + I + G4; CorA-like Mg2+ transporter, LG + F + R3; copper oxidase II, LG4M + R10; heliorhodopsin, LG4M + R9; magnesium transporter NIPA, LG4M + R6; ferric reductase, LG + F + R9; phosphate transporter, LG4M + R10; Rubisco, LG4M + R6; and vacuolar iron transporter (VIT1), LG4M + R10.
Extended Data Fig. 9
Extended Data Fig. 9. Diversity of metagenomic rhodopsins.
Maximum-likelihood tree (IQ-tree, LG4M + R10 substitution model) of rhodopsins after dereplication through clustering with CD-hit at a 70% similarity threshold. Clades that predominantly include rhodopsins of archaeal, bacterial, eukaryotic or NCLDV origin are highlighted in the different colours. Yellow filled circles indicate NCLDV rhodopsins that have probably been acquired from cellular organisms through HGT.

Comment in

References

    1. Abergel C, Legendre M, Claverie J-M. The rapidly expanding universe of giant viruses: mimivirus, pandoravirus, pithovirus and mollivirus. FEMS Microbiol. Rev. 2015;39:779–796. - PubMed
    1. Koonin EV, Yutin N. Evolution of the large nucleocytoplasmic DNA viruses of eukaryotes and convergent origins of viral gigantism. Adv. Virus Res. 2019;103:167–202. - PubMed
    1. Abrahão J, et al. Tailed giant Tupanvirus possesses the most complete translational apparatus of the known virosphere. Nat. Commun. 2018;9:749. - PMC - PubMed
    1. Fischer MG. Giant viruses come of age. Curr. Opin. Microbiol. 2016;31:50–57. - PubMed
    1. Mihara T, et al. Taxon richness of “Megaviridae” exceeds those of Bacteria and Archaea in the ocean. Microbes Environ. 2018;33:162–171. - PMC - PubMed

Substances