

Circulating Ionized Magnesium: Comparisons with Circulating Total Magnesium and the Response to Magnesium Supplementation in a Randomized Controlled Trial
- PMID: 31968571
- PMCID: PMC7019442
- DOI: 10.3390/nu12010263
Circulating Ionized Magnesium: Comparisons with Circulating Total Magnesium and the Response to Magnesium Supplementation in a Randomized Controlled Trial
Abstract
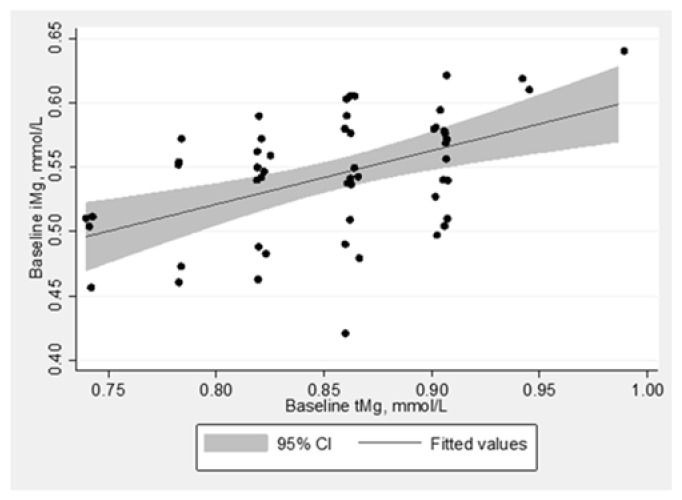
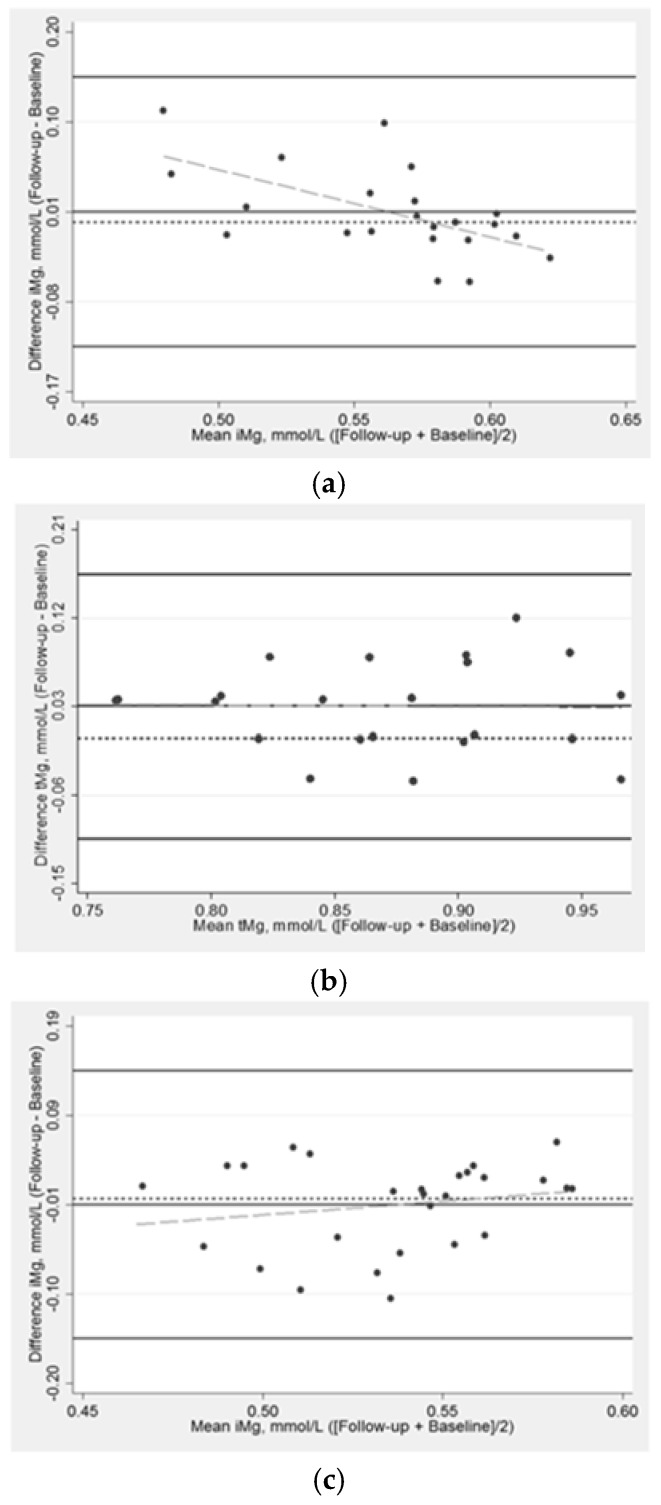
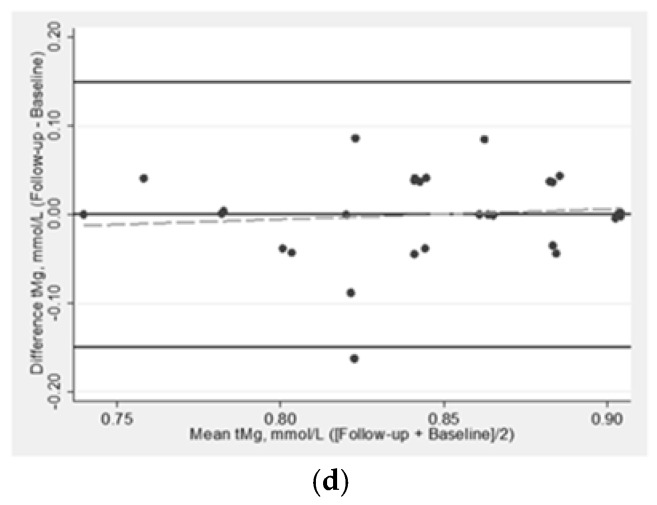
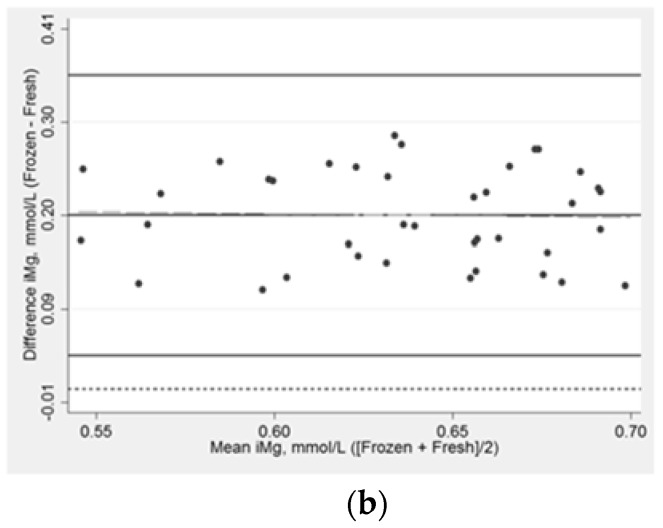
Ionized Mg (iMg) is considered the biologically active fraction of circulating total Mg (tMg). It is possible that iMg may be a more physiologically relevant marker than tMg. Using data from a double-blind pilot randomized controlled trial, we tested (1) whether oral Mg supplementation will increase iMg concentrations compared with placebo and (2) the relationship between iMg and tMg at baseline. Additionally, we evaluated the agreement between iMg measured in fresh whole blood versus stored samples. A total of fifty-nine participants were randomized 1:1 to oral Mg supplementation (400 mg/day, Mg Oxide) or placebo for 10 weeks. Fasting blood samples were obtained at baseline and follow-up. The analysis used linear regression and an intent-to-treat approach. Participants were generally healthy, the mean age was 62, and 73% were female. The baseline iMg and tMg were modestly and positively associated (r = 0.50). The ratio of baseline iMg to tMg was 64%. The mean supplement effect on iMg was 0.03 mmol/L (95% CI:0.01, 0.05) for Mg supplementation versus placebo. The supplement effect on iMg was not statistically significantly different according to baseline iMg status (above/below median). Compared to fresh blood, iMg was consistently higher in refrigerated and frozen samples by 0.14 and 0.20 mmol/L, respectively. In this relatively healthy adult population, Mg supplementation over 10 weeks resulted in increased iMg concentrations. Whether iMg is a more appropriate measure of Mg status than tMg, and the public health or clinical utility of measuring iMg remains to be determined.
Keywords: ionized magnesium; magnesium supplement; nutritional epidemiology; randomized controlled trial; total magnesium.
Conflict of interest statement
The authors declare no conflict of interest. The funders had no role in the design of the study; in the collection, analyses, or interpretation of data; in the writing of the manuscript, or in the decision to publish the results.
Figures
Similar articles
-
Circulating Ionized Magnesium as a Measure of Supplement Bioavailability: Results from a Pilot Study for Randomized Clinical Trial.Nutrients. 2020 Apr 28;12(5):1245. doi: 10.3390/nu12051245. Nutrients. 2020. PMID: 32353962 Free PMC article. Clinical Trial.
-
Ionized Magnesium Correlates With Total Blood Magnesium in Pediatric Patients Following Kidney Transplant.Ann Lab Med. 2024 Jan 1;44(1):21-28. doi: 10.3343/alm.2024.44.1.21. Epub 2023 Sep 4. Ann Lab Med. 2024. PMID: 37665282 Free PMC article.
-
Total serum and ionized magnesium concentrations in healthy and hospitalized dogs.J Vet Emerg Crit Care (San Antonio). 2023 Jul-Aug;33(4):427-434. doi: 10.1111/vec.13302. Epub 2023 Jun 6. J Vet Emerg Crit Care (San Antonio). 2023. PMID: 37282363
-
Serum ionized magnesium in chronic alcoholism: is it really decreased?Clin Chem. 1997 Feb;43(2):394-9. Clin Chem. 1997. PMID: 9023146
-
Systematic Review and Meta-Analysis to Estimate a Reference Range for Circulating Ionized Magnesium Concentrations in Adult Populations.J Nutr. 2023 Dec;153(12):3458-3471. doi: 10.1016/j.tjnut.2023.10.006. Epub 2023 Oct 14. J Nutr. 2023. PMID: 37844840
Cited by
-
Dysmagnesemia in the ICU: A Comparative Analysis of Ionized and Total Magnesium Levels and Their Clinical Associations.Metabolites. 2025 Jul 24;15(8):498. doi: 10.3390/metabo15080498. Metabolites. 2025. PMID: 40863117 Free PMC article.
-
Nuclear Magnetic Resonance-Measured Ionized Magnesium Is Inversely Associated with Type 2 Diabetes in the Insulin Resistance Atherosclerosis Study.Nutrients. 2022 Apr 25;14(9):1792. doi: 10.3390/nu14091792. Nutrients. 2022. PMID: 35565760 Free PMC article.
-
Clinical trial on the effects of oral magnesium supplementation in stable-phase COPD patients.Aging Clin Exp Res. 2022 Jan;34(1):167-174. doi: 10.1007/s40520-021-01921-z. Epub 2021 Jul 14. Aging Clin Exp Res. 2022. PMID: 34260036 Free PMC article. Clinical Trial.
-
Magnesium Deficiency and Cardiometabolic Disease.Nutrients. 2023 May 17;15(10):2355. doi: 10.3390/nu15102355. Nutrients. 2023. PMID: 37242238 Free PMC article. Review.
-
Prevalence, clinical characteristics, and health outcomes of dysmagnesemia measured by ionized and total body concentrations among medically hospitalized patients.Sci Rep. 2024 Oct 10;14(1):23668. doi: 10.1038/s41598-024-74920-5. Sci Rep. 2024. PMID: 39390055 Free PMC article.
References
-
- Bryrd-Bredbenner C., Moe G., Berning J., Kelley D. Wardlaws Perspectives in Nutrition Updated with 2015 2020 Dietary Guidelines for Americans. 10th ed. McGraw-Hill Education; New York, NY, USA: 2016.
-
- Institute of Medicine Standing Committee on the Scientific Evaluation of Dietary Reference Intakes . Dietary Reference Intakes for Calcium, Phosphorus, Magnesium, Vitamin, D., and Fluoride. National Academy of Sciences; Washington, DC, USA: 1997.
Publication types
MeSH terms
Substances
Grants and funding
LinkOut - more resources
Full Text Sources
Medical
