. 2020 Mar 31;94(8):e01898-19.
doi: 10.1128/JVI.01898-19. Print 2020 Mar 31.

P3N-PIPO Interacts with P3 via the Shared N-Terminal Domain To Recruit Viral Replication Vesicles for Cell-to-Cell Movement

Affiliations

P3N-PIPO Interacts with P3 via the Shared N-Terminal Domain To Recruit Viral Replication Vesicles for Cell-to-Cell Movement

Mengzhu Chai et al. J Virol. .

Abstract

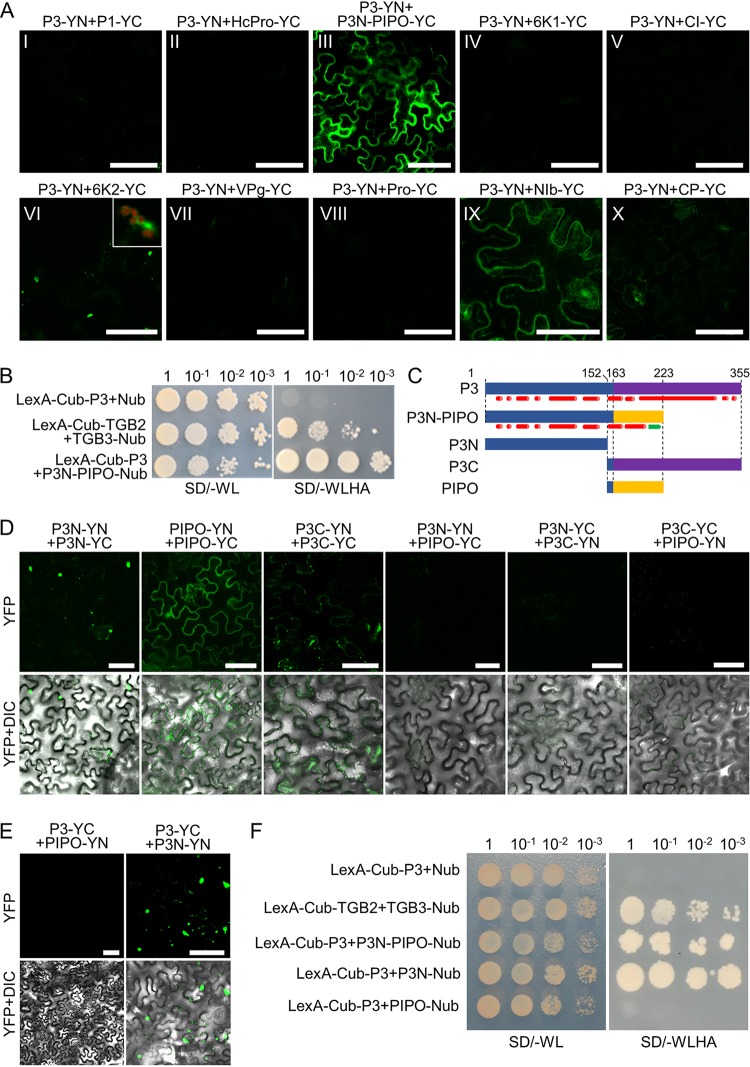
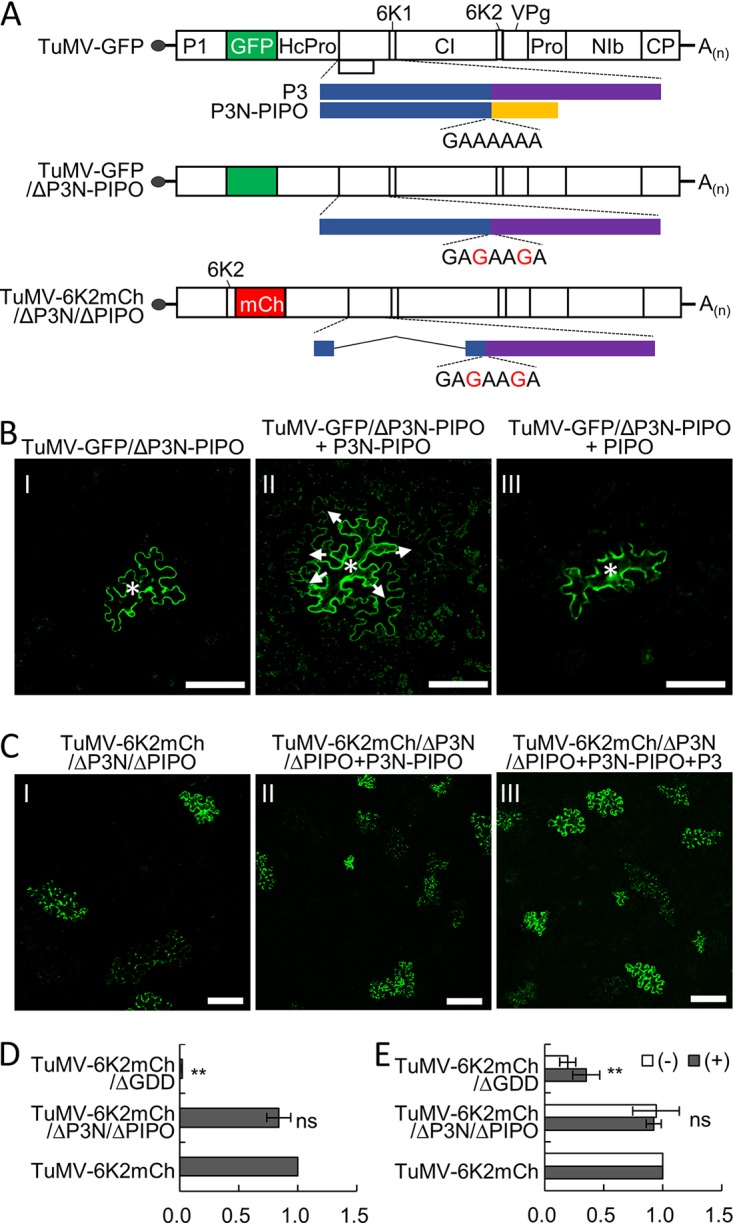
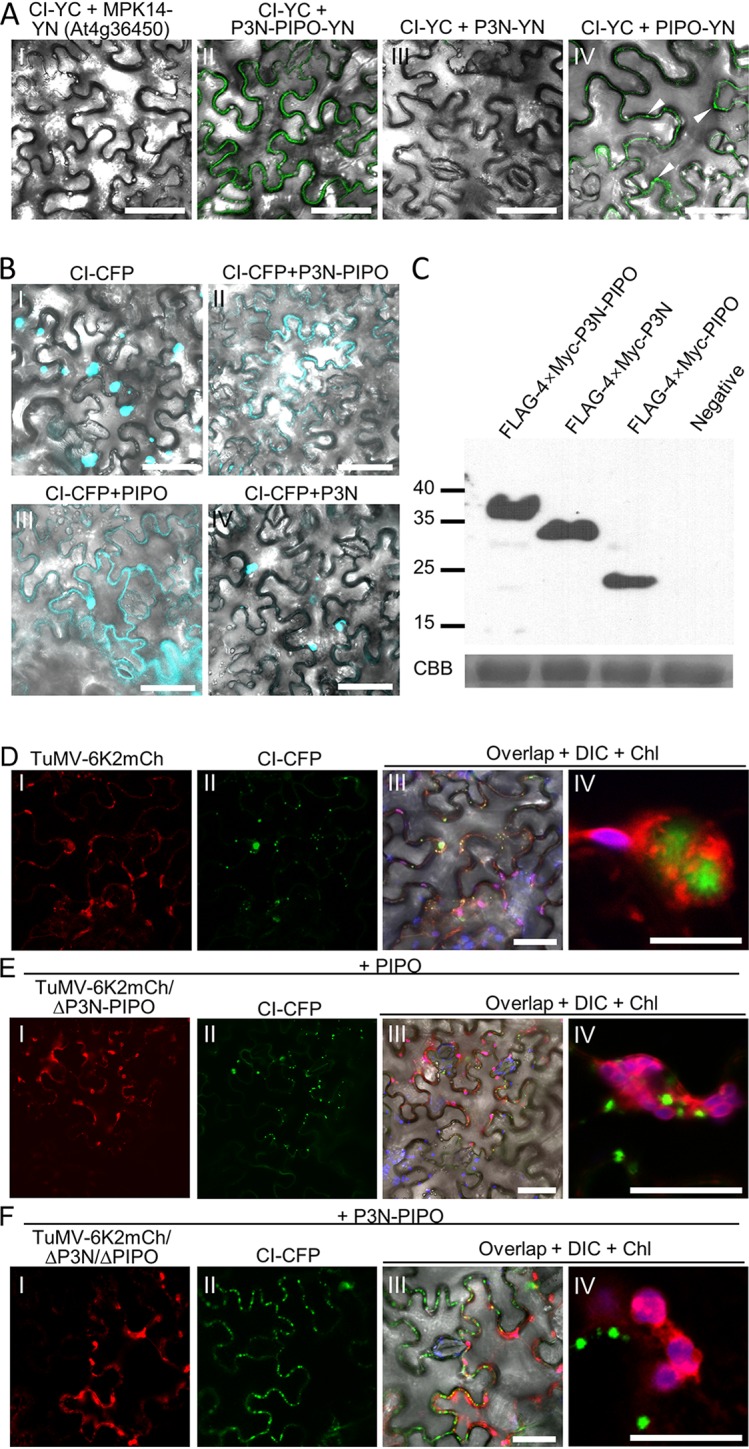
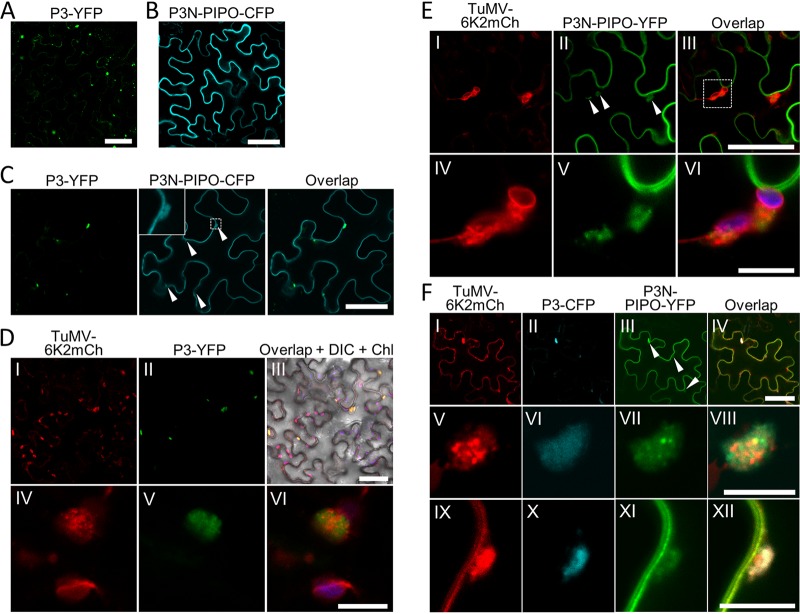
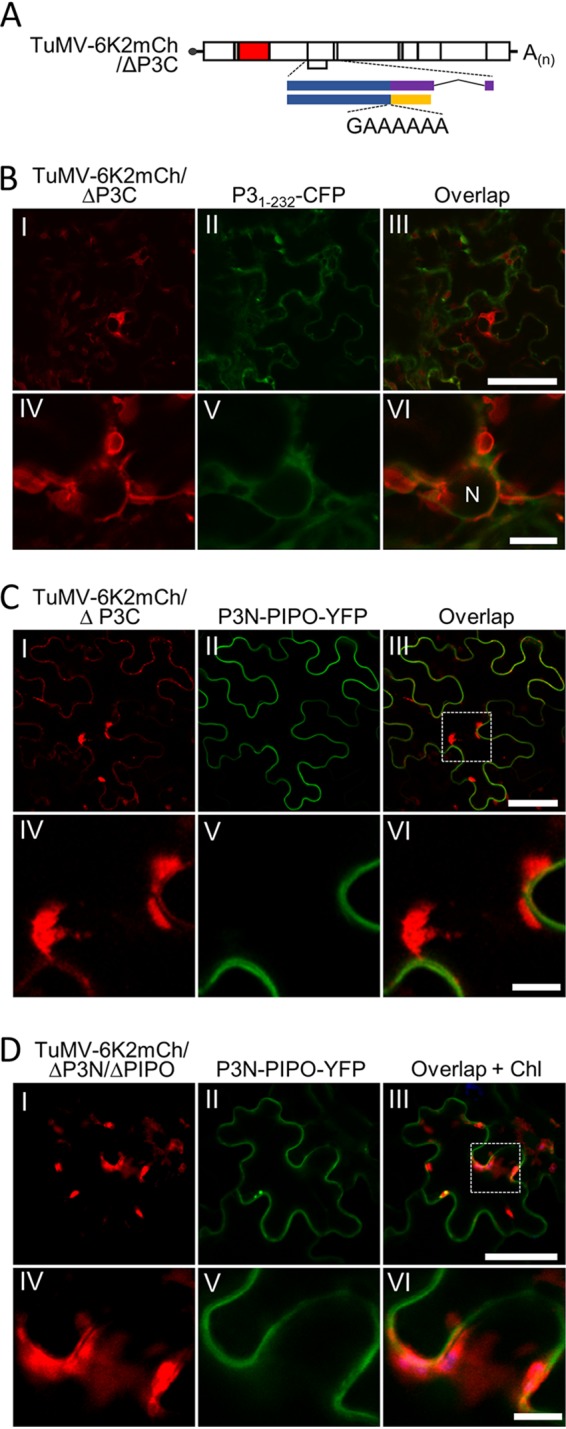
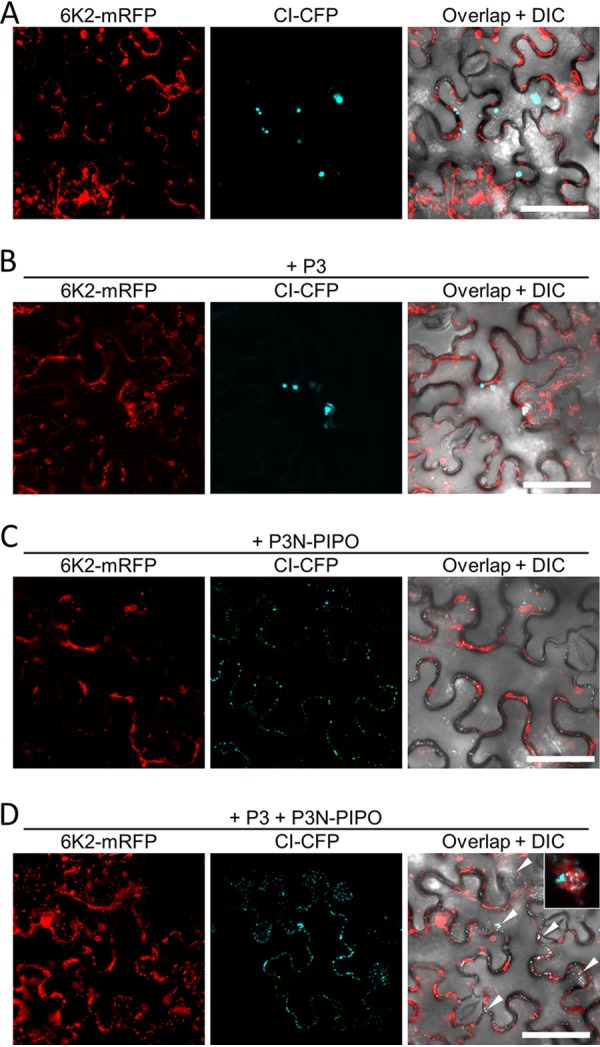
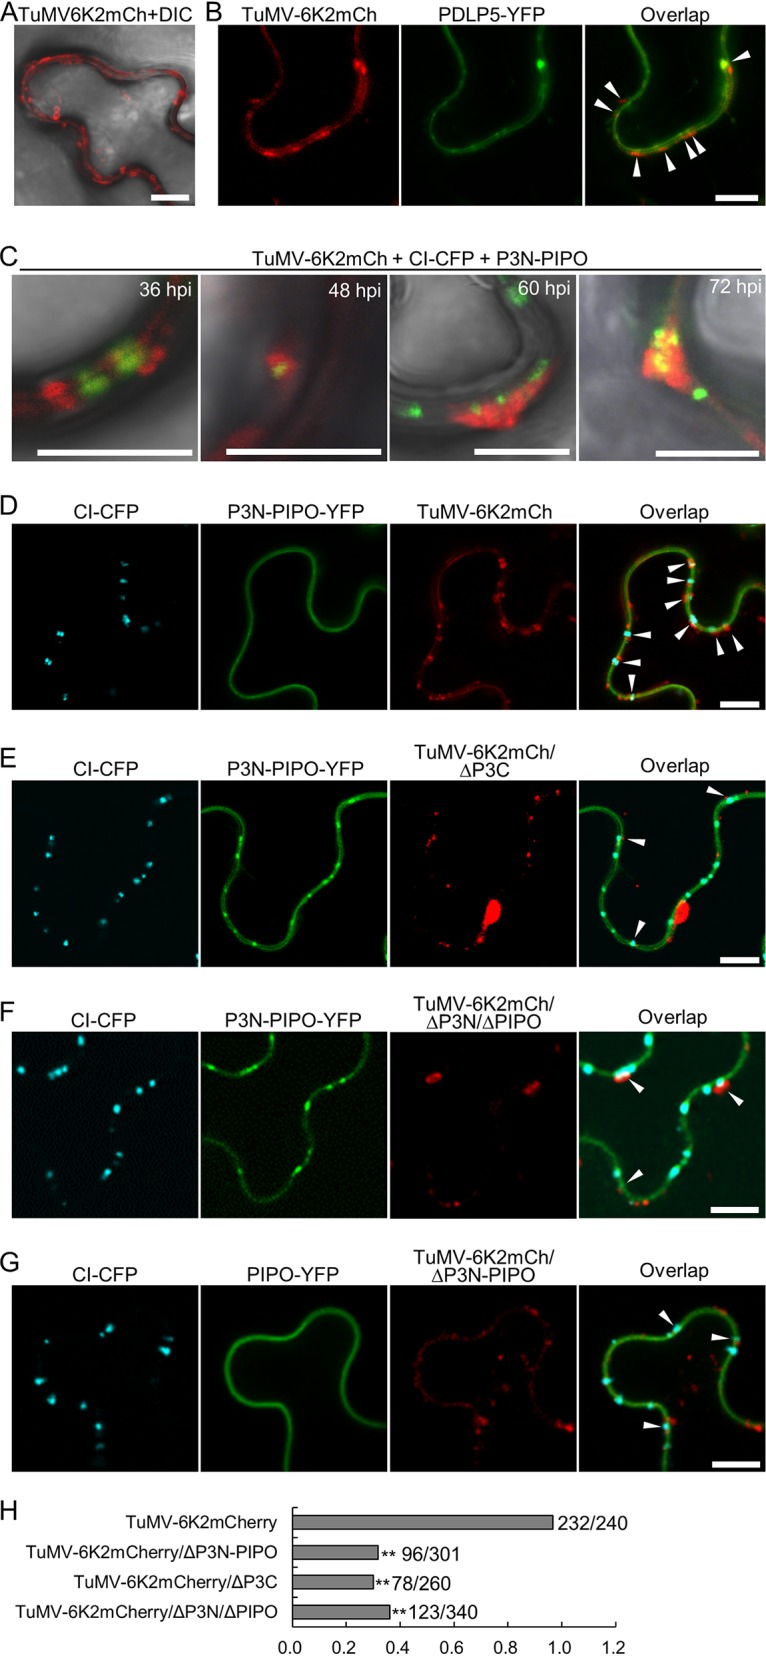
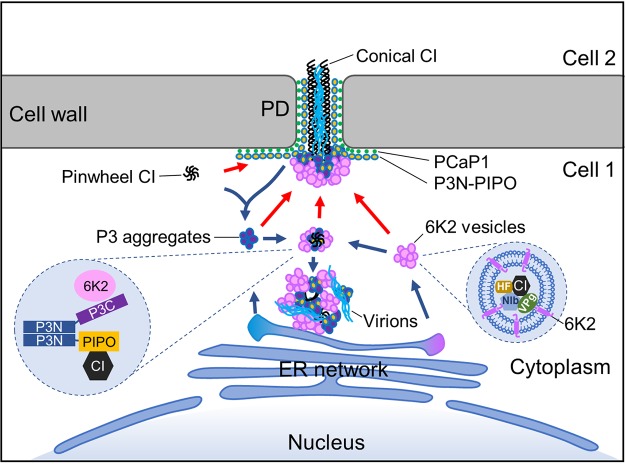
P3N-PIPO, the only dedicated movement protein (MP) of potyviruses, directs cylindrical inclusion (CI) protein from the cytoplasm to the plasmodesma (PD), where CI forms conical structures for intercellular movement. To better understand potyviral cell-to-cell movement, we further characterized P3N-PIPO using Turnip mosaic virus (TuMV) as a model virus. We found that P3N-PIPO interacts with P3 via the shared P3N domain and that TuMV mutants lacking the P3N domain of either P3N-PIPO or P3 are defective in cell-to-cell movement. Moreover, we found that the PIPO domain of P3N-PIPO is sufficient to direct CI to the PD, whereas the P3N domain is necessary for localization of P3N-PIPO to 6K2-labeled vesicles or aggregates. Finally, we discovered that the interaction between P3 and P3N-PIPO is essential for the recruitment of CI to cytoplasmic 6K2-containing structures and the association of 6K2-containing structures with PD-located CI inclusions. These data suggest that both P3N and PIPO domains are indispensable for potyviral cell-to-cell movement and that the 6K2 vesicles in proximity to PDs resulting from multipartite interactions among 6K2, P3, P3N-PIPO, and CI may also play an essential role in this process.IMPORTANCE Potyviruses include numerous economically important viruses that represent approximately 30% of known plant viruses. However, there is still limited information about the mechanism of potyviral cell-to-cell movement. Here, we show that P3N-PIPO interacts with and recruits CI to the PD via the PIPO domain and interacts with P3 via the shared P3N domain. We further report that the interaction of P3N-PIPO and P3 is associated with 6K2 vesicles and brings the 6K2 vesicles into proximity with PD-located CI structures. These results support the notion that the replication and cell-to-cell movement of potyviruses are processes coupled by anchoring viral replication complexes at the entrance of PDs, which greatly increase our knowledge of the intercellular movement of potyviruses.

Keywords: 6K2; CI; P3; P3N-PIPO; cell-to-cell movement; potyvirus; replication.


Figures

FIG 1
FIG 1
P3N-PIPO interacts with P3 via the shared P3N domain. (A) BiFC assay for protein-protein interactions between P3 and 10 other TuMV-encoded proteins. Micrographs were obtained at 48 hpi using the same parameters. The chloroplast fluorescence is included in the inset in frame VI to show the typical localization of the YFP signal from the interaction between P3 and 6K2. Scale bars = 50 μm. (B) MYTH assay for protein-protein interaction between P3N-PIPO and P3. PVX TGB2 and TGB3 were used as positive controls. (C) Schematic representations of the P3N-PIPO and P3 domains. The numbers represent the amino acid positions of the domain boundaries, and the predicted protein secondary structures of P3 and P3N PIPO are indicated below each protein. The predicted α-helixes and β-sheets are shown as red cylinders and green arrows, respectively. (D) BiFC assay for protein-protein interactions among the P3N, P3C, and PIPO domains. Differential interference contrast (DIC) channels are included to show the cell outlines. Micrographs were obtained at 48 hpi using the same parameters. Scale bars = 50 μm. (E) BiFC for protein-protein interactions between P3 and PIPO or P3N in N. benthamiana epidermal cells at 48 hpi. DIC channels are included to show the cell outlines. Scale bars = 50 μm. (F) MYTH assays for protein-protein interactions among P3N, P3C, and PIPO.
FIG 2
FIG 2
Cell-to-cell movement complementation assays. (A) Schematic representations of TuMV-GFP, TuMV-GFP/ΔP3N-PIPO, and TuMV-6K2mCh/ΔP3N/ΔPIPO. White boxes indicate the polyprotein cleavage products and the green and red boxes indicate GFP and mCherry (mCh) reporters, respectively. The polymerase spillage motif (5′-GAAAAAA-3′) or its mutations at the 5′ end of the PIPO ORF are also indicated. (B and C) The P3N domain of both P3 and P3N-PIPO is essential for cell-to-cell movement. Agrobacterium cultures harboring TuMV-GFP/ΔP3N-PIPO or TuMV-6K2mCh/ΔP3N/ΔPIPO were infiltrated at an OD600 value of 0.001, and Agrobacterium cultures harboring P3N-PIPO, PIPO, or P3 were infiltrated at an OD600 value of 0.2. The white asterisks and white arrows indicate the original and secondary infection cells, respectively, in panel B. Note that the fluorescence from 6K2-mCherry was pseudocolored into green for clarity in panel C. All micrographs were taken at 3 dpi with the same parameters. Scale bars = 50 μm. (D) Quantitative RT-PCR analyses of the genomic RNA levels of TuMV-6K2mCh and its mutants in N. benthamiana leaves at 36 hpi. The accumulation of TuMV-6K2mCh genomic RNA was linearized to 1, and the N. benthamiana actin II gene was used as the internal control. **, P < 0.01 (Student’s t test). ns, no significant difference. (E) Quantitative RT-PCR analyses of the genomic RNA levels of TuMV-6K2mCh and its mutants in N. benthamiana protoplasts at 36 hpi. The positive-sense and negative-sense genomic RNAs of TuMV-6K2mCh were linearized to 1, and the N. benthamiana actin II gene was used as an internal control. **, P < 0.01 (Student’s t test).
FIG 3
FIG 3
The PIPO domain is sufficient for redirecting CI to PDs. (A) BiFC assay for protein-protein interactions between CI and P3N-PIPO, P3N, or PIPO. Micrographs were obtained at 48 hpi using the same parameters. The DIC channels are included to show cell outlines. The fluorescent foci from the interaction between CI-YC and PIPO-YN are indicated by white arrowheads. Scale bars = 50 μm. (B) Influence of P3N-PIPO, P3N, and PIPO on the subcellular localization of CI-CFP in N. benthamiana epidermal cells at 48 hpi. The DIC channels are included to show cell outlines. Scale bars = 50 μm. (C) Immunoblotting analyses of transiently expressed P3N-PIPO, P3N, and PIPO in panel A using polyclonal antibodies against the Myc tag. At the bottom is a parallel gel stained with Coomassie brilliant blue R-250 (CBB) to show the equal loading of protein samples. Numbers at the left are molecular masses, in kilodaltons. (D to F) In vivo visualization of CI-CFP in N. benthamiana epidermal cells infected by wild-type TuMV-6K2mCh (D), TuMV-6K2mCh/ΔP3N-PIPO (E), or TuMV-6K2mCh/ΔP3N/ΔPIPO (F) at 60 hpi. Nonfluorescent PIPO and P3N-PIPO were coinfiltrated with TuMV-6K2mCh/ΔP3N-PIPO and TuMV-6K2mCh/ΔP3N/ΔPIPO, respectively. The DIC is included in frame III to show the edge of cells, and chloroplast (Chl) fluorescence is included in frames III and IV to distinguish 6K-induced aggregates. Scale bars = 50 (frames I to III) and 10 (frame IV) μm.
FIG 4
FIG 4
P3 redirects P3N-PIPO to 6K2-induced aggregates. (A and B) Subcellular localization of transiently expressed P3-YFP (A) and P3N-PIPO-CFP (B) in N. benthamiana epidermal cells at 48 hpi. Scale bars = 50 μm. (C) Colocalization of P3-YFP and P3N-PIPO-CFP in N. benthamiana epidermal cells at 48 hpi. White arrowheads indicate the cytoplasmic P3N-PIPO molecules that are colocalized with P3. The inset in the middle image is the enlargement of the dashed area to show the typical cytoplasmic P3N-PIPO. Scale bars = 50 μm. (D) Localization of P3-YFP in TuMV-6K2mCh-infected N. benthamiana epidermal cells at 60 hpi. The DIC channel and chloroplast fluorescence are included in frame III to show the cell boundaries. Frames IV to VI represent a typical 6K2-P3 aggregate. Scale bars = 50 (frames I to III) and 10 (frame IV to VI) μm. (E) Localization of P3N-PIPO-YFP in TuMV-6K2mCh-infected N. benthamiana epidermal cells at 60 hpi. White arrowheads indicate the cytoplasmic P3N-PIPO molecules that are colocalized with 6K2 aggregates. Frames IV to VI are enlargements of the dashed area in frame III. The chloroplast fluorescence (purple) is included in frame VI. Scale bars = 50 (frames I to III) and 10 (frames IV to VI) μm. (F) Localization of P3-CFP and P3N-PIPO-YFP during the infection of TuMV-6K2mCh in N. benthamiana epidermal cells at 60 hpi. White arrowheads indicate the cytoplasmic P3N-PIPO molecules that are colocalized with P3 and 6K2 aggregates. Frames IV to XII represent typical 6K2-P3N-PIPO-P3 aggregates in the cytoplasm (frames V to VIII) or at the cell periphery (frames IX to XII). Scale bars = 50 (frames I to IV) and 10 (frames V to XII) μm.
FIG 5
FIG 5
The recruitment of P3N-PIPO to 6K2-induced aggregates is dependent on P3. (A) Schematic representation of TuMV-6K2mCh/ΔP3C. (B) Localization of P31-232-CFP in TuMV-6K2mCh/ΔP3C-infected N. benthamiana epidermal cells at 60 hpi. N, nucleus. Scale bars = 50 (frames I to III) and 10 (frames IV to VI) μm. (C and D) Localization of P3N-PIPO-YFP during the infection with TuMV-6K2mCh/ΔP3C (C) or TuMV-6K2mCh/ΔP3N/ΔPIPO (D) in N. benthamiana epidermal cells at 60 hpi. The dashed areas in frame III of panels B and C are enlarged in frames IV to VI. Scale bars = 50 (frames I to III) and 10 (frames IV to VI) μm.
FIG 6
FIG 6
Recruitment of CI to 6K2-containing aggregates by P3N-PIPO and P3. (A to D) Subcellular localization of transiently expressed CI-CFP and 6K2-mREP in the absence of other viral proteins (A) or in the presence of P3 (B), P3N-PIPO (C), or P3 and P3N-PIPO (D) in N. benthamiana epidermal cells at 48 hpi. White arrowheads in panel D indicate the cytoplasmic 6K2-labeled vesicles or aggregates that contain CI inclusions. A typical cytoplasmic 6K2-labeled aggregate containing CI inclusions is shown in the inset of panel D. All scale bars = 50 μm.
FIG 7
FIG 7
Anchoring of 6K2 vesicles at PDs is dependent on P3N-PIPO and P3. (A) Distribution of 6K2 vesicles in the TuMV-6K2mCh-infected N. benthamiana epidermal cell periphery at 60 hpi. The DIC channels are included to show cell outlines. Scale bars = 10 μm. (B) Subcellular localization of peripheral 6K2 vesicles and PDLP5-YFP in TuMV-6K2mCh-infected N. benthamiana epidermal cells. Micrographs were taken at 60 hpi. White arrowheads indicate PDLP5-labeled PDs that associated with 6K2 vesicles. All scale bars = 10 μm. (C) Accumulation of 6K2 aggregates at PD-located CI inclusions at different time points during TuMV infection. At an early infection stage (36 hpi), only small 6K2 vesicles were found to be associated with PD-located CI inclusions, which gradually expanded into large irregularly shaped aggregations from 48 to 72 hpi. Scale bars = 10 μm. (D to G) Distribution of 6K2-induced vesicles at PD-located CI inclusions in N. benthamiana epidermal cells infected with TuMV-6K2mCh (D), TuMV-6K2mCh/ΔP3C (E), TuMV-6K2mCh/ΔP3N/ΔPIPO (F), or TuMV-6K2mCh/ΔP3N-PIPO (G). The 6K2-labeled vesicles in proximity to the PD-located CI inclusions are indicated by white arrowheads. Micrographs were taken at 60 hpi. Scale bars = 10 μm. (H) Statistical analyses of the percentage of PD-located CI associated with 6K2-labeled vesicles in TuMV-6K2mCh-, TuMV-6K2mCh/ΔP3C-, TuMV-6K2mCh/ΔP3N/ΔPIPO-, and TuMV-6K2mCh/ΔP3N-PIPO-infected N. benthamiana epidermal cells. The numbers at the right indicate the number of conical CI inclusions associated with 6K2 vesicles per the total number of CI inclusions analyzed. **, P < 0.01 (Student’s t test).
FIG 8
FIG 8
Schematic model of the cell-to-cell movement of TuMV. CI, P3N-PIPO, P3, 6K2, virions, PCaP1, VPg, NIb, and host factor (HF) are depicted in black pinwheels or hexagons, yellow spheres with blue margins, purple spheres with blue margins, pink spheres or cylinder, cyan lines, green dots, a dark green oval, a blue pentagon, and a yellow podetium, respectively. The red and dark blue arrows indicate the possible routes for assembling PD-located and cytoplasmic virus-induced CI/P3N-PIPO/P3/6K2 complexes, respectively. The two dashed areas show the interaction network between 6K2, P3, P3N-PIPO, and CI and a typical replicative 6K2 vesicle, respectively. The nucleus, cytoplasm, cell wall, endoplasmic reticulum (ER) network, and PD are also indicated. Note that all elements are not drawn in scale.

Similar articles

Cited by

References

    1. Sieczkarski SB, Whittaker GR. 2002. Dissecting virus entry via endocytosis. J Gen Virol 83:1535–1545. doi:10.1099/0022-1317-83-7-1535. - DOI - PubMed
    1. Schoelz JE, Harries PA, Nelson RS. 2011. Intracellular transport of plant viruses: finding the door out of the cell. Mol Plant 4:813–831. doi:10.1093/mp/ssr070. - DOI - PMC - PubMed
    1. Kumar D, Kumar R, Hyun TK, Kim JY. 2015. Cell-to-cell movement of viruses via plasmodesmata. J Plant Res 128:37–47. doi:10.1007/s10265-014-0683-6. - DOI - PubMed
    1. Heinlein M. 2015. Plant virus replication and movement. Virology 479-480:657–671. doi:10.1016/j.virol.2015.01.025. - DOI - PubMed
    1. Liu C, Nelson RS. 2013. The cell biology of Tobacco mosaic virus replication and movement. Front Plant Sci 4:12. doi:10.3389/fpls.2013.00012. - DOI - PMC - PubMed

Publication types

Supplementary concepts