. 2020 Jan 22;12(527):eaax3772.
doi: 10.1126/scitranslmed.aax3772.

PI4KIIIβ is a therapeutic target in chromosome 1q-amplified lung adenocarcinoma

Affiliations

PI4KIIIβ is a therapeutic target in chromosome 1q-amplified lung adenocarcinoma

Xiaochao Tan et al. Sci Transl Med. .

Abstract

Heightened secretion of protumorigenic effector proteins is a feature of malignant cells. Yet, the molecular underpinnings and therapeutic implications of this feature remain unclear. Here, we identify a chromosome 1q region that is frequently amplified in diverse cancer types and encodes multiple regulators of secretory vesicle biogenesis and trafficking, including the Golgi-dedicated enzyme phosphatidylinositol (PI)-4-kinase IIIβ (PI4KIIIβ). Molecular, biochemical, and cell biological studies show that PI4KIIIβ-derived PI-4-phosphate (PI4P) synthesis enhances secretion and accelerates lung adenocarcinoma progression by activating Golgi phosphoprotein 3 (GOLPH3)-dependent vesicular release from the Golgi. PI4KIIIβ-dependent secreted factors maintain 1q-amplified cancer cell survival and influence prometastatic processes in the tumor microenvironment. Disruption of this functional circuitry in 1q-amplified cancer cells with selective PI4KIIIβ antagonists induces apoptosis and suppresses tumor growth and metastasis. These results support a model in which chromosome 1q amplifications create a dependency on PI4KIIIβ-dependent secretion for cancer cell survival and tumor progression.


Conflict of interest statement

Competing interest: D.L.G. serves on scientific advisory committees for Astrazeneca, GlaxoSmithKline, Sanofi and Janssen, provides consults for Ribon Therapeutics, and has research support from Janssen, Takeda, and Astrazeneca. P.H.B. owns stock in GeneTex (<1% of total stock) and has research support from Breast Cancer Research Foundation. I.I.W. serves on advisory boards for Genentech/Roche, Bristol-Myers Squibb, Medscape, Astra Zeneca/Medimmune, HTG Molecular, Merck, GlaxoSmithKline, and MSD and receives research support from Genentech, Oncoplex, HTG Molecular, DepArray, Merck, Bristol-Myers Squibb, Medimmune, Adaptive, Adaptimmune, EMD Serono, Pfizer, Takeda, Amgen, Karus, Johnson & Johnson, Bayer, 4D, Novartis, and Perkin-Elmer (Akoya). J.M.K. has received consulting fees from Halozyme. P.H.B. was a paid Scientific Advisory Board member for Susan G. Komen in 2017. In this role he helped set the research priorities for this breast cancer foundation. This activity is unrelated to the current study. All other authors declare that they have no competing interests.

Figures

Figure 1.
Figure 1.
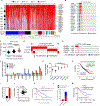
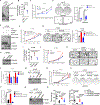
A chromosome 1q region encoding multiple Golgi-related genes is amplified in cancer. (A) Heat map of copy number alterations in 1,038 genes (rows) in 1q21.3-amplified cancers (n=541, columns) in The Cancer Genome Atlas (TCGA) cohort. 1q21-44-encoded genes annotated under the Gene Ontology term “Golgi apparatus” (right). Color codes for tumor types (bottom of heat map) and copy number changes (top) indicated. (B) Copy number variations of genes (rows) in TCGA lung adenocarcinomas (columns). (C) PI4KB gene copy-number alterations (X axis) and relative mRNA expression (Y axis) in TCGA lung adenocarcinomas (n=522). Gain, n=3–4 copies; amplified, n ≥ 5 copies. (D and E) Somatic mutations (rows) in TCGA pan-cancer (D) and lung adenocarcinoma (E) cohorts (columns). (F) Relative expression of 1q21.3-encoded mRNAs in lung cancer cell lines with or without 1q21.3 amplifications. Immortalized bronchial epithelial (BEAS-2B) cells included as control. (G) Total cellular PI4P concentrations in 1q-amplified (red) and -diploid (black) lung cancer cell lines determined by ELISA. Each dot is a replicate sample. (H) Kaplan-Meier plot comparing groups with high (top-third), intermediate (middle-third), or low (bottom-third) expression of a 1q21.3-encoded gene expression signature. (I) Digital droplet PCR analysis of PI4KB copy numbers in normal lung tissues (NL) and 1q-amplified H3122 lung adenocarcinoma cells. (J) PI4KB copy numbers (X-axis) and mRNA expression (Y-axis) in human lung adenocarcinomas (dots) (r- and P-values, Pearson’s correlation, red line is best-fit). (K) Kaplan-Meier plot comparing groups with or without PI4KB genomic amplifications. (L) Tumor recurrence rates in PI4KB-amplified and -diploid human lung adenocarcinomas. (M) Kaplan-Meier plot comparing groups with PI4KB mRNA expression above (high) or below (low) the median value.
Figure 2.
Figure 2.
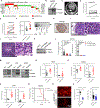
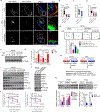
PI4KIIIβ functions as a metastasis driver in KRAS-mutant lung adenocarcinoma. (A) Co-occurrence of somatic mutations (rows) in TCGA lung adenocarcinomas (columns). (B) Western blot analysis of lentivirus-infected 344SQ cells. (C) Micro-computed tomography of a lung tumor (arrow) in a KrasLSL-G12D mouse. (D and E) Area of each lung tumor in the lenti-CG (D, black dots) and lenti-CP (E, red dots) cohorts determined by micro-computed tomography. (F) Percent change in tumor areas over time. (G) PCR analysis of genomic DNA from normal lung (NL) and lung tumor. Recombined KrasLSL-G12D allele (arrow). Molecular weight markers (MW). (H) Immunohistochemical detection of PI4KIIIβ in a lung tumor in a lenti-CP-infected mouse. Scale bar, 200 µm. (I and J) Lung adenoma (I) and adenocarcinoma (J). Boxed areas shown at higher magnification (insets). Scale bar, 200 µm. (K) Western blot analysis of H2122 cells transfected with indicated PI4KIIIβ shRNAs or control shRNA (shCTL). (L) Orthotopic tumor diameters (left) and number of metastases to contralateral lung (right) per mouse (dot). (M) Western blot analysis of ectopic PI4KIIIβ expression in murine KP cell lines. (N-P) Flank tumor weights and lung metastasis numbers (left and right, respectively) generated from 393P (N), 344SQ (O), and 344P (P) KP cell lines per mouse (dot). (Q) Kaplan-Meier plot of mouse cohorts bearing orthotopic tumors. (R and S) Red fluorescent protein (RFP)-tagged 344SQ cells were injected by tail vein into mice, and lung tumors (red) were visualized by fluorescence microscopy of intact lung tissues (R) and quantified (dots) based on numbers (left) and size (S). Scale bar, 400 µm.
Figure 3.
Figure 3.
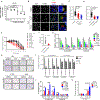
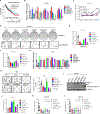
PI4KIIIβ is an actionable target in 1q-amplified lung cancer cells. (A) Total cellular PI4P concentrations in H2122 cells treated for 24 h with different concentrations of IN-9 or vehicle (dimethyl sulfoxide, DMSO) determined by ELISA. (B) Single-channel and merged images of staining in H23 cells treated with different concentrations of IN-9 or DMSO for 16 h. Golgi-resident PI4P were identified by merging PI4P (green) with the trans-Golgi marker TGN46 (red). Boxed regions illustrated at higher magnification (insets). Scale bars: 15 μm and 5 μm (insets). (C and D) Golgi-resident PI4P identified as described in (B) in each H23 cell (dot) after treatment with IN-9 (C) or transfection with PI4KIIIβ siRNA (D). (E) Relative densities of 1q-amplified (red) and –diploid (black) human lung adenocarcinoma cell lines determined by WST-1 assays after 4 days of different doses of IN-9 treatment. (F) Half maximal inhibitory (IC50) concentrations of IN-9 determined from (E). (G) Colonies formed on plastic after 7 days of IN-9 treatment. DMSO (0 µM). Results expressed relative to DMSO control. (H and I) Migrated and invaded cancer cells in Transwell chambers (H) were quantified and plotted (I) after IN-9 treatment for 16 h. Scale bars: 200 μm. (J and K) Annexin V/propidium iodide flow cytometry to detect apoptotic cells after 24-h IN-9 treatment of 1q-amplified or –diploid lung cancer cells (J) or H1299 cells that ectopically express PI4KIIIβ or empty vector (K).
Figure 4.
Figure 4.
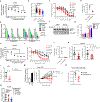
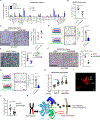
PI4KIIIβ is an actionable target in 1q-amplified cancers. (A) Total cellular PI4P concentrations in H2122 cells after 24 h treatment with compound B or vehicle dimethyl sulfoxide (DMSO) determined by ELISA. Each dot is a replicate sample. (B) Golgi-resident PI4P in each H2122 cell (dot) determined by immunofluorescence staining as described in Fig. 3B. Cells treated for 16 h with compound B or DMSO. (C) Relative densities of 1q-amplified (red) and –diploid (black) human lung adenocarcinoma cell lines determined after 4 days of compound B treatment. (D) Half maximal inhibitory (IC50) concentrations determined on the basis of (C). (E) Colonies formed on plastic after 7 days of compound B treatment. Results expressed relative to DMSO control (0 µM). (F and G) Western blot analysis to detect apoptotic cells on the basis of PARP1 cleavage (arrow) (F) and Annexin V/propidium iodide flow cytometry (G) in 1q-amplified (H2122) and 1q-diploid (H460) lung cancer cells treated for 24 h with compound B. (H) Total cellular PI4P in H2122 cells treated with different doses of compound A determined by ELISA. (I) Relative densities of 1q-amplified (red) and –diploid (black) lung cancer cells determined after 4 days of compound A treatment. (J) Half maximal inhibitory (IC50) concentrations determined on the basis of (I). (K) H2122 orthotopic lung tumor diameters (left) and metastases (right) after 7 d of compound A treatment. (L) Metastases generated by H23 orthotopic lung tumors after 7 d of compound A treatment. (M) PCR detection of PI4KB copy numbers in a lung adenocarcinoma patient-derived xenograft (PDX) (left). PDX tumor volumes in mice treated with compound A expressed as fold-change relative to time (t)=0 (right). (N) MB-MDA-468 mammary tumor weights after 7 d of compound A treatment. (O) H2122 orthotopic lung tumor diameters after 21 d of compound B treatment at indicated doses.
Figure 5.
Figure 5.
PI4KIIIβ-dependent kinase activity promotes tumor growth and metastasis. (A) Western blot analysis of ectopic SAC1-K2A expression in H2122 cells. (B) Total cellular PI4P concentrations in H2122 cells transfected with SAC1-K2A or EGFP determined by ELISA. (C) Cell proliferation determined by WST-1 assays. (D) Colonies formed on 6-well plates (adherent) and in soft agar (non-adherent). Scale bar: 200 μm. (E) Western blot analysis of ectopic PI4KIIIβ and SAC1-K2A expression. (F) Cell proliferation determined by WST-1 assays. (G) Invaded cells in Transwell chambers. Scale bar: 200 μm. (H) Western blot analysis of ectopic wild-type or kinase-dead mutant PI4KIIIβ (D656A) in H1299 cells. (I) Total cellular PI4P concentrations in cells generated in (H) determined by ELISA. (J) Cell proliferation determined by WST-1 assays. (K) Migrated and invaded cells in Transwell chambers. Scale bar: 200 μm. (L) Quantification of cells in (K). (M) Western blot analysis of ectopic wild-type or kinase-dead mutant (D656A) PI4KIIIβ expression in H2122_shPI4KIIIβ cells. Empty vector (Vec). (N) Cell proliferation determined by WST-1 assays. (O) Colonies formed on plastic. (P) Quantification of colonies in (O). (Q) Western blot analysis of ectopic wild-type or kinase-dead mutant (D656A) PI4KIIIβ expression in 344SQ_shPI4KIIIβ cells. (R) Flank tumor weights (left) and lung metastasis numbers (right) in syngeneic, immunocompetent mice.
Figure 6.
Figure 6.
PI4KIIIβ drives secretion of pro-metastatic proteins. (A) Single-channel and merged images of plasma membrane-associated VSV-G (red) and total VSV-G (green) in H23 cells transfected with indicated siRNAs. Boxed areas in merged images are magnified (inset). Scale bars: 10 μm and 3 μm (insets). (B-D) Surface VSV-G-to-total VSV-G in H23 cells transfected with siPI4KIIIβ (B), treated with compound B (C), or transfected with siGOLPH3 (D) (n > 15 cells per group). (E) Non-adherent colonies formed by shPI4KIIIβ- and shCTL-transfected H2122 cells treated with conditioned medium (CM) from shCTL- or shPI4KIIIβ-transfected H2122 cells were imaged and quantified. Fresh medium (−) included as a control. Scale bar: 200 μm. (F) Western blot analysis to detect PARP1 cleavage (arrow) in apoptotic cells. (G) Annexin V/propidium iodide flow cytometric detection of apoptotic shRNA-transfected H2122 cells following treatment with PI4KIIIβ antagonist IN-9 or vehicle (0 μM). (H) Schema of liquid chromatography-mass spectrometry (LC-MS) analysis of conditioned medium samples from H23 cells and H2122 cells. Identified proteins of interest are listed. (I and J) Western blot analysis of conditioned medium samples (I) and cell lysates (J). Specific PLOD3 band indicated (arrow). (K) Western blot analysis of conditioned medium samples isolated from cells stably transfected with indicated vectors was performed to quantify STC2 and CLU proteins. The relative protein amounts were quantified in ImageJ (bar graph). (L) Quantification of Golgi-localized STC2 relative to t=0 (n= 20 cells per time point) from vesicular release assays on H23 cells co-transfected with GFP-tagged STC2 and indicated siRNAs. Results are from images taken before (t=0) and 15 min and 30 min after switching to a temperature that permits Golgi release. Images are in fig. S9D and E.
Figure 7.
Figure 7.
PI4KIIIβ-dependent secreted proteins promote metastasis. (A) Kaplan-Meier plot of TCGA lung adenocarcinomas with low (bottom-third), intermediate (middle-third), or high (top-third) expression of a 5-gene signature (SEMA3C, TIMP1, STC2, PLOD3, and CLU). (B) qPCR analysis of mRNA expression in H2122 cells transfected with the indicated siRNAs. (C) Cell proliferation determined by WST-1 assays. (D) Colonies formed by siRNA-transfected H2122 cells on plastic and in soft agar. Scale bar: 200 μm. (E and F) Quantification of colonies on plastic (E) and in soft agar (F) as shown in (D). (G) qPCR analysis of mRNA expression in H2122 cells transfected with the indicated siRNAs. (H) Colonies formed in soft agar were imaged and quantified. Scale bar: 200 μm. (I) Western blot analysis to detect cleavage of PARP1 (arrow) and caspase 3 in apoptotic cells. (J) Annexin V/propidium iodide flow cytometric detection of apoptotic H2122 cells. (K and L) H2122 orthotopic tumor diameters (K) and metastasis numbers (L) per mouse.
Figure 8.
Figure 8.
PI4KIIIβ-dependent secretion regulates processes in the tumor microenvironment. (A) Concentrations of secreted factors in conditioned medium samples. (B) MDSCs (CD11b+ GR1+) in 344SQ flank tumors expressed as percentage of total CD45+ cells. (C) CD31+ cells in flank tumors generated by injection of 344SQ cells into syngeneic, immunocompetent mice. Scale bar: 300 µm. Microvessel density quantification in each cohort (plot). (D) Migrated human umbilical vein endothelial cells (HUVECs) in co-culture with H2122 cells in Transwell chambers. Scale bar: 200 μm. (E) HUVEC tubes formed in co-culture with H2122 cells. Scale bar: 100 μm. (F) α-smooth muscle actin (αSMA)+ cells in flank tumors generated by injection of 344SQ cells into syngeneic, immunocompetent mice. Scale bar: 300 µm. Quantification of αSMA+ cells in each cohort (plot). (G) Migrated cancer-associated fibroblasts (CAFs) in co-culture with 344SQ cells in Transwell chambers. Scale bar: 200 μm. (H) Numbers of invasive projections per multicellular aggregate. Aggregates containing RFP-tagged 344SQ cells alone (−) or 344SQ cells and GFP-tagged CAFs (+) were seeded in collagen gels and imaged. (I) Multicellular aggregate with leader-follower cell structures containing a CAF at the tip and collectively invasive 344SQ cells that follow behind (arrows). Scale bar: 100 μm. (J) Numbers of leader-follower cell structures per aggregate in (I). (K) A schematic illustration of the proposed model. The 1q amplicon encodes PI4KIIIβ, which activates PI4P synthesis, leading to GOLPH3 recruitment, increased anterograde vesicular trafficking, and enhanced secretion of pro-survival and pro-metastatic factors. Secretion can be blocked by PI4KIIIβ antagonists.

References

    1. Paltridge JL, Belle L, Khew-Goodall Y, The secretome in cancer progression. Biochim Biophys Acta 1834, 2233–2241 (2013). - PubMed
    1. Yamauchi M, Barker TH, Gibbons DL, Kurie JM, The fibrotic tumor stroma. J Clin Invest 128, 16–25 (2018). - PMC - PubMed
    1. Coussens LM, Fingleton B, Matrisian LM, Matrix metalloproteinase inhibitors and cancer: trials and tribulations. Science 295, 2387–2392 (2002). - PubMed
    1. McMillin DW, Negri JM, Mitsiades CS, The role of tumour-stromal interactions in modifying drug response: challenges and opportunities. Nat Rev Drug Discov 12, 217–228 (2013). - PubMed
    1. Joyce JA, Pollard JW, Microenvironmental regulation of metastasis. Nat Rev Cancer 9, 239–252 (2009). - PMC - PubMed

Publication types

MeSH terms

Substances