. 2020 Jan 22;10(1):948.
doi: 10.1038/s41598-019-57378-8.

Genetic insights into the social organisation of the Avar period elite in the 7th century AD Carpathian Basin

Affiliations

Genetic insights into the social organisation of the Avar period elite in the 7th century AD Carpathian Basin

Veronika Csáky et al. Sci Rep. .

Erratum in

Abstract

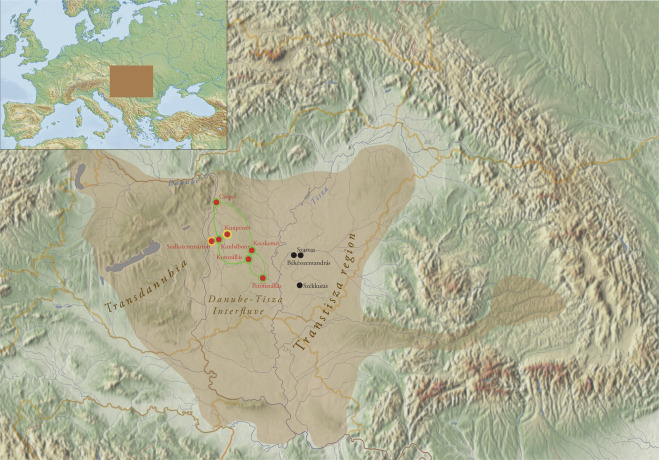
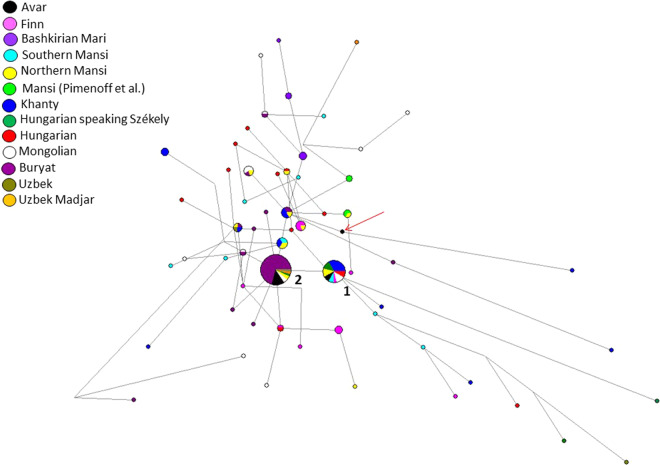
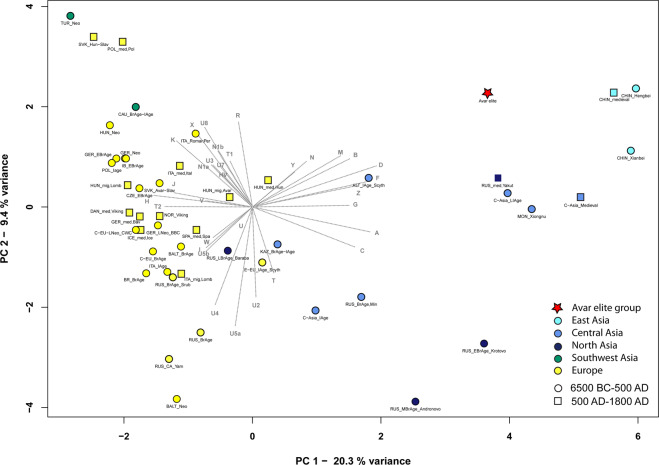
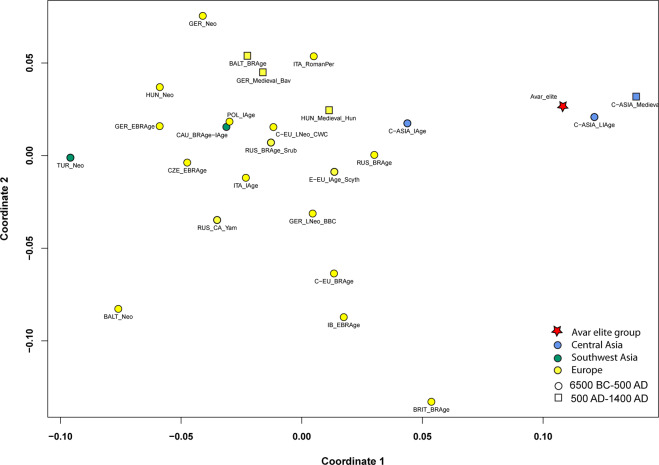
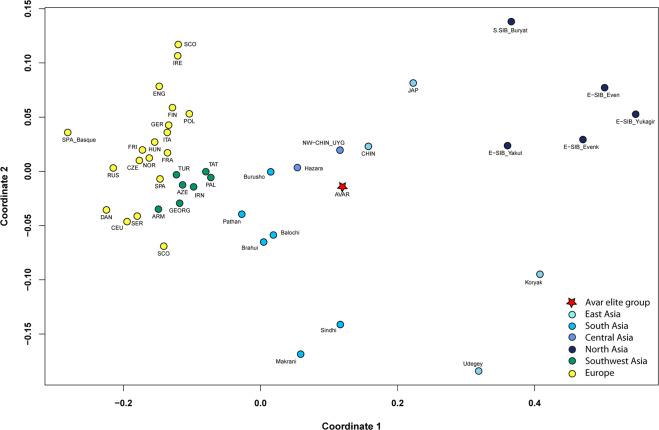
After 568 AD the Avars settled in the Carpathian Basin and founded the Avar Qaganate that was an important power in Central Europe until the 9th century. Part of the Avar society was probably of Asian origin; however, the localisation of their homeland is hampered by the scarcity of historical and archaeological data. Here, we study mitogenome and Y chromosomal variability of twenty-six individuals, a number of them representing a well-characterised elite group buried at the centre of the Carpathian Basin more than a century after the Avar conquest. The studied group has maternal and paternal genetic affinities to several ancient and modern East-Central Asian populations. The majority of the mitochondrial DNA variability represents Asian haplogroups (C, D, F, M, R, Y and Z). The Y-STR variability of the analysed elite males belongs only to five lineages, three N-Tat with mostly Asian parallels and two Q haplotypes. The homogeneity of the Y chromosomes reveals paternal kinship as a cohesive force in the organisation of the Avar elite strata on both social and territorial level. Our results indicate that the Avar elite arrived in the Carpathian Basin as a group of families, and remained mostly endogamous for several generations after the conquest.


Conflict of interest statement

The authors declare no competing interests.

Figures

Figure 1
Figure 1
Territory of the early Avar Qaganate and the location of the investigated sites in the Carpathian Basin. The investigated sites of the Kunbábony group (7th century) are marked with red, 7th-8th century supplementary sites are marked with black dots. Yellow and orange circles indicate the detection of Y chromosomal N-Tat haplotype I and III respectively. Green circles and lines indicate the occurrence of shared N-Tat haplotype II in five burial sites of the Avar elite. Brown shade indicates the territory of the early Avar Qaganate. The map of the Carpathian Basin is owned by the IA RCH HAS, and was modified in Adobe Illustrator CS6. The map of Europe shown in the upper left corner, licensed under CC BY 4.0, was downloaded from MAPSWIRE (https://mapswire.com/europe/physical-maps/).
Figure 2
Figure 2
A selection of grave goods from the burial at Kunbábony. The burial of an adult man at Kunbábony (AC2) contained 2.34 kilograms of gold in form of weaponry covered with precious metal foils, ornamented belt sets with so-called pseudo buckles and drinking vessels. The funerary attire and the grave goods are understood as elements of the steppe nomadic material culture of the period. The technological details and the decoration however suggest a culturally heterogeneous origin. Presented objects: 1–2. earrings; 3. armring; 4. eagle head-shaped end of a sceptre or horsewhip; 5–13. elements of the belt with the so-called pseudo buckles (9–10.); 14. crescent-shaped gold sheet; 15–18. sword fittings; 19. jug; 20. drinking horn. Pictures were first published in H. Tóth & Horváth.
Figure 3
Figure 3
Median Joining network of 162 N-Tat Y-STR haplotypes. Allelic information of ten Y-STR loci were used for the network. Only those Avar samples were included, which had results for these ten Y-STR loci. The founder haplotype I (Cluster 1) is shared by eight populations including three Mongolian, three Székely, three northern Mansi, two southern Mansi, two Hungarian, eight Khanty, one Finn and two Avar (AC17, RC26) chromosomes. Haplotype II (Cluster 2) includes 45 haplotypes from six populations studied: 32 Buryats, two Mongolians, one Székely, one Uzbek, one Uzbek Madjar, two northern Mansi and six Avars (AC1, AC12, AC14, AC15, AC19 and KSZ 37). Haplotype III (indicated by a red arrow) is AC8. Information on the modern reference samples is seen in Table S9.
Figure 4
Figure 4
PCA plots with 48 ancient populations, representing first and second principal components. The differentiation of European and Asian populations is displayed on the PCA plot of ancient populations along PC1, PC2. The separation is caused by the opposite influence of Asian (A, B, C, D, G, F, Z) and European (H, J, K, T2) haplogroups along PC1, while R and the subgroups of haplogroup U (especially the U4, U5a and U8) predominate on PC2. The Avar elite group is situated close to 5th–3rd century BC Scythians from the Altai region (ALT_Scythians), medieval Chinese population and Yakuts from the 15th-19th centuries AD (RUS_Yakuts) along PC1 and PC2. For haplogroup frequencies, abbreviations and references see Table S2.
Figure 5
Figure 5
MDS with 26 ancient populations. The multidimensional scaling plot is based on linearised Slatkin FST values that were calculated based on whole mitochondrial sequences (stress value is 0.1669). The MDS plot shows the connection of the Avar elite group to the Central Asian populations of the Late Iron Age (C-ASIA_LIAge) and Medieval period (C-ASIA_Medieval) along coordinate 1 and coordinate 2, which is caused by small genetic distances between these populations. The European ancient populations are situated on the left part of the plot. The FST values, abbreviations and references are presented in Table S4.
Figure 6
Figure 6
MDS with the 44 modern populations and the Avar elite group. The multidimensional scaling plot is displayed based on linearised Slatkin FST values calculated based on whole mitochondrial sequences (stress value is 0.0677). The MDS plot shows differentiation of European, Near Eastern, Central and East Asian populations along coordinates 1 and 2. The Avar elite (AVAR) is located on the Asian part of plot and clustered with Uyghurs from Northwest-China (NW-CHIN_UYG) and Han Chinese (CHIN), as well as with Burusho and Hazara populations from the Central Asian Highland (Pakistan). The FST values, abbreviations and references are presented in Table S5.
Figure 7
Figure 7
Phylogenetic tree of D4i2 sub-haplogroup. Phylogenetic tree of D4i2 sub-haplogroup shows AC6 to be the mitochondrial founder of most of the other D4i2 lineages from East-Central and North Asia, which indicates a close shared maternal ancestry between the populations represented by these individuals. The references of individuals displayed on the tree are presented in Table S6.

References

    1. Golden, P. B. Some Notes on the Avars and Rouran. In The Steppe Lands and the World beyond them. Studies in honor of Victor Spinei on his 70th birthday. (eds. Curta, F. & Maleon, B.-P.) 43–66 (2013).
    1. Pohl, W. The Avars. A Steppe Empire in Central Europe, 567–822. (Cornell University Press, 2018).
    1. Sinor, D. The Cambridge History of Early Inner Asia. (Cambridge University Press, 1990).
    1. Kardaras, G. Byzantium and the Avars, 6th-9th Century AD. Political, Diplomatic and Cultural Relations. East Central and Eastern Europe in the Middle Ages, 450–1450, Volume 51. (Brill, 2018).
    1. Ligeti L. A pannóniai avarok nyelve. Magy. Nyelv. 1986;LXXXII:129–151.

Publication types

Substances