. 2020 Jan;577(7792):676-681.
doi: 10.1038/s41586-020-1935-3. Epub 2020 Jan 22.

Hyperactivation of sympathetic nerves drives depletion of melanocyte stem cells

Affiliations

Hyperactivation of sympathetic nerves drives depletion of melanocyte stem cells

Bing Zhang et al. Nature. 2020 Jan.

Abstract

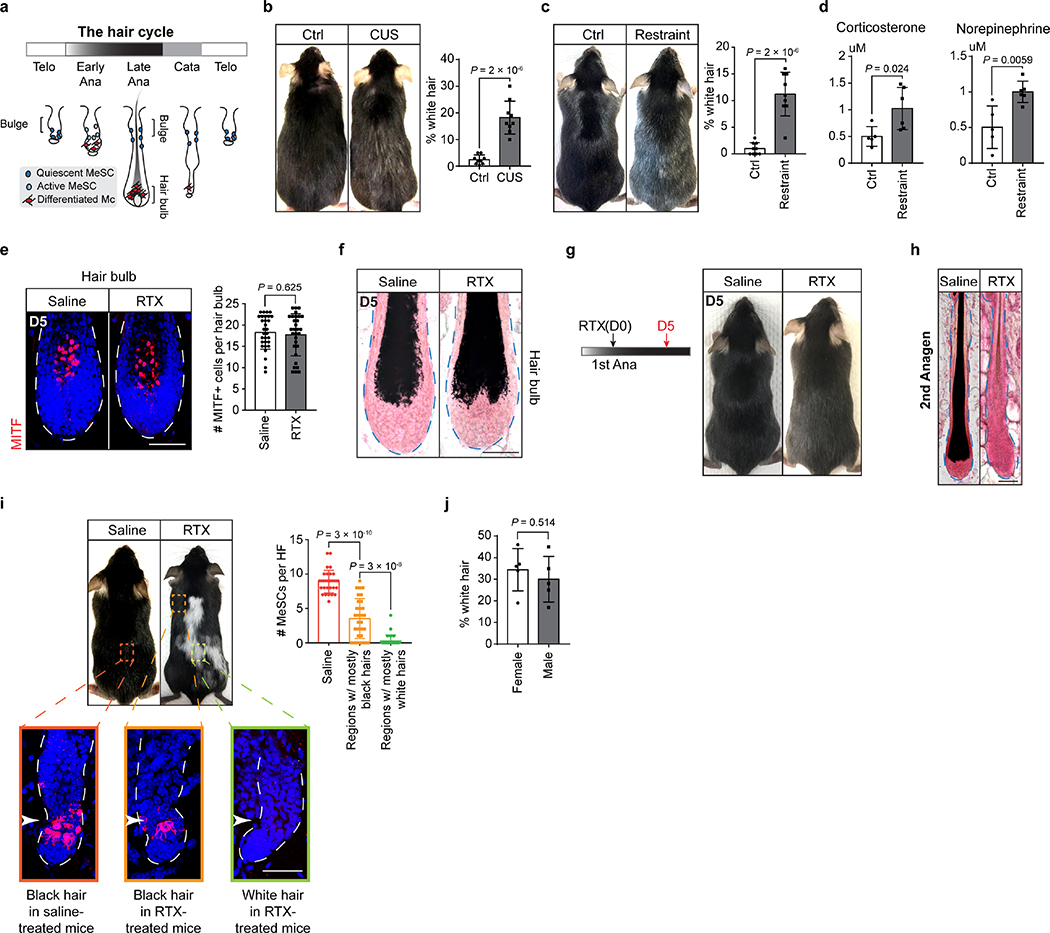
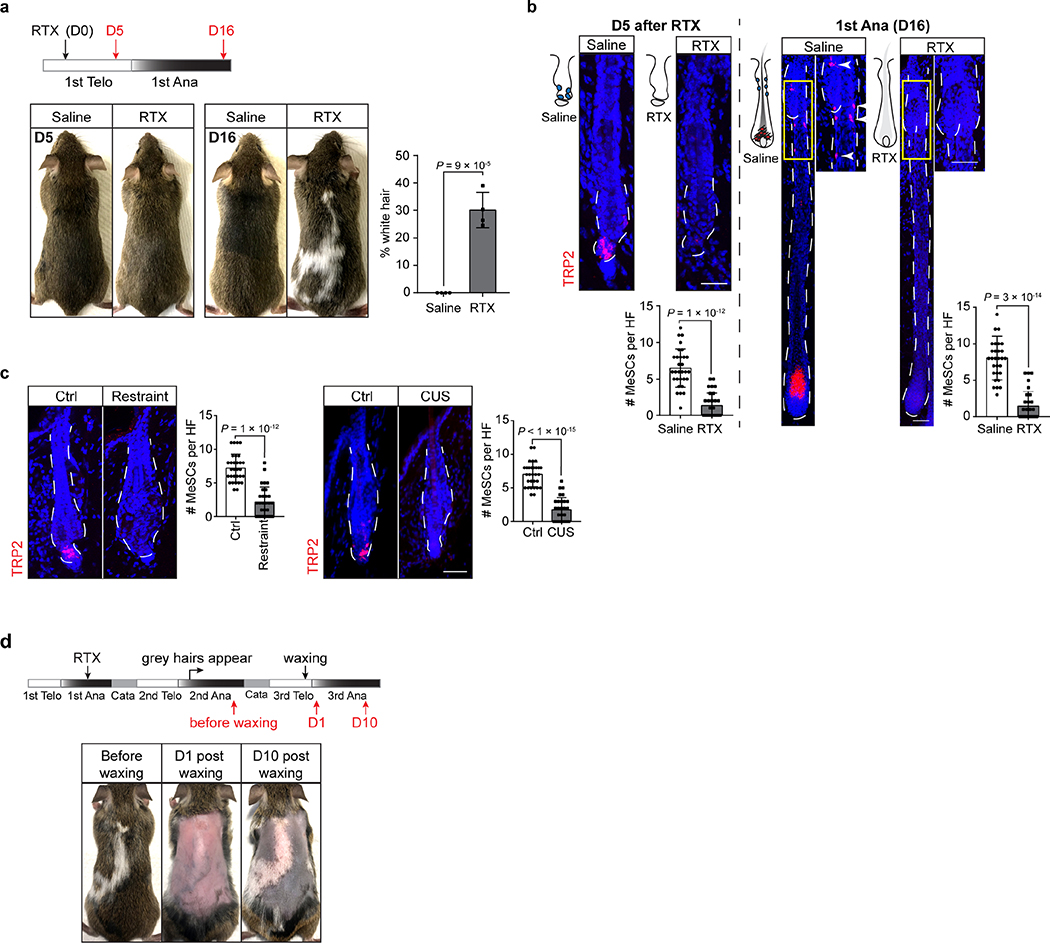
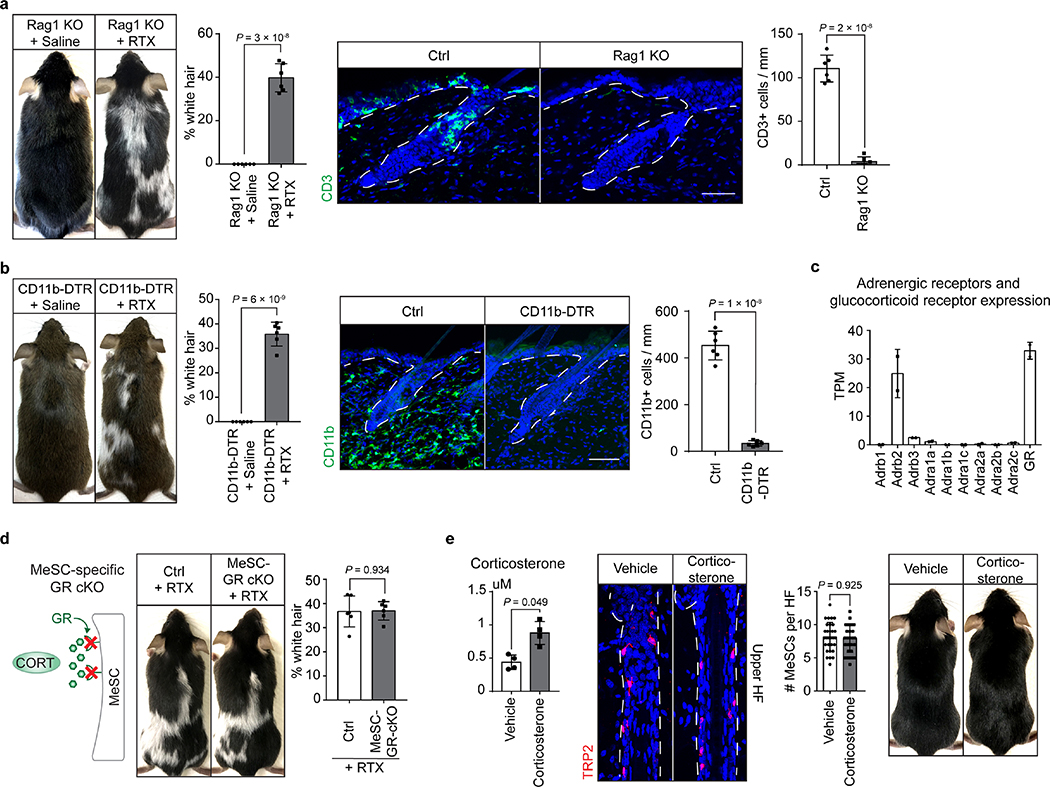
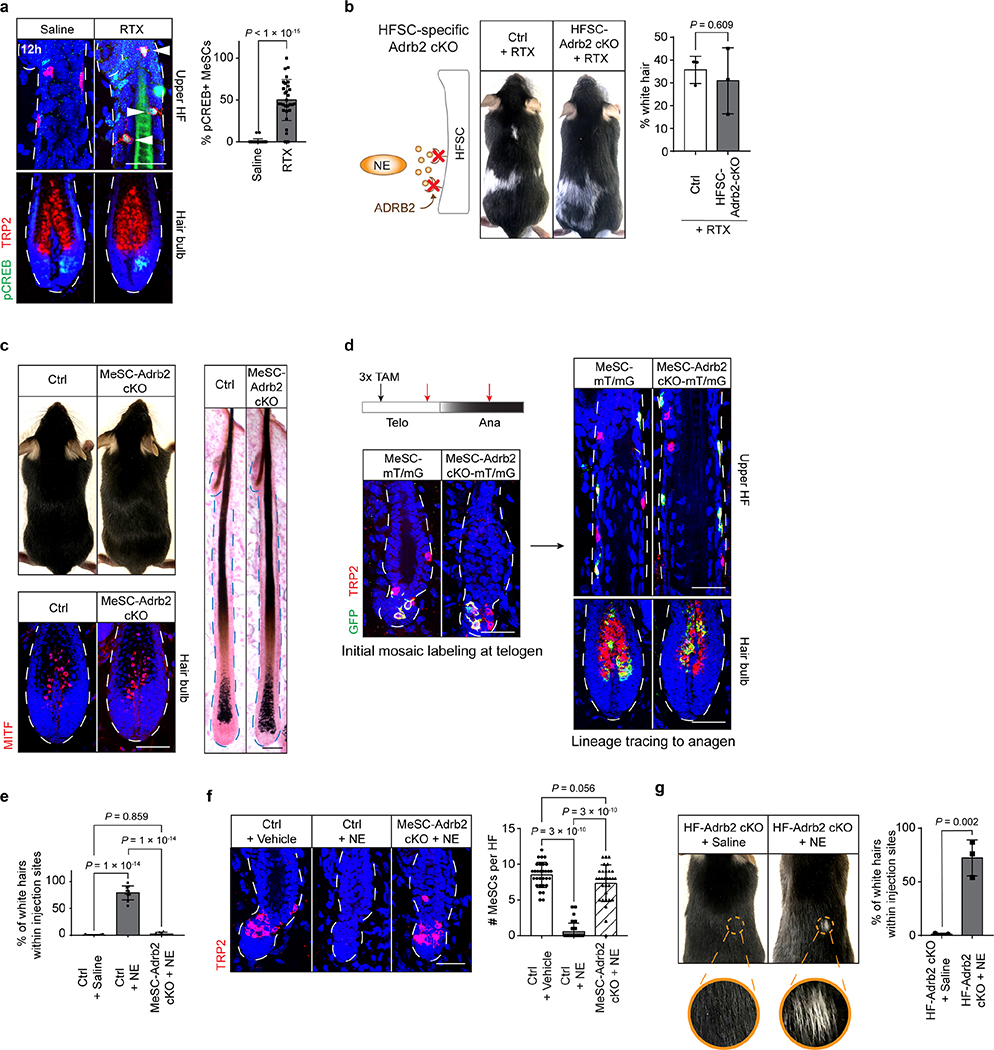
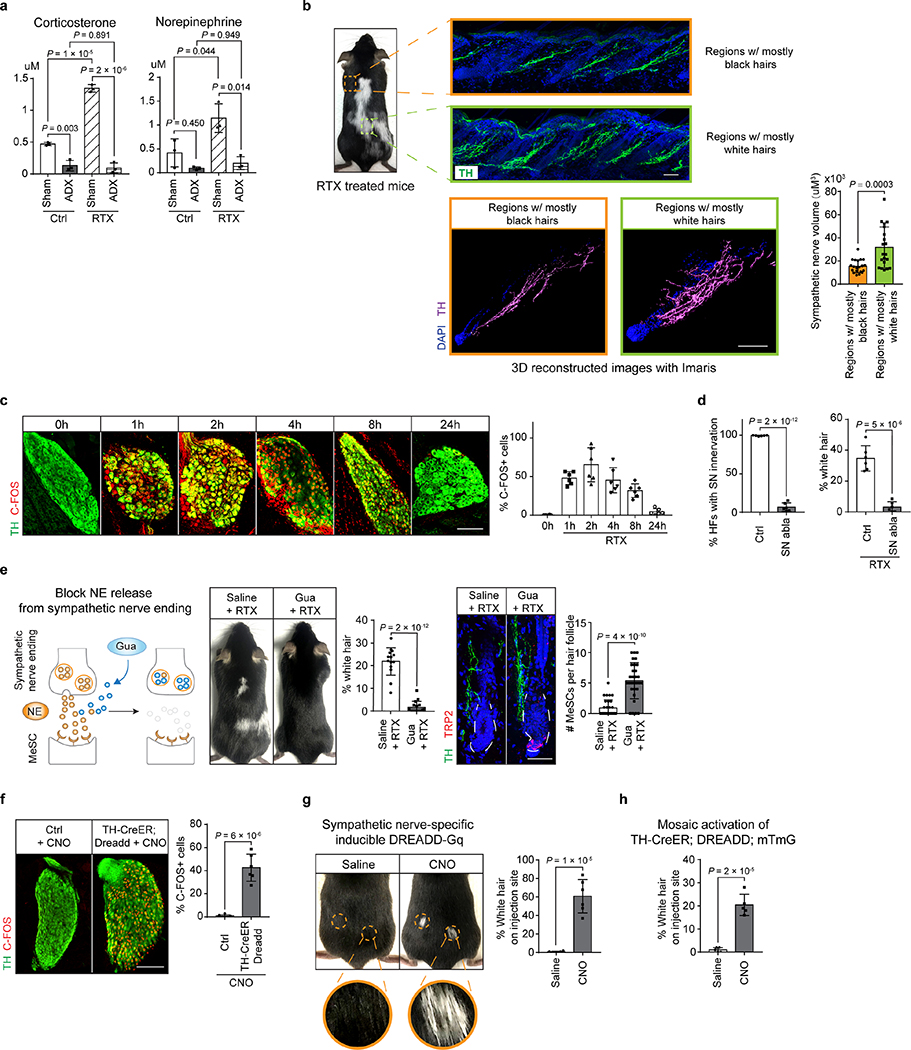
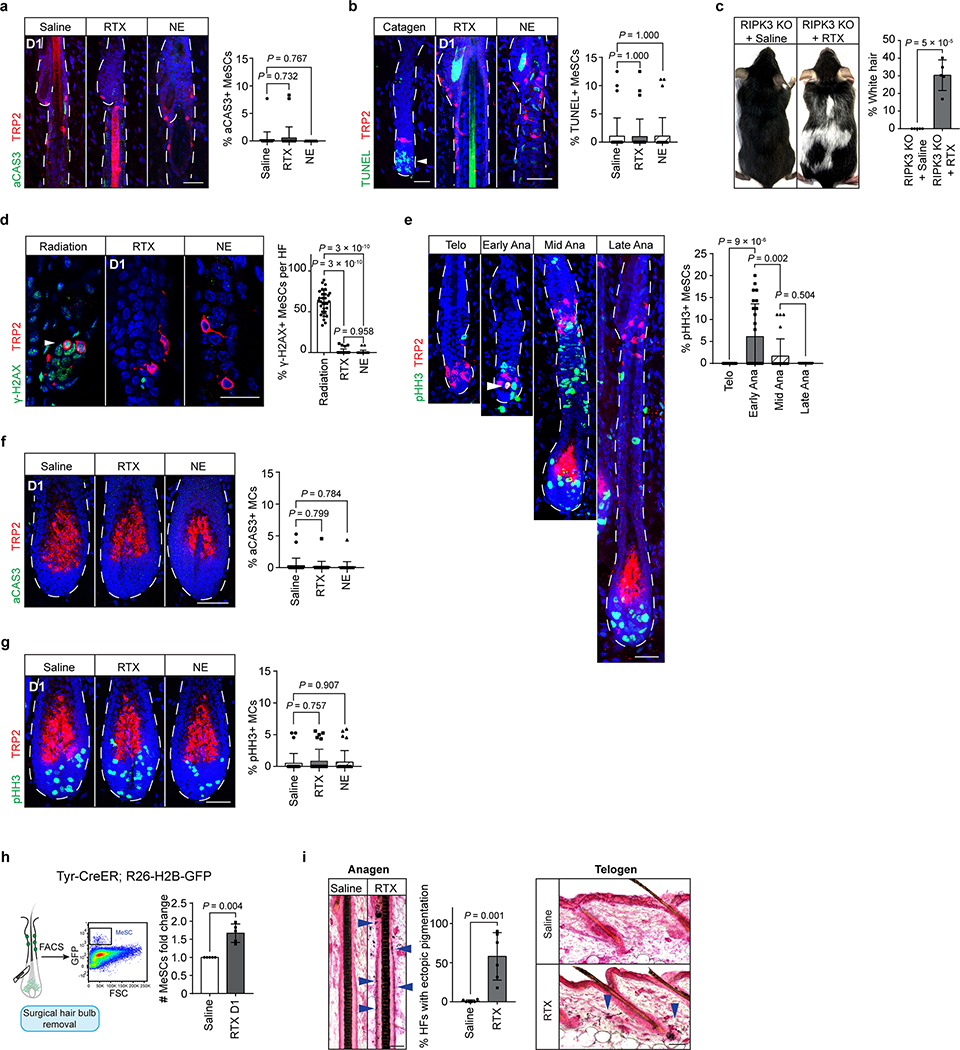
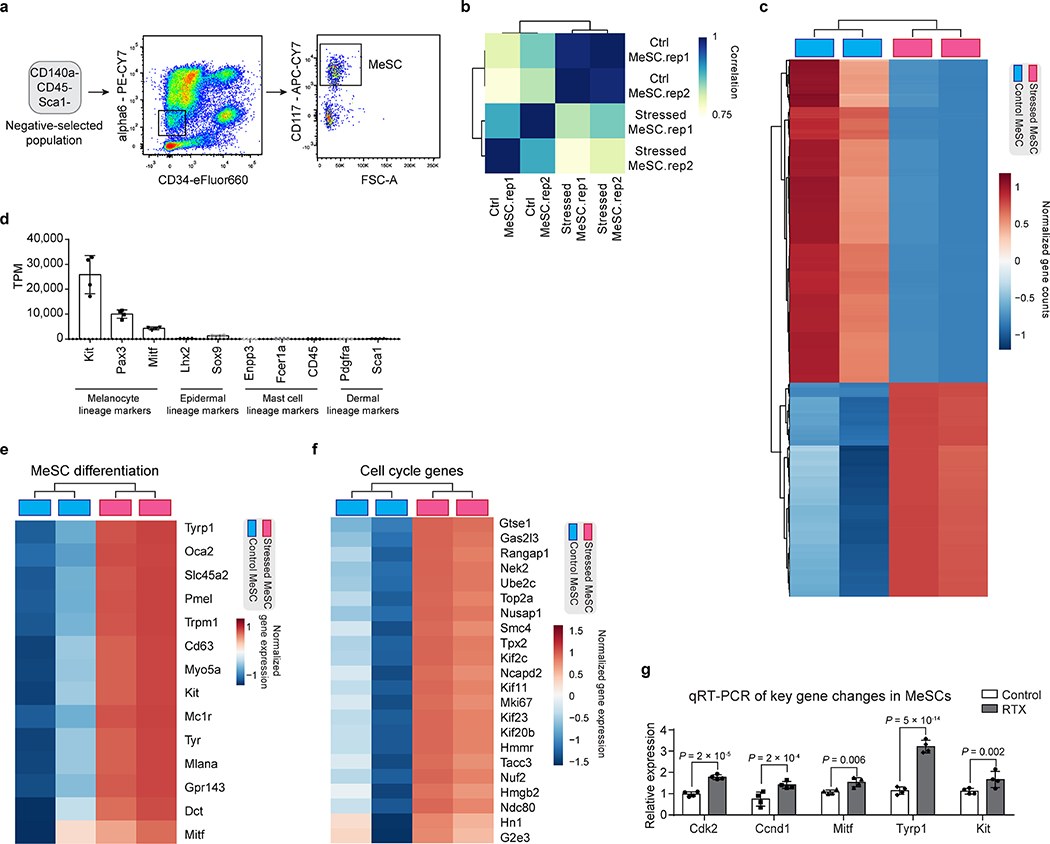
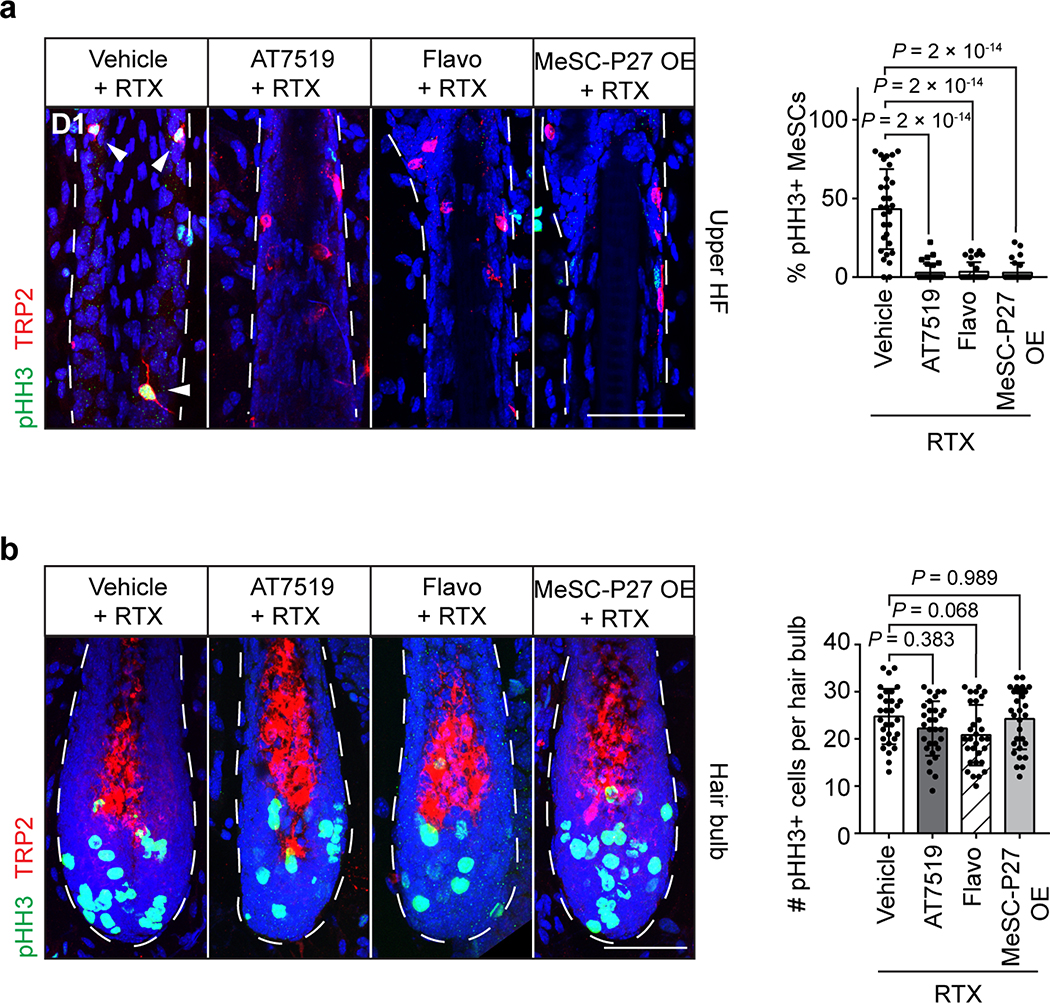
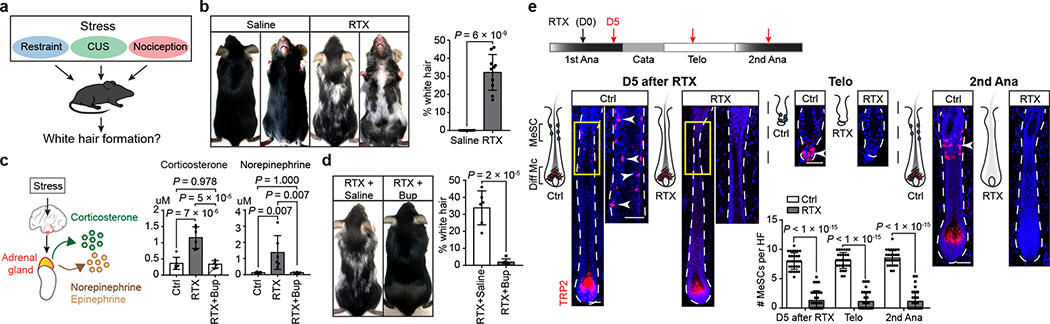
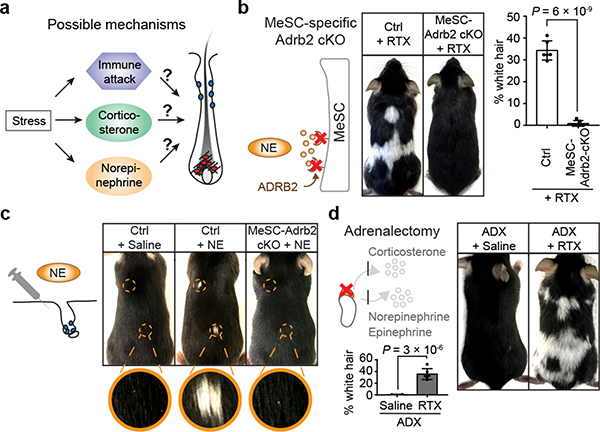
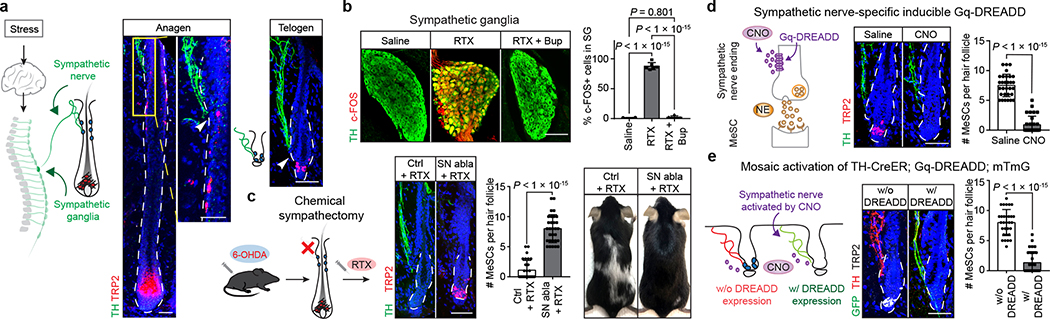
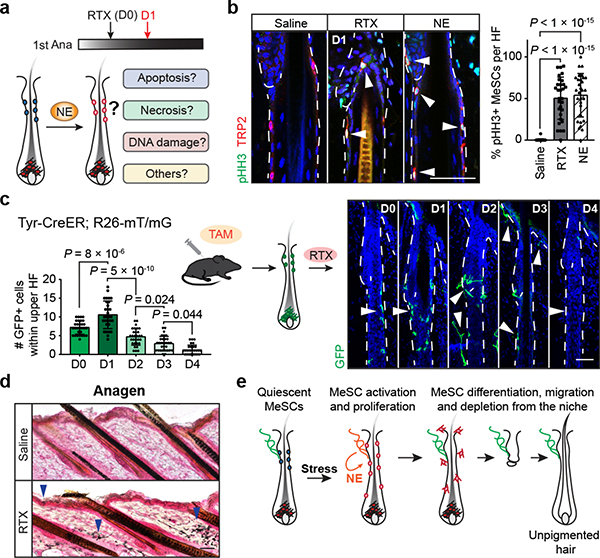
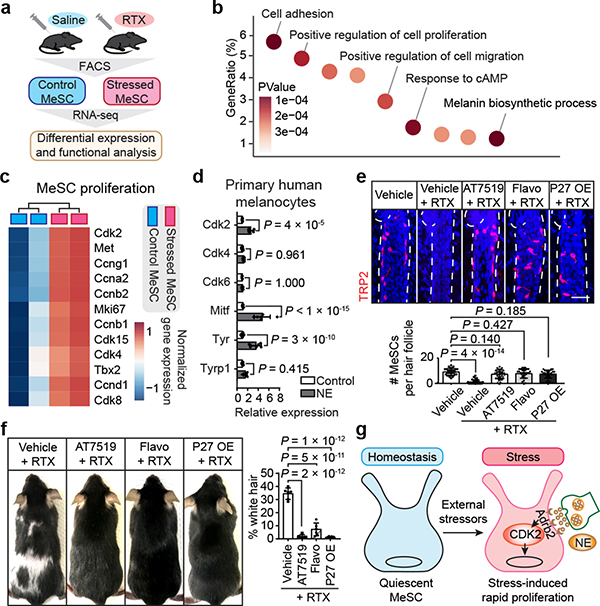
Empirical and anecdotal evidence has associated stress with accelerated hair greying (formation of unpigmented hairs)1,2, but so far there has been little scientific validation of this link. Here we report that, in mice, acute stress leads to hair greying through the fast depletion of melanocyte stem cells. Using a combination of adrenalectomy, denervation, chemogenetics3,4, cell ablation and knockout of the adrenergic receptor specifically in melanocyte stem cells, we find that the stress-induced loss of melanocyte stem cells is independent of immune attack or adrenal stress hormones. Instead, hair greying results from activation of the sympathetic nerves that innervate the melanocyte stem-cell niche. Under conditions of stress, the activation of these sympathetic nerves leads to burst release of the neurotransmitter noradrenaline (also known as norepinephrine). This causes quiescent melanocyte stem cells to proliferate rapidly, and is followed by their differentiation, migration and permanent depletion from the niche. Transient suppression of the proliferation of melanocyte stem cells prevents stress-induced hair greying. Our study demonstrates that neuronal activity that is induced by acute stress can drive a rapid and permanent loss of somatic stem cells, and illustrates an example in which the maintenance of somatic stem cells is directly influenced by the overall physiological state of the organism.


Conflict of interest statement

COMPETING INTERESTS

L.I.Z. is a founder and stockholder of Fate Therapeutics, Inc., Scholar Rock and Camp4 Therapeutics. D.E.F has a financial interest in Soltego, Inc., a company developing SIK inhibitors for topical skin darkening treatments that might be used for a broad set of human applications. D.E.F’s interests were reviewed and are managed by Massachusetts General Hospital and Partners HealthCare in accordance with their conflict of interest policies. A.R. is an SAB member of ThermoFisher Scientific, Neogene Therapeutics, Asimov, and Syros Pharmaceuticals, an equity holder of Immunitas, and a founder and an equity holder of Celsius Therapeutics. I.M.C. is an SAB member of GSK pharmaceuticals and Kintai pharmaceuticals. A provisional patent application has been filed based on this work (Applicants: President and Fellows of Harvard College and The General Hospital Corporation; Inventors: Y-C.H., D.E.F., B.Z., and I.R.; Application number: 62/903,517; Status: pending/provisional; Aspect covered: Methods and compositions for controlling hair greying. All other authors declare no competing interests.

Figures

Extended Data Fig. 1 |
Extended Data Fig. 1 |. Effects of stress on the hair pigmentation.
a, Schematic of MeSC behaviour during hair cycle. b, Hair greying after mice are subjected to chronic unpredictable stress (CUS). Quantifications are done by plucking ~100 hairs from different regions across the skin and counting the number of white hairs (n = 9 plucked regions from 3 mice for each condition, two-tailed unpaired t-test). c, Hair greying after mice are subjected to restraint stress. Quantifications are done as described in b. d, LC-MS-MS quantification of corticosterone and norepinephrine after restraint stress (n = 5 mice for control and n = 6 mice for restraint, two-tailed unpaired t-test). e, Immunofluorescent staining of hair bulbs for Melanocyte Inducing Transcription Factor (MITF, red) from mice 5 days after treatment of saline or RTX (n = 30 HFs from 3 mice for each condition, two-tailed unpaired t-test). f, Fontana–Masson staining of hair bulbs for melanin from mice 5 days after treatment of saline or RTX (n = 6 mice for each condition). g, Hair coat colour in mice 5 days after RTX injection in anagen. RTX is injected in full anagen and the mice are examined 5 days later at late anagen. The coat colour remains black (n = 6 mice for each condition). h, Fontana–Masson staining of HFs for melanin from mice treated with saline or RTX at first anagen and examined at second anagen (see Fig. 1e, 2nd Ana for corresponding fluorescent images, n = 6 mice for each condition). i, Quantification of MeSC numbers in saline and RTX-injected skins. For the RTX-injected skins, the number of MeSCs in regions with predominantly black hairs and regions with many white hairs are quantified separately. Orange and green dashed boxes denote representative black and white hair regions in RTX injected mice. Enlarged boxes contain representative immunofluorescent images of HFs from each region. White arrowheads indicate regions where MeSC reside. n = 30 HFs from 3 mice for each condition, one-way ANOVA with Tukey’s multiple comparisons. j, Quantification of the body area covered by white hairs in female vs. male mice (n = 5 mice for each sex, two-tailed unpaired t-test). All data are mean ± S.D.
Extended Data Fig. 2 |
Extended Data Fig. 2 |. Loss of MeSCs after three different stress models.
a, Upper panel, schematic of experimental design for RTX injection in first telogen (red arrows indicate harvesting). Lower panel left, representative mouse images 5 days and 16 days after RTX injection in first telogen. Lower panel right, quantification of the body area covered by white hairs 16 days after RTX injection (n = 4 mice for each condition, two-tailed unpaired t-test). b, Immunofluorescent staining for TRP2 from saline or RTX-injected mice (n = 30 HFs from 4 mice for each condition, two-tailed unpaired t-test). Yellow boxes denote the upper HF region where MeSCs reside. Enlarged view of the yellow box regions are shown to the right. Arrowheads indicate MeSCs. c, Immunofluorescent staining for TRP2 (red) from mice subjected to CUS or restraint stress (n = 30 HFs from 5 mice for each condition, two-tailed unpaired t-test). d, Hair coat colour is monitored in RTX-injected mice for multiple rounds of hair follicle regeneration (waxing is used to initiate new rounds of anagen, n = 3 mice for each condition). Schematic denotes the experimental design. Scale bars, 50 μm. All data are mean ± S.D.
Extended Data Fig. 3 |
Extended Data Fig. 3 |. Stress-induced hair greying is not mediated through corticosterone or immune attack.
a, Left, white hair formation after RTX injection in Rag1 mutant mice devoid of T and B cells (Rag1 KO, n = 6 for each condition, two-tailed unpaired t-test). Right, immunofluorescent staining for T cell marker CD3 (green) in control and Rag1 KO skin (n = 6 mice for each condition, two-tailed unpaired t-test). b, Left, hair greying occurs when RTX is injected into CD11b-DTR mice treated with diphtheria toxin (DT) to deplete myeloid cells (n = 6 mice for each condition). Right, immunofluorescent staining for CD11b (green) in DT treated control and CD11b-DTR skin (n = 6 mice for each condition). c, Expression of adrenergic receptors and glucocorticoid receptor (GR) in MeSCs (n = 2 biologically independent samples). d, White hair formation following RTX injection into Tyr-CreER; GR fl/fl mice (MeSC-GR cKO; n = 6 mice for each condition, two-tailed unpaired t-test). e, Left, enzyme-linked immunosorbent assay (ELISA) measurement of corticosterone level in the blood 3 days after supplying corticosterone in drinking water (n = 4 mice for each condition). Middle, immunofluorescent staining of hair follicles for TRP2 (red) from mice 5 days after corticosterone treatment (n = 30 HFs from 3 mice for each condition, two-tailed unpaired t-test). Right, hair coat colour after HFs in corticosterone-treated mice enter another round of anagen to regenerate new hairs. CORT: corticosterone. Scale bars, 50 μm. All data are mean ± S.D.
Extended Data Fig. 4 |
Extended Data Fig. 4 |. Perturbations of the norepinephrine-ADRB2 pathway.
a, Immunofluorescent staining of HFs for Phospho-CREB (green) and TRP2 (red) 12 hours after RTX injection (n = 30 HFs from 3 mice for each condition, two-tailed unpaired t-test). White arrowheads indicate Phospho-CREB positive MeSCs in upper HFs after RTX injection. b, White hair formation following RTX injection into K15-CrePGR; Adrb2 fl/fl mice (HFSC-Adrb2 cKO; n = 3 mice for each condition, two-tailed unpaired t-test). c, Upper left, hair coat colour in unstressed Tyr-CreER; Adrb2 fl/fl mice (MeSC-Adrb2 cKO) in the second telogen after 7x tamoxifen treatment at the first telogen. Lower left, immunofluorescent staining of hair bulbs for MITF (red) in Tyr-CreER; Adrb2 fl/fl mice in anagen. Right, Fontana–Masson melanin staining of anagen HFs from Tyr-CreER; Adrb2 fl/fl mice (n = 3 mice for each condition). d, Upper left, schematic of experimental design for mosaic labelling in unstressed control and Adrb2 knockout (red arrows indicate harvesting). Lower left, immunofluorescent staining for GFP (green) and TRP2 (red) from Tyr-CreER; R26-mT/mG mice (MeSC-mT/mG) and Tyr-CreER; Adrb2 fl/fl; R26-mT/mG mice (MeSC-Adrb2 cKO-mT/mG) after 3x tamoxifen treatment at first telogen. Right, immunofluorescent staining of HFs for GFP (green) and TRP2 (red) after the mice enter anagen (n = 3 mice for each condition, TAM: tamoxifen). e, Quantification of white hair percentage after intradermal injection of saline or norepinephrine (n = 10 injected sites from 6–8 mice for each condition, one-way ANOVA with Tukey’s multiple comparisons). f, Immunofluorescent staining of HFs for TRP2 (red) from mouse skins intradermally injected with NE (n = 30 HFs from 10 injection sites for each condition, one-way ANOVA with Tukey’s multiple comparisons). g, White hairs are formed after intradermal injection of NE in K15-CrePGR, Adrb2 fl/fl mice (HF-Adrb2 cKO, n = 3 injection sites for each condition, two-tailed unpaired t-test). Yellow dashed circles denote intradermal injection sites. Scale bars, 50 μm. All data are mean ± S.D.
Extended Data Fig. 5 |
Extended Data Fig. 5 |. Activation of the sympathetic nervous system by nociception-induced stress or sympathetic nerve-specific inducible Gq-DREADD.
a, LC-MS-MS quantification of stress hormones in sham-operated and adrenalectomized mice (ADX, n = 3 mice for each condition, two-way ANOVA with original FDR method of Benjamini and Hochberg). b, Upper panel, immunofluorescent staining of sympathetic nerves in the skin regions with predominantly black hairs (orange box) and regions with mostly white hairs (green box, n = 3 mice for each condition). Lower panel, 3D surfaces of TH staining created using Imaris software and quantification of sympathetic nerve volume from regions with different number of unpigmented hairs (n = 20 HFs for each region from 3 mice, two-tailed unpaired t-test). c, Immunofluorescent staining of sympathetic ganglia for TH (green) and c-FOS (red) from mice injected with RTX and harvested at different time points between 0 to 24 hours (n = 6 sympathetic ganglia from 3 mice for each time points). d, Quantification of chemical sympathectomy efficiency (n = 6 mice for each condition, two-tailed unpaired t-test) and % of white hairs in RTX-injected mice treated with vehicle or 6-OHDA (n = 6 mice for each condition, two-tailed unpaired t-test). e, Guanethidine (Gua) injection blocks formation of white hairs induced by RTX injection (quantification for % of white hairs: n = 14 mice for each condition, two-tailed unpaired t-test; quantification for MeSC numbers: n = 30 HFs from 6 mice for each condition, two-tailed unpaired t-test). f, Immunofluorescent staining of sympathetic ganglia for TH (green) and c-FOS (red) from TH-CreER; Gq-DREADD mice injected with CNO and harvested 6 hours later (n = 6 sympathetic ganglia from 2 mice for each condition, two-tailed unpaired t-test). g, White hair formation after intradermal injection of CNO into TH-CreER, Gq-DREADD mice (n = 6 injection sites from 5 mice for each condition, two-tailed unpaired t-test). Yellow dashed circles denote intradermal CNO injection sites. h, Quantification of white hair percentage on CNO injection sites in mosaically-induced TH-CreER; Gq-DREADD; R26-mT/mG mice (n = 5 injection sites from 4 mice for each condition, two-tailed unpaired t-test). Scale bars, 50 μm. All data are mean ± S.D.
Extended Data Fig. 6 |
Extended Data Fig. 6 |. Apoptosis and proliferation analysis of MeSCs and the impact of RTX or norepinephrine on mature melanocytes.
a, Immunofluorescent staining of active Caspase3 (aCAS3, green) and TRP2 (red) from mice 1 day after RTX or NE injection (n = 30 HFs from 6 mice for each condition, one-way ANOVA with Tukey’s multiple comparisons). b, Terminal deoxynucleotidyl transferase dUTP nick end labelling (TUNEL) assay of HFs from mice 1 day after RTX or NE treatment. Catagen HFs are used as positive controls for TUNEL. White arrowhead points to apoptotic hair follicle cells (n = 30 HFs from 6 mice for each condition, one-way ANOVA with Tukey’s multiple comparisons). c, White hair formation in RIPK3 mutant mice (RIPK3 KO) injected with RTX (n = 5 mice for each condition, two-tailed unpaired t-test). d, Immunofluorescent staining of HFs for the DNA damage marker γ-H2AX (green) and TRP2 (red) from mice 1 day after RTX or NE treatment. HFs from irradiated mice are used as positive controls. White arrowhead indicates the MeSCs with DNA damage (n = 30 HFs from 6 mice for each condition, one-way ANOVA with Tukey’s multiple comparisons). e, Immunofluorescent staining for pHH3 (green) and TRP2 (red) of control HFs at different hair cycle stages (n = 25 HFs from 3 mice for each condition, one-way ANOVA with Tukey’s multiple comparisons). f, Immunofluorescent staining of hair bulbs for aCAS3 (green) and TRP2 (red) from mice 1 day after RTX or NE injection (n = 30 HFs from 3 mice for each condition, one-way ANOVA with Tukey’s multiple comparisons). g, Immunofluorescent staining of hair bulbs for pHH3 (green) and TRP2 (red) from mice 1 day after RTX or NE injection (n = 30 HFs from 3 mice for each condition, one-way ANOVA with Tukey’s multiple comparisons). h, Left panel, schematic of MeSCs isolation strategy. Right panel, FACS analysis of MeSC numbers 1 day after RTX (n = 5 mice for each condition, two-tailed unpaired t-test). i, Fontana–Masson melanin staining of anagen or telogen samples 5 days after saline or RTX injection (n = 6 mice for each condition, two-tailed unpaired t-test). Blue arrowheads indicate ectopic pigments. Scale bars, 50 μm. All bar graphs are mean ± S.D.
Extended Data Fig. 7 |
Extended Data Fig. 7 |. Differential gene expression in normal and stressed MeSCs.
a, FACS strategy for MeSCs purification. MeSCs are selected based on their expression of CD117, from a population that is negative for CD140a, CD45, Sca1, CD34, and modest expression for Integrin alpha-6. b, Sample clustering based on Pearson’s correlation of transcriptome among control and stressed MeSCs (n = 2 biologically independent samples for each condition). c, Heatmap of all differentially expressed genes (n = 2 biologically independent samples for each condition, P values calculated using Wald test implemented in DESeq2, and adjusted using the Benjamini–Hochberg method. Log2FoldChange ≥ 0.58 and adjusted p value < 0.05). d, Expression level of marker genes for different cell types in the skin confirming the purity of MeSCs used for RNA-seq (n = 4 biologically independent samples). e, Heatmaps showing expression of signature genes related to MeSC differentiation. f, Heatmaps illustrating expression of cell cycle signature genes. g, qRT-PCR validation of selected differentially expressed genes in FACS-purified mouse MeSCs from control and RTX injected skins (n = 4 biological replicates for each condition, two-way ANOVA with original FDR method of Benjamini and Hochberg). All data are mean ± S.D.
Extended Data Fig. 8 |
Extended Data Fig. 8 |. Proliferation analysis of RTX-injected mice treated with CDK inhibitors chemically or genetically.
a-b, Immunofluorescent staining of upper HFs and hair bulbs for pHH3 (green) and TRP2 (red) from mice 1 day after RTX injection together with topical application of CDK inhibitors (AT7519 or Flavopiridol) or with MeSC-specific P27 overexpression (MeSC-P27 OE, n = 30 HFs from 3 mice for each condition, one-way ANOVA with Tukey’s multiple comparisons). Scale bars, 50 μm. All data are mean ± S.D.
Fig. 1 |
Fig. 1 |. Stress depletes melanocyte stem cells (MeSCs).
a, Black coat C57BL/6J mice are subjected to different stress models. b, Hair greying after resiniferatoxin (RTX) injection. Right, quantification of skin area covered by white hairs (n = 10 mice for each condition, two-tailed unpaired t-test). c, Liquid chromatography with tandem mass spectrometry (LC-MS-MS) quantifies serum stress hormone concentrations after injection of RTX alone or in combination with buprenorphine (Bup, n = 6 mice for each condition, one-way ANOVA with Tukey’s multiple comparisons). d, Injection of RTX with buprenorphine blocks white hair formation (n = 6 mice for each condition, two-tailed unpaired t-test). e, Upper panel, experimental design (black arrow: RTX injection, red arrows: harvesting). Lower panels, immunofluorescent staining for TRP2 (melanocyte lineage marker) in the hair follicle (HF) of control (Ctrl, saline-injected) and RTX injected mice (n = 30 HFs throughout the skin from 6 mice for each condition, two-way ANOVA with original FDR method of Benjamini and Hochberg). Yellow boxes denote the upper HF region where MeSCs reside. Enlarged views are shown to the right. Arrowheads: MeSCs. CUS: chronic unpredictable stress. D: day. Ana: anagen. Cata: catagen. Telo: telogen. Diff Mc: differentiated melanocytes. Scale bars, 50 μm. All data are mean ± S.D.
Fig. 2 |
Fig. 2 |. Norepinephrine drives hair greying.
a, Possible mechanisms of MeSC loss. b, RTX injection into Tyr-CreER; Adrb2 fl/fl (MeSC-Adrb2 cKO) mice fails to trigger hair greying (n = 6 mice for each condition, two-tailed unpaired t-test). c, White hair formation in norepinephrine injection sites (NE; n = 10 injected sites from 8 mice for each condition. Quantifications see Extended data Fig. 4e). Yellow dashed circles denote intradermal injection sites. d, White hair formation after RTX injection in adrenalectomized mice (ADX, n = 6 mice for each condition, two-tailed unpaired t-test). All data are mean ± S.D.
Fig. 3 |
Fig. 3 |. Hyperactivation of the sympathetic nervous system depletes MeSCs.
a, Sympathetic nerve innervates MeSC niches. White arrowhead indicates the close proximity of nerve endings to MeSCs (n = 6 mice for each condition). b, Immunofluorescent staining of sympathetic ganglia for tyrosine hydroxylase (TH, green) and c-FOS (red) from mice injected with saline, RTX, and RTX with buprenorphine (n = 6 ganglia from 3 mice for each condition, one-way ANOVA with Tukey’s multiple comparisons). c, 6-hydroxydopamine (6-OHDA) injection blocks MeSC loss and white hair induction by RTX (n = 30 HFs from 6 mice for each condition, two-tailed unpaired t-test. See also Extended data Fig. 5d). d, Left, schematic of sympathetic nerve activation using a Gq-DREADD system. Right, immunofluorescent staining for TH (green) and TRP2 (red) from TH-CreER; Gq-DREADD mice treated with saline or Clozapine N-Oxide (CNO, n = 30 HFs from 6 mice for each condition, two-tailed unpaired t-test). e, Mosaic activation of sympathetic nerves using TH-CreER; Gq-DREADD; Rosa-mT/mG mice. Bar graphs quantify the number of MeSCs in HFs innervated by DREADD negative sympathetic nerves (w/o DREADD) vs. DREADD positive sympathetic nerves (w/ DREADD, marked by membrane GFP expression). n = 30 HFs for each condition from 4 mice, two-tailed unpaired t-test. SN abla: sympathetic nerve ablation. Scale bars, 50 μm. All data are mean ± S.D.
Fig. 4 |
Fig. 4 |. Norepinephrine drives MeSCs out of quiescence.
a, Possible mechanisms by which norepinephrine depletes MeSCs. b, Immunofluorescent staining for Phospho-Histone H3 (pHH3, green) and TRP2 (red) 1 day after RTX or norepinephrine injection. White arrowhead highlights the proliferative MeSCs (n = 30 HFs from 5 mice for each condition, one-way ANOVA with Tukey’s multiple comparisons). c, Time-course of MeSC behaviour after RTX treatment in Tyr-CreER; R26-mT/mG mice. White arrowheads mark MeSCs (n = 30 HFs from 3 mice for each timepoint, one-way ANOVA with Tukey’s multiple comparisons). d, Fontana–Masson melanin staining 5 days after saline or RTX injection (n = 6 mice for each condition). Blue arrowheads indicate ectopic pigments. e, Model summarizing steps of stress-induced MeSC depletion. TAM: tamoxifen. Scale bars, 50 μm. All data are mean ± S.D.
Fig. 5 |
Fig. 5 |. Inhibition of aberrant MeSC proliferation prevents stress-induced hair greying.
a, Experimental workflow. FACS at telogen. b, Gene ontology enrichment analysis of significantly dysregulated genes in stressed MeSCs (n = 2 biologically independent samples for each condition, Fisher exact test). c, Heatmaps of signature gene expression related to MeSC proliferation (n = 2 biologically independent samples for each condition). d, qRT-PCR of MeSC proliferation and differentiation genes in cultured primary human melanocytes treated with norepinephrine (n = 6 samples from three independent donors, two-way ANOVA with original FDR method of Benjamini and Hochberg). e, Immunofluorescent staining for TRP2 (red) from mice 5 days after treatments of RTX together with AT7519, Flavopiridol, or with MeSC-specific P27 overexpression (P27 OE, n = 30 HFs from 6 mice each condition, one-way ANOVA with Tukey’s multiple comparisons). f, Topical treatment of AT7519, Flavopiridol, or MeSC-specific P27 overexpression inhibits RTX-induced hair greying (n = 6 mice for each condition, one-way ANOVA with Tukey’s multiple comparisons). g, Model summarizing the main findings. Under strong external stressors, activated sympathetic nerves secrete norepinephrine that binds to ADRB2 on MeSCs. NE-ADRB2 signalling drives rapid MeSC proliferation, followed by ectopic differentiation and exhaustion. Flavo: Flavopiridol. Scale bars, 50 μm. All data are mean ± S.D.

Comment in

References

    1. Ephraim AJ On sudden or rapid whitening of the hair. AMA Arch Derm 79, 228–236 (1959). - PubMed
    1. Navarini AA & Nobbe S Marie Antoinette syndrome. Arch Dermatol 145, 656–656 (2009). - PubMed
    1. Alexander GM et al. Remote control of neuronal activity in transgenic mice expressing evolved G protein-coupled receptors. Neuron 63, 27–39 (2009). - PMC - PubMed
    1. Zhu H et al. Cre-dependent DREADD (designer receptors exclusively activated by designer drugs) mice. genesis 54, 439–446 (2016). - PMC - PubMed
    1. Müller-Röver S et al. A comprehensive guide for the accurate classification of murine hair follicles in distinct hair cycle stages. Journal of Investigative Dermatology 117, 3–15 (2001). - PubMed

Publication types

MeSH terms