. 2020 Feb;578(7793):172-176.
doi: 10.1038/s41586-019-1928-2. Epub 2020 Jan 22.

Constructing protein polyhedra via orthogonal chemical interactions

Affiliations

Constructing protein polyhedra via orthogonal chemical interactions

Eyal Golub et al. Nature. 2020 Feb.

Abstract

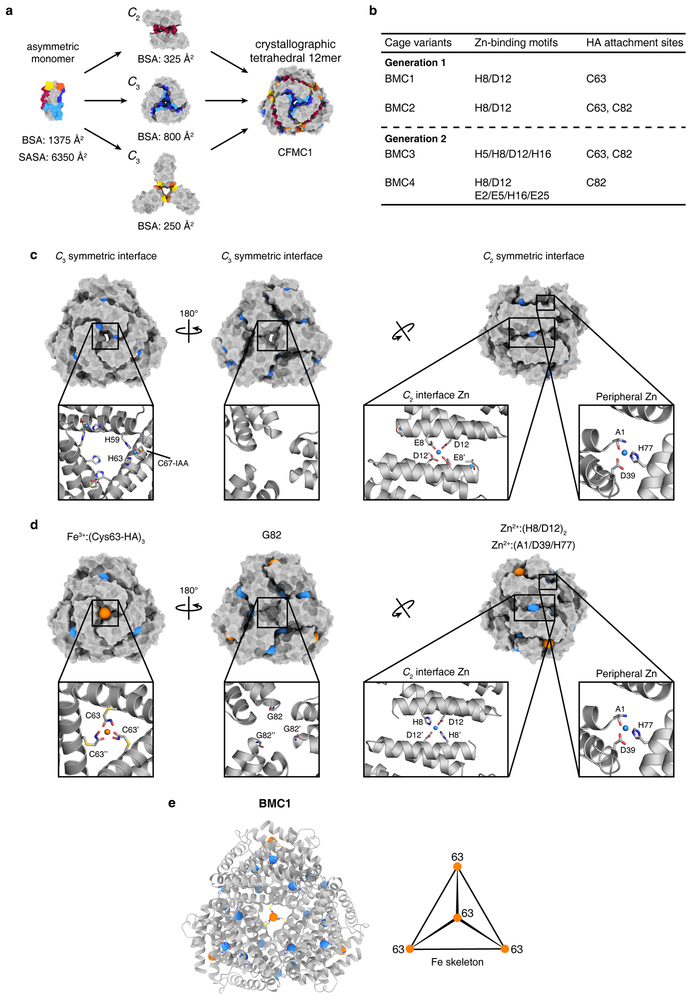
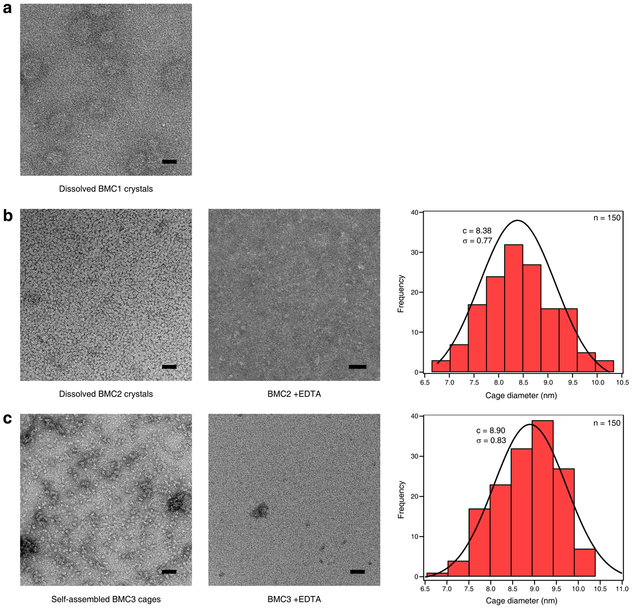
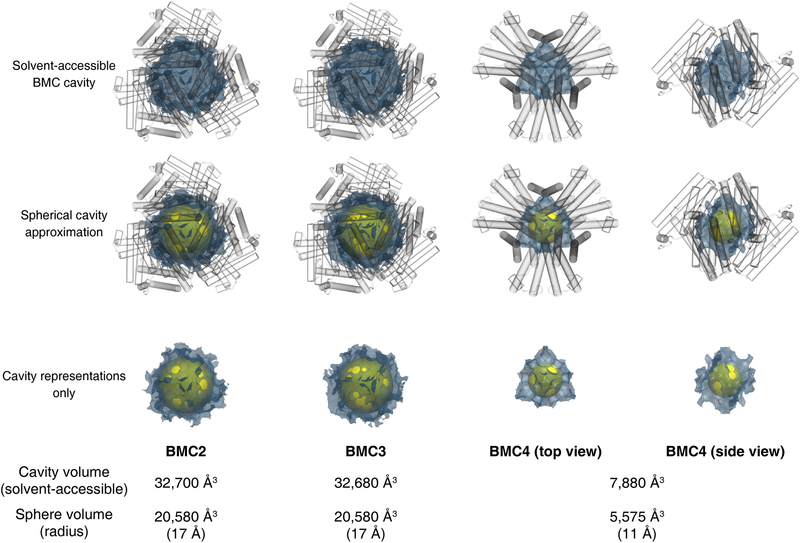
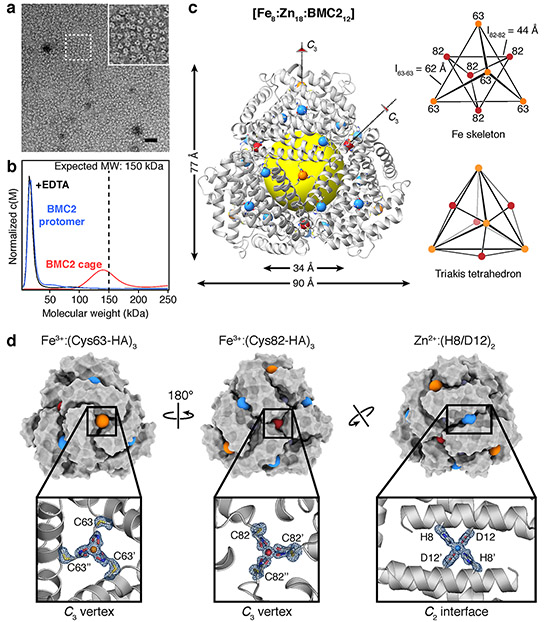
Many proteins exist naturally as symmetrical homooligomers or homopolymers1. The emergent structural and functional properties of such protein assemblies have inspired extensive efforts in biomolecular design2-5. As synthesized by ribosomes, proteins are inherently asymmetric. Thus, they must acquire multiple surface patches that selectively associate to generate the different symmetry elements needed to form higher-order architectures1,6-a daunting task for protein design. Here we address this problem using an inorganic chemical approach, whereby multiple modes of protein-protein interactions and symmetry are simultaneously achieved by selective, 'one-pot' coordination of soft and hard metal ions. We show that a monomeric protein (protomer) appropriately modified with biologically inspired hydroxamate groups and zinc-binding motifs assembles through concurrent Fe3+ and Zn2+ coordination into discrete dodecameric and hexameric cages. Our cages closely resemble natural polyhedral protein architectures7,8 and are, to our knowledge, unique among designed systems9-13 in that they possess tightly packed shells devoid of large apertures. At the same time, they can assemble and disassemble in response to diverse stimuli, owing to their heterobimetallic construction on minimal interprotein-bonding footprints. With stoichiometries ranging from [2 Fe:9 Zn:6 protomers] to [8 Fe:21 Zn:12 protomers], these protein cages represent some of the compositionally most complex protein assemblies-or inorganic coordination complexes-obtained by design.


Figures

Extended Data Figure 1 ∣
Extended Data Figure 1 ∣. Characterization of the IHA ligand and the BMC constructs.
NMR spectra of N-hydroxy-2-iodoacetamide in DMSO-d6: a, 1H b, 13C. ESI-MS of as-isolated and HA-functionalized BMC constructs, and AUC profiles of HA-functionalized protomers for c, BMC1 d, BMC2 e, BMC3 and f, BMC4. The calculated masses for each unlabeled protein are determined by summing the mass of the polypeptide sequence and the c-type heme (618 Da) covalently linked to the cytochrome.
Extended Data Figure 2 ∣
Extended Data Figure 2 ∣. Structural comparison of CFMC1 and BMC1 cages.
a, The symmetric substructures of the CFMC1 dodecameric unit and its per-protomer SASA and BSA values. Associative surfaces on the protomers are colored in red for homologous interactions and in red/orange or blue/cyan for heterologous interactions (right). b, Summary of engineered metal-coordination motifs for BMC constructs (see Supplementary Table 1 for all mutations). Comparison of C2 and C3 symmetric interfaces and corresponding metal binding sites for c, CFMC1 and d, BMC1. Full cages are shown as surfaces; insets show details of each interface. Fe and Zn ions are represented as orange and teal spheres, respectively. e, Cartoon representation of a full-size BMC1 cage with all metal ions shown as spheres. PDB ID: 3M4B (CFMC1), 6OT9 (BMC1).
Extended Data Figure 3 ∣
Extended Data Figure 3 ∣. ns-TEM characterization of BMC constructs.
Dissolved a, Fe:Zn:BMC1 and b, Fe:Zn:BMC2 crystals in a buffer containing 100 mM HEPES (pH 7.5), 200 mM MgCl2 and 800 μM ZnCl2. c, Self-assembled Fe:Zn:BMC3 cages in a buffer containing 20 mM Tris (pH 8.5), 20 μM FeSO4 and 60 μM ZnCl2. Histograms in b and c reflect the size distributions of Fe:Zn:BMC2 and Fe:Zn:BMC3 cage diameters as measured from ns-TEM images. Gaussian fits to both distributions are drawn as solid lines along with their centers and standard deviations reported. Scale bars are 50 nm.
Extended Data Figure 4 ∣
Extended Data Figure 4 ∣. Cavity volumes of BMC cages.
Solvent-accessible cavity volumes within BMC cages as calculated by a 1.4-Å rolling probe are shown visually as blue meshes and reported numerically below. Spherical cavities, shown as yellow spheres in Fig. 2 and Fig. 4, are reproduced for comparison to the calculated volumes. BMC proteins are represented as transparent cylinders.
Extended Data Figure 5 ∣
Extended Data Figure 5 ∣. Anomalous densities of engineered metal binding sites and conformational flexibility of Cys82-HA site.
Cartoon and stick representations of the a, b, BMC1, c-e, BMC2, f-h, BMC3, and i-j, BMC4 symmetric interfaces showing the engineered metal binding sites with the C63-HA ligands (a, c, f), C82-HA ligands (d, g, i) and the Zn binding sites (b,e,h,j). To discern between bound Zn or Fe, the difference of the anomalous signal between pairs of datasets above and below the K-shell energy of Zn and Fe respectively, are depicted as blue or orange meshes. A strong signal illustrates strong change in anomalous signal across the respective edge, in turn suggesting the presence of the respective metal. The upper right corner of each panel indicates the energies of the datasets used for the map of the respective color. All anomalous difference maps were contoured at 3 σ. As datasets around the Fe-edge were not available for BMC1 and BMC3 (necessitating calculations using anomalous difference density of singular datasets), the calculated f’’ for Zn at 7.3 and 9.3 keV are 0.82 and 0.52 (i.e. non-zero) and thus some residual anomalous signal of the lower energy maps around the Zn atoms is expected to result even from strictly selective Zn loading. For a more quantitative analysis of the nature of the bound metal, ratios of the anomalous signal to the expected values (lower left corner of each panel) were calculated as described in the Methods. k, Stick representation of the BMC2 Cys82-HA binding site in both alternative conformations with the anomalous difference density over the “Fe-edge” shown as orange mesh and a simulated annealing omit map (omitting all C82-HA atoms and Fe) of the normal electron density as light blue mesh contoured at 2 σ. For all Cys-HA binding sites, arrows indicate the handedness of the binding site as Δ (right handed) or Λ (left handed). The reversion of handedness in k with the respective view angle is indicated by arrows. Color code for atoms in all panels: Fe in orange, Zn in blue, S in yellow, O in red and N in dark blue.
Extended Data Figure 6 ∣
Extended Data Figure 6 ∣. Solution characterization of self-assembled BMC3 and BMC4 cages.
The oligomerization state of BMC3 cages as monitored by AUC measurements following: a, incubation with various first-row transition metal ions b, incubation with Zn2+ and Fe3+ (Fe(acetylacetonate)3) and c, Disassembly via sequestration of metal ions by EDTA. d, AUC profiles of BMC variants after equilibration for two hours at the indicated temperatures (top). Thermal unfolding of BMC variants as measured by circular dichroism spectroscopy at 222 nm (bottom). e, Treatment with chemical reductants of different reduction potentials. ns-TEM micrographs are shown for cage samples incubated with chemical reductants.
Extended Data Figure 7 ∣
Extended Data Figure 7 ∣. Cryo-EM analysis of BMC3 cages.
a, Representative cryo-EM micrograph and 2D class averages. b, Flowchart detailing image processing from collected movie stacks to final map. Additional details can be found in the Methods. c, FSC curves calculated between the half-maps (black line), atomic model to the unmasked full map (purple line) and atomic model to the masked full map (blue line). Resolution values are indicated at the gold-standard FSC 0.143 criterion. d, Local resolution estimates of the final reconstruction calculated using ResMap. e, Electron density shown at BMC3 C3 interfaces highlighting poorly-resolved density (reflecting high flexibility) at hydroxamate sites and multiple conformations of W66.
Extended Data Figure 8 ∣
Extended Data Figure 8 ∣. Encapsulation of rhodamine inside BMC3 cages.
a, Fluorescence characterization of BMC3 samples incubated with rhodamine. Cages encapsulating rhodamine were treated with EDTA and washed prior to measuring fluorescence intensity. b, AUC profiles of cages encapsulating rhodamine monitored at the heme Soret absorption maximum (λmax = 415 nm) and rhodamine absorption maximum (λmax = 555 nm). c, UV-vis characterization of BMC3 samples incubated with rhodamine. d, Difference spectra of BMC3 samples and BMC3 protomer shown in c. Free rhodamine dissolved in buffer is shown as dark-red dashes. e, Repeated fluorescence characterization of a solution containing BMC3 cages encapsulating rhodamine over several days. The sample was washed 3x prior to each fluorescence measurement.
Figure 1 ∣
Figure 1 ∣. Design of protein cages.
a, Representative examples of natural protein cages (DNPEP – aspartyl aminopeptidase, HuHF – human heavy-chain ferritin) and their assembly from asymmetric protomers. Per-protomer solvent-accessible surface areas (SASA) and buried surface areas (BSA) are indicated. Associative surfaces on the protomers are colored in red for homologous interactions and in orange/yellow or blue/cyan for heterologous interactions. b, C2-symmetric protein dimerization induced by tetrahedral Zn2+ coordination of native amino acid sidechains. c, C3-symmetric protein trimerization induced by octahedral Fe3+-tris-hydroxamate coordination. d, Scheme showing modification of native Cys sidechains with IHA to yield Cys-HA, which is isosteric with arginine (light grey). e, Zn-mediated solution dimerization and crystallization of CFMC1. f, Structural overview of the cytochrome cb562 scaffold. Salient structural elements are shown as sticks.
Figure 2 ∣
Figure 2 ∣. Characterization of BMC2 cages.
a, ns-TEM of BMC2 cages obtained by the dissolution of 3D crystals; the inset is a close-up of the boxed region. Scale bar = 50 nm. b, AUC characterization of BMC2 protomers, BMC2 cages after crystal dissolution and after subsequent treatment with EDTA. c, Crystal structure of the BMC2 cage. Fe and Zn ions are represented as orange/red and blue spheres, respectively. The central cavity is highlighted by a yellow sphere. Two types of C3 vertices formed by Fe:(Cys63-HA)3 and Fe:(Cys82-HA)3 coordination motifs form two superimposed tetrahedra to generate a triakis tetrahedron. d, Surface representations of the BMC2 cage, with metal ions shown as colored spheres. Atomic details of each metal coordination site are shown in the insets, with the mFo-DFc electron density omit map (blue mesh) contoured at 3 σ.
Figure 3 ∣
Figure 3 ∣. Characterization of BMC3 cages.
a, AUC characterization of BMC3 self-assembly. b, Surface representation of the BMC3 cage (as derived from the crystal structure), oriented to show the incorporation of two Zn ions at the C2 symmetric interface. c, 2.6-Å density map for the BMC3 cage as determined by cryo-EM. d, Atomic details of both Zn-binding sites of the 2-fold interface overlaid with the electron density mFo-DFc omit map from the crystal structure (left) and as observed for the cryo-EM structure (right). Additional sidechains and waters are shown for the cryo-EM structure to emphasize structural robustness of the interface. e, Overlay of the BMC3 X-ray and cryo-EM structures to highlight the isotropic expansion of the cage in the absence of crystallographic packing interactions.
Figure 4 ∣
Figure 4 ∣. Characterization of BMC4 cages.
a, AUC characterization of BMC4 self-assembly. b, Crystal structure of the BMC4 cage. Fe and Zn ions are represented as red and blue spheres, respectively. The central cavity is highlighted by a yellow sphere. The structural skeleton formed by Fe and Zn ions is shown below the structure. c, Surface representations of the BMC4 cage, with metal ions shown as colored spheres. Atomic details of each metal coordination site are shown in insets, with the mFo-DFc electron density omit maps (blue mesh) contoured at 3 σ. d, Comparison of the C2 symmetric protein interfaces in different BMC constructs. The residues 8 and 12, common to all constructs, are colored in purple. The slippage of the 2-fold helix interface to accommodate the hexameric architecture of BMC4 is indicated with red arrows. e, Comparison of the apical angle formed by the Fe:(Cys82-HA)3–mediated vertices in BMC3 and BMC4 cages.

Similar articles

Cited by

References

    1. Marsh JA & Teichmann SA Structure, Dynamics, Assembly, and Evolution of Protein Complexes. Annu. Rev. Biochem 84, 551–575 (2015). - PubMed
    1. Padilla JE, Colovos C & Yeates TO Nanohedra: Using symmetry to design self assembling protein cages, layers, crystals, and filaments. Proc. Natl. Acad. Sci. USA 98, 2217–2221 (2001). - PMC - PubMed
    1. Bai Y, Luo Q & Liu J Protein self-assembly via supramolecular strategies. Chem. Soc. Rev 45, 2756–2767 (2016). - PubMed
    1. Hamley IW Protein Assemblies: Nature-Inspired and Designed Nanostructures. Biomacromolecules (2019). - PMC - PubMed
    1. Churchfield LA & Tezcan FA Design and Construction of Functional Supramolecular Metalloprotein Assemblies. Acc. Chem. Res 52, 345–355 (2019). - PubMed

Publication types

MeSH terms