. 2020 Feb;578(7793):154-159.
doi: 10.1038/s41586-020-1946-0. Epub 2020 Jan 22.

Robust and persistent reactivation of SIV and HIV by N-803 and depletion of CD8+ cells

Affiliations

Robust and persistent reactivation of SIV and HIV by N-803 and depletion of CD8+ cells

Julia Bergild McBrien et al. Nature. 2020 Feb.

Erratum in

  • Author Correction: Robust and persistent reactivation of SIV and HIV by N-803 and depletion of CD8+ cells.
    McBrien JB, Mavigner M, Franchitti L, Smith SA, White E, Tharp GK, Walum H, Busman-Sahay K, Aguilera-Sandoval CR, Thayer WO, Spagnuolo RA, Kovarova M, Wahl A, Cervasi B, Margolis DM, Vanderford TH, Carnathan DG, Paiardini M, Lifson JD, Lee JH, Safrit JT, Bosinger SE, Estes JD, Derdeyn CA, Garcia JV, Kulpa DA, Chahroudi A, Silvestri G. McBrien JB, et al. Nature. 2020 Feb;578(7796):E21. doi: 10.1038/s41586-020-2002-9. Nature. 2020. PMID: 32015546

Abstract

Human immunodeficiency virus (HIV) persists indefinitely in individuals with HIV who receive antiretroviral therapy (ART) owing to a reservoir of latently infected cells that contain replication-competent virus1-4. Here, to better understand the mechanisms responsible for latency persistence and reversal, we used the interleukin-15 superagonist N-803 in conjunction with the depletion of CD8+ lymphocytes in ART-treated macaques infected with simian immunodeficiency virus (SIV). Although N-803 alone did not reactivate virus production, its administration after the depletion of CD8+ lymphocytes in conjunction with ART treatment induced robust and persistent reactivation of the virus in vivo. We found viraemia of more than 60 copies per ml in all macaques (n = 14; 100%) and in 41 out of a total of 56 samples (73.2%) that were collected each week after N-803 administration. Notably, concordant results were obtained in ART-treated HIV-infected humanized mice. In addition, we observed that co-culture with CD8+ T cells blocked the in vitro latency-reversing effect of N-803 on primary human CD4+ T cells that were latently infected with HIV. These results advance our understanding of the mechanisms responsible for latency reversal and lentivirus reactivation during ART-suppressed infection.


Conflict of interest statement

The authors of this paper declare no competing interests.

Figures

Extended Data Figure 1 |
Extended Data Figure 1 |. MT807R1 effectively depletes CD8+ T-cells in peripheral blood, lymph node, and rectum in addition to NK cells from the blood at day 7.
The percentage of CD8+ cells in the CD3+ population seven days post-depletion was compared to pre-depletion levels. Sample flow cytometry shows the absence of a CD8β+ cells as part of the CD3+ T-cell population after depletion in a, the peripheral blood, b, rectum, and c, lymph node and similar results were found across all CD8-depleted macaques (n=28 biologically independent samples). d, The percentage of CD8β+ cells as compared to pre-depletion baseline was calculated in all CD8-depleted animals (+/− N-803, n=28 macaques) across blood and tissue (no differences in CD8+ T-cell depletion were observed between groups 2 and 3 at day 7). A two-sided Friedman test was used to calculate statistically significance changes from the baseline across tissues. e, Depletion of NK cells in the peripheral blood was assessed one week following CD8 depletion alone (n=14 macaques) as compared to baseline. Statistical significance was calculated using Wilcoxon test. Mean ± SEM are shown.
Extended Data Figure 2 |
Extended Data Figure 2 |. Phenotypic changes to CD4+ T-cells following intervention.
Longitudinal flow cytometry analysis following N-803 alone (green, n=7 macaques), CD8 depletion alone (blue, n=14 macaques), and CD8 depletion with N-803 (red, n=14 macaques). a, CD4+ T-cell frequency. Percentage of b, naïve, c, stem cell memory (SCM), d, central memory (CM), e, transitional memory (TM), and f, effector memory (EM) CD4+ T-cells. Percentage of bulk CD4+ T-cells expressing g, PD-1, h, CD25, i, CD69, j, HLA-DR, k, CCR5, and l, CCR5 and Ki67 co-expression. m-q, CCR5 and r-v, Ki67 expression on CD4+ T-cell subsets. Sample means are indicated (±SEM), and two-sided Kruskal-Wallis tests were used to compare post-intervention values to pre-intervention baseline and (approximate P value summaries are provided).
Extended Data Figure 3 |
Extended Data Figure 3 |. SIV-associated genes and IL-15 subunit genes show a transient change in expression following treatment with N-803 alone.
RNA was extracted from sorted peripheral a, bulk CD4+ T-cells (CD3+, CD4+ CD8-,CD20-,CD14-), b, bulk CD8+ T-cells (CD3+,CD4-CD8+,CD20-,CD14), and c, NK cells (CD3-CD20-CD14-NKG2A+) and libraries were prepared, normalized, pooled, and clustered on flow cells for sequencing. RNAseq data was aligned to the MacaM v7.8 assembly of the Indian rhesus macaque genome. Transcripts were analyzed for alignment against a custom gene set with SIV host restriction factors, PPIA (capsid folding protein), SIV receptors, SIV receptor agonists, NFkB subunits (involved in mediating LTR transcription), IL-15 receptor subunits, and NFAT subunits.
Extended Data Figure 4 |
Extended Data Figure 4 |. Quantification of levels of cell-associated SIV RNA in peripheral CD4+ T cells prior to and following interventions.
Changes in expression of SIV-RNA in relation to the number of copies of CD4 following intervention with a, N-803 alone (n=7 macaques), b, CD8 depletion alone (n=7 macaques), and c, CD8 depletion with N-803 (n=7 macaques). Sample means are indicated (±SEM), and two-sided Wilcoxon tests were used to compare post-intervention values to pre-intervention baseline.
Extended Data Figure 5 |
Extended Data Figure 5 |. Level of virus reactivation correlated with the absence of CD8+ T-cells.
Correlation between CD8+ T-cell counts and viral load (SIV RNA copies/mL plasma) on day 0, day 3, and weekly through week 6 following intervention with a, CD8 depletion alone (n=103 samples from 14 macaques), and b, CD8 depletion with N-803 (n=112 samples from 14 macaques). The area-under-the-curve (AUC) and the average pre-intervention viral load following c, CD8 depletion alone (n=14 macaques), and d, CD8 depletion with N-803 (n=14 macaques). Correlation coefficients are calculated using the Spearman’s rank-order correlation (two-tailed, no adjustments). e-g, Longitudinal viral loads (top) and CD8+ T-cell counts (middle) following e, N-803 alone (n=7 macaques), f, CD8 depletion (n=14 macaques), and g, CD8 depletion with N-803 (n=14 macaques). The bottom panels provide animal color keys.
Extended Data Figure 6 |
Extended Data Figure 6 |. HIV-DNA, HIV-RNA, and human T-cell activation levels in HIV-infected, ART-suppressed BLT humanized mice intervened with N-803, CD8 depletion, or N-803 with CD8 depletion.
Seven days post-intervention with N-803 (green, n=4 BLT humanized mice), CD8 depletion (blue, n=4), or N-803 with CD8 depletion (red, n=4) to HIV-infected, ART-suppressed BLT humanized mice, a, total HIV-DNA, and b, cell-associated HIV-RNA were extracted from mononuclear cells isolated from the spleen, human thymus (huThy), and lymph node (LN, HIV-RNA only). Percentage of HLA-DR+, CD38+, CD25+, or HLA-DR+/CD38+ cells was measured in human CD4+ (left) or CD8+ (right) T-cells isolated from the c, spleen, or d, human thymus of HIV-infected, ART-suppressed BLT mice seven days post-intervention with N-803 (green, n=4), CD8 depletion (blue, n=4), or N-803 with CD8 depletion (red, n=4). Treatment groups were compared using a two-tailed Student’s t-test (a), or a Kruskal-Wallis test with a false discovery rate correction (b-d). Sample means are indicated by a horizontal bar (+/−SEM).
Extended Data Figure 7 |
Extended Data Figure 7 |. Phylogenetic trees of longitudinal SGA-derived Env amino acid sequences.
Phylogenetic trees were generated for six macaques receiving CD8 depletion with N-803 administration using Env sequences from the peak VL (red), pre-ART (blue), and reactivation time points (green). The Env sequence of the SIVmac239 clone used for infection is included in each tree (black). The horizontal bar below each tree indicates the genetic distance. Sequence clusters that are supported with bootstraps greater than 80% are indicated by an asterisk. Env sequences that contain a stop codon are indicated by an arrow.
Extended Data Figure 8 |
Extended Data Figure 8 |. Longitudinal Env amino acid divergence from the input virus and relationship with plasma viral load.
The number of amino acid differences between the infecting viral clone SIVmac239 and each SGA amplicon was determined using Geneious. a, A violin plot was created to show the frequency distribution of the number of amino acid differences between sequences at each time point in each macaque. The solid line indicates the median number of amino acid differences for each individual Env sequence, while the dotted lines indicate the quartiles. Peak VL (red), pre-ART (blue), and reactivation (green) time points are shown. The animal ID and the 3 time points are indicated below the graph. Statistical differences between time points for each macaque were determined by performing multiple comparisons using a Kruskal Wallis test with Dunn’s correction. b, The average number of sequence differences for each animal at the reactivation time point is plotted on the y-axis, and the corresponding plasma viral loads are plotted on the x-axis on a log10 scale. Correlation coefficients are calculated using the Spearman’s rank-order correlation (two-tailed, no adjustments).
Extended Data Figure 9 |
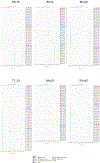
Extended Data Figure 9 |. Highlighter plots of longitudinal SGA-derived Env amino acid sequences.
Highlighter plots were generated for six representative macaques receiving CD8 depletion with N-803 administration using Env sequences from peak VL (red box), pre-ART (blue box), and reactivation (green box) time points. The Env sequence of the SIVmac239 clone used for infection is included as the master (reference) sequence in each plot. The position of N-linked glycosylation sites on the master sequence are indicated by pink circles. Each tick represents an amino acid difference from the master sequence, as is indicated by the legend. Blue diamonds indicate the loss of an N-linked glycosylation site.
Figure 1 |
Figure 1 |. Study design and phenotypic/transcriptomic effects of N-803 with or without CD8 depletion in rhesus macaques.
a, IL-15 Superagonist N-803 structure. b, Study design. At intervention phase, green arrows designate 100 μg/kg N-803 administration and blue arrows designate 50 mg/kg MT807R1 administration. c, Plasma viral load pre-intervention (n=35 macaques), including infection and initiation of antiretroviral therapy (gray bar). Limit of detection is 60 copies of SIV RNA/mL of plasma (black bar). d, Mean peripheral CD4+ T-cell (maroon), CD8+ T-cell (purple), and NK cell (gray) count and e, percentage of CD4+ and CD8+ T-cells in the lymph node, and f, Ki67 expression in cellular subsets post-intervention with N-803 (n=7 biologically independent samples). g, Ki67 expression in bulk CD4+ T-cells following N-803 alone (green, n=7 biologically independent samples), CD8 depletion alone (blue, n=14 biologically independent samples), and CD8 depletion with N-803 administration (red, n=14 biologically independent samples). Day 3 was included in peripheral blood analyses. h, Gene set enrichment analysis (GSEA) of RNA sequencing data from bulk CD4+ T-cells comparing gene sets enriched on day 3 post-intervention with N-803 alone (green, n=7 biologically independent samples), CD8 depletion alone (blue, n=7 biologically independent samples), or CD8 depletion with N-803 (red, n=7 biologically independent samples). Normalized enrichment scores for select upregulated gene sets are depicted, where normalization is group specific. A normalized enrichment score cutoff of greater than 1.35 for upregulated gene sets with a false discovery rate of less than 0.2 was used, in accordance with GSEA guidelines. i, Heat map detailing enriched genes in bulk CD4+ T-cells in the IL-2/STAT-5 signaling gene set after administration of N-803 alone (n= 7 biologically independent samples). Heat map colors represent log2 transformed library size normalized read counts scaled to unit variance across transcript vectors and normalized to the baseline median sample value of each transcript. Sample means are indicated (±SEM), and two-sided Kruskal-Wallis tests (d, f) and Friedman tests (e,g) were used to compare post-intervention values to pre-intervention baseline and approximate P value summaries are provided.
Figure 2 |
Figure 2 |. SIV and HIV reactivation following CD8 depletion with N-803.
Plasma viral loads following intervention with a, N-803 alone (n=7 macaques), b, CD8 depletion alone (n=14 macaques), and c, CD8 depletion with N-803 (n=14 macaques). d, Longitudinal plasma viral loads macaques with fully suppressed viral load (<3 copies/mL of plasma) prior to CD8 depletion with N-803 administration. Comparison of viral load pre-intervention (PRE), post-intervention when CD8+ T-cells are <100 cells/μL blood (POST), and during CD8+ T-cell reconstitution >100 cells/μL blood (CD8 return) in macaques treated with e, CD8 depletion alone (n=14 macaques), and f, CD8 depletion with N-803 (n=14 macaques). Sample means are indicated (±SEM). g, Plasma viral loads following CD8 depletion with N-803 administration in SHIV162P3-infected macaques after six months of ART (n=5 macaques). Viral suppression <60 copies/mL represented via black bar (a-d,g) or dashed line (e-f) and the limit of detection for these assays was 3 copies/mL plasma. h, RNAscope determination of the percentage of SIV RNA+ lymph node cells expressing high levels (>4 copies) of viral RNA/cell one week after CD8 depletion with N-803. Plasma viral loads of HIV-infected, ART-treated humanized mice treated with i, N-803 alone (green, n=7 mice), j, CD8 depletion alone (blue, n=8 mice), and k, CD8 depletion with N-803 administration (red, n=8 mice) (limit of detection 346 copies/mL). Statistical significance was calculated using a two-sided Kruskal-Wallis test (e-f) or Wilcoxon test (h). Macaque animal code key provided in Extended Data Fig.5.
Figure 3 |
Figure 3 |. In vitro co-culture of latently-infected human CD4+ T-cells with autologous CD8+ T-cells results in decreased expression of HIV-GAG during LRA administration.
a, Schematic of HIV latency model used in these experiments. Memory CD4+ T-cells (mCD4+) are enriched on day 0, and infected in vitro on day 3 with HIV89.6. After infection, mCD4+ are maintained in the antiretroviral saquinavir to prevent viral spreading. On day 6, HIV-infected mCD4+ are cultured in the presence of TGF-beta, IL-7, conditioned medium from H-80 feeder cell line, and saquinavir, efavirenz and raltegravir (additional antiretrovirals). Cryopreserved autologous PBMC were thawed on day 8 and rested overnight (O/N) before enriching for total CD8+ (tCD8+) cells and then TCR activated for three days. On day 12, HIV-infected mCD4+ and TCR-activated tCD8+ are co-cultured in a 1:1 or 1:5 ratio in the presence of an LRA for three days (day 15). b, The frequency of HIV-GAG+ CD4+ T-cells was quantified by flow cytometry and the fold change compared to frequency in CD4 monocultures was calculated after exposure to anti-CD3/CD28, IL-15 superagonist N-803, or recombinant IL-15. Each color represents a unique donor (n=8 biologically independent samples) and sample averages (±SEM) are indicated by the grey bars. Statistical significance was measured using a matched one-way ANOVA.
Figure 4 |
Figure 4 |. CD8 depletion with N-803 administration does not decrease the size of the latent SIV viral reservoir.
Copies of total cell-associated SIV-DNA per 106 cells was determined in a-c, sorted bulk peripheral CD4+ T-cells, and d-f, frozen bulk lymph node cells before and after intervention with N-803 alone (a, n=7 and d, n=3 biologically independent samples), CD8 depletion alone (b, n=14 and e, n=5 biologically independent samples), and CD8 depletion with N-803 administration (c, n=14 and f, n=3 biologically independent samples). Two-sided Friedman tests (a-c) and Wilcoxon tests (d-f) were used to determine statistical significance between pre-treatment and post-treatment time points. For all comparisons p-values were >0.05. The sample means are indicated by the gray bars on each graph (±SEM). Viral rebound following ART interruption in animals that received intervention with g, N-803 alone (n=7 macaques), h, CD8 depletion alone (n=14 macaques), and i, CD8 depletion with N-803 administration (n=14 macaques). Assay limit of detection of 3 copies of SIV RNA/mL plasma, black bar represents viral loads <60 copies/mL and gray box indicates time points prior to ART interruption.

Comment in

References

    1. UNAIDS. UNAIDS Data 2017. Joint United Nations; Program on HIV/AIDS (2017).
    1. Chun TW et al. Presence of an inducible HIV-1 latent reservoir during highly active antiretroviral therapy. Proc Natl Acad Sci U S A 94, 13193–13197, doi:D - NLM: PMC24285 EDAT- 1997/12/16 MHDA- 1997/12/16 00:01 CRDT- 1997/12/16 00:00 PST - ppublish (1997). - PMC - PubMed
    1. Finzi D et al. Identification of a reservoir for HIV-1 in patients on highly active antiretroviral therapy. Science 278, 1295–1300 (1997). - PubMed
    1. Wong JK et al. Recovery of replication-competent HIV despite prolonged suppression of plasma viremia. Science 278, 1291–1295 (1997). - PubMed
    1. Siliciano JD et al. Long-term follow-up studies confirm the stability of the latent reservoir for HIV-1 in resting CD4+ T cells. Nature Medicine 9, 727–728, doi: 10.1038/nm880 (2003). - DOI - PubMed

Publication types

MeSH terms