. 2020 Jan;577(7792):665-670.
doi: 10.1038/s41586-020-1929-1. Epub 2020 Jan 22.

Ancient West African foragers in the context of African population history

Affiliations

Ancient West African foragers in the context of African population history

Mark Lipson et al. Nature. 2020 Jan.

Abstract

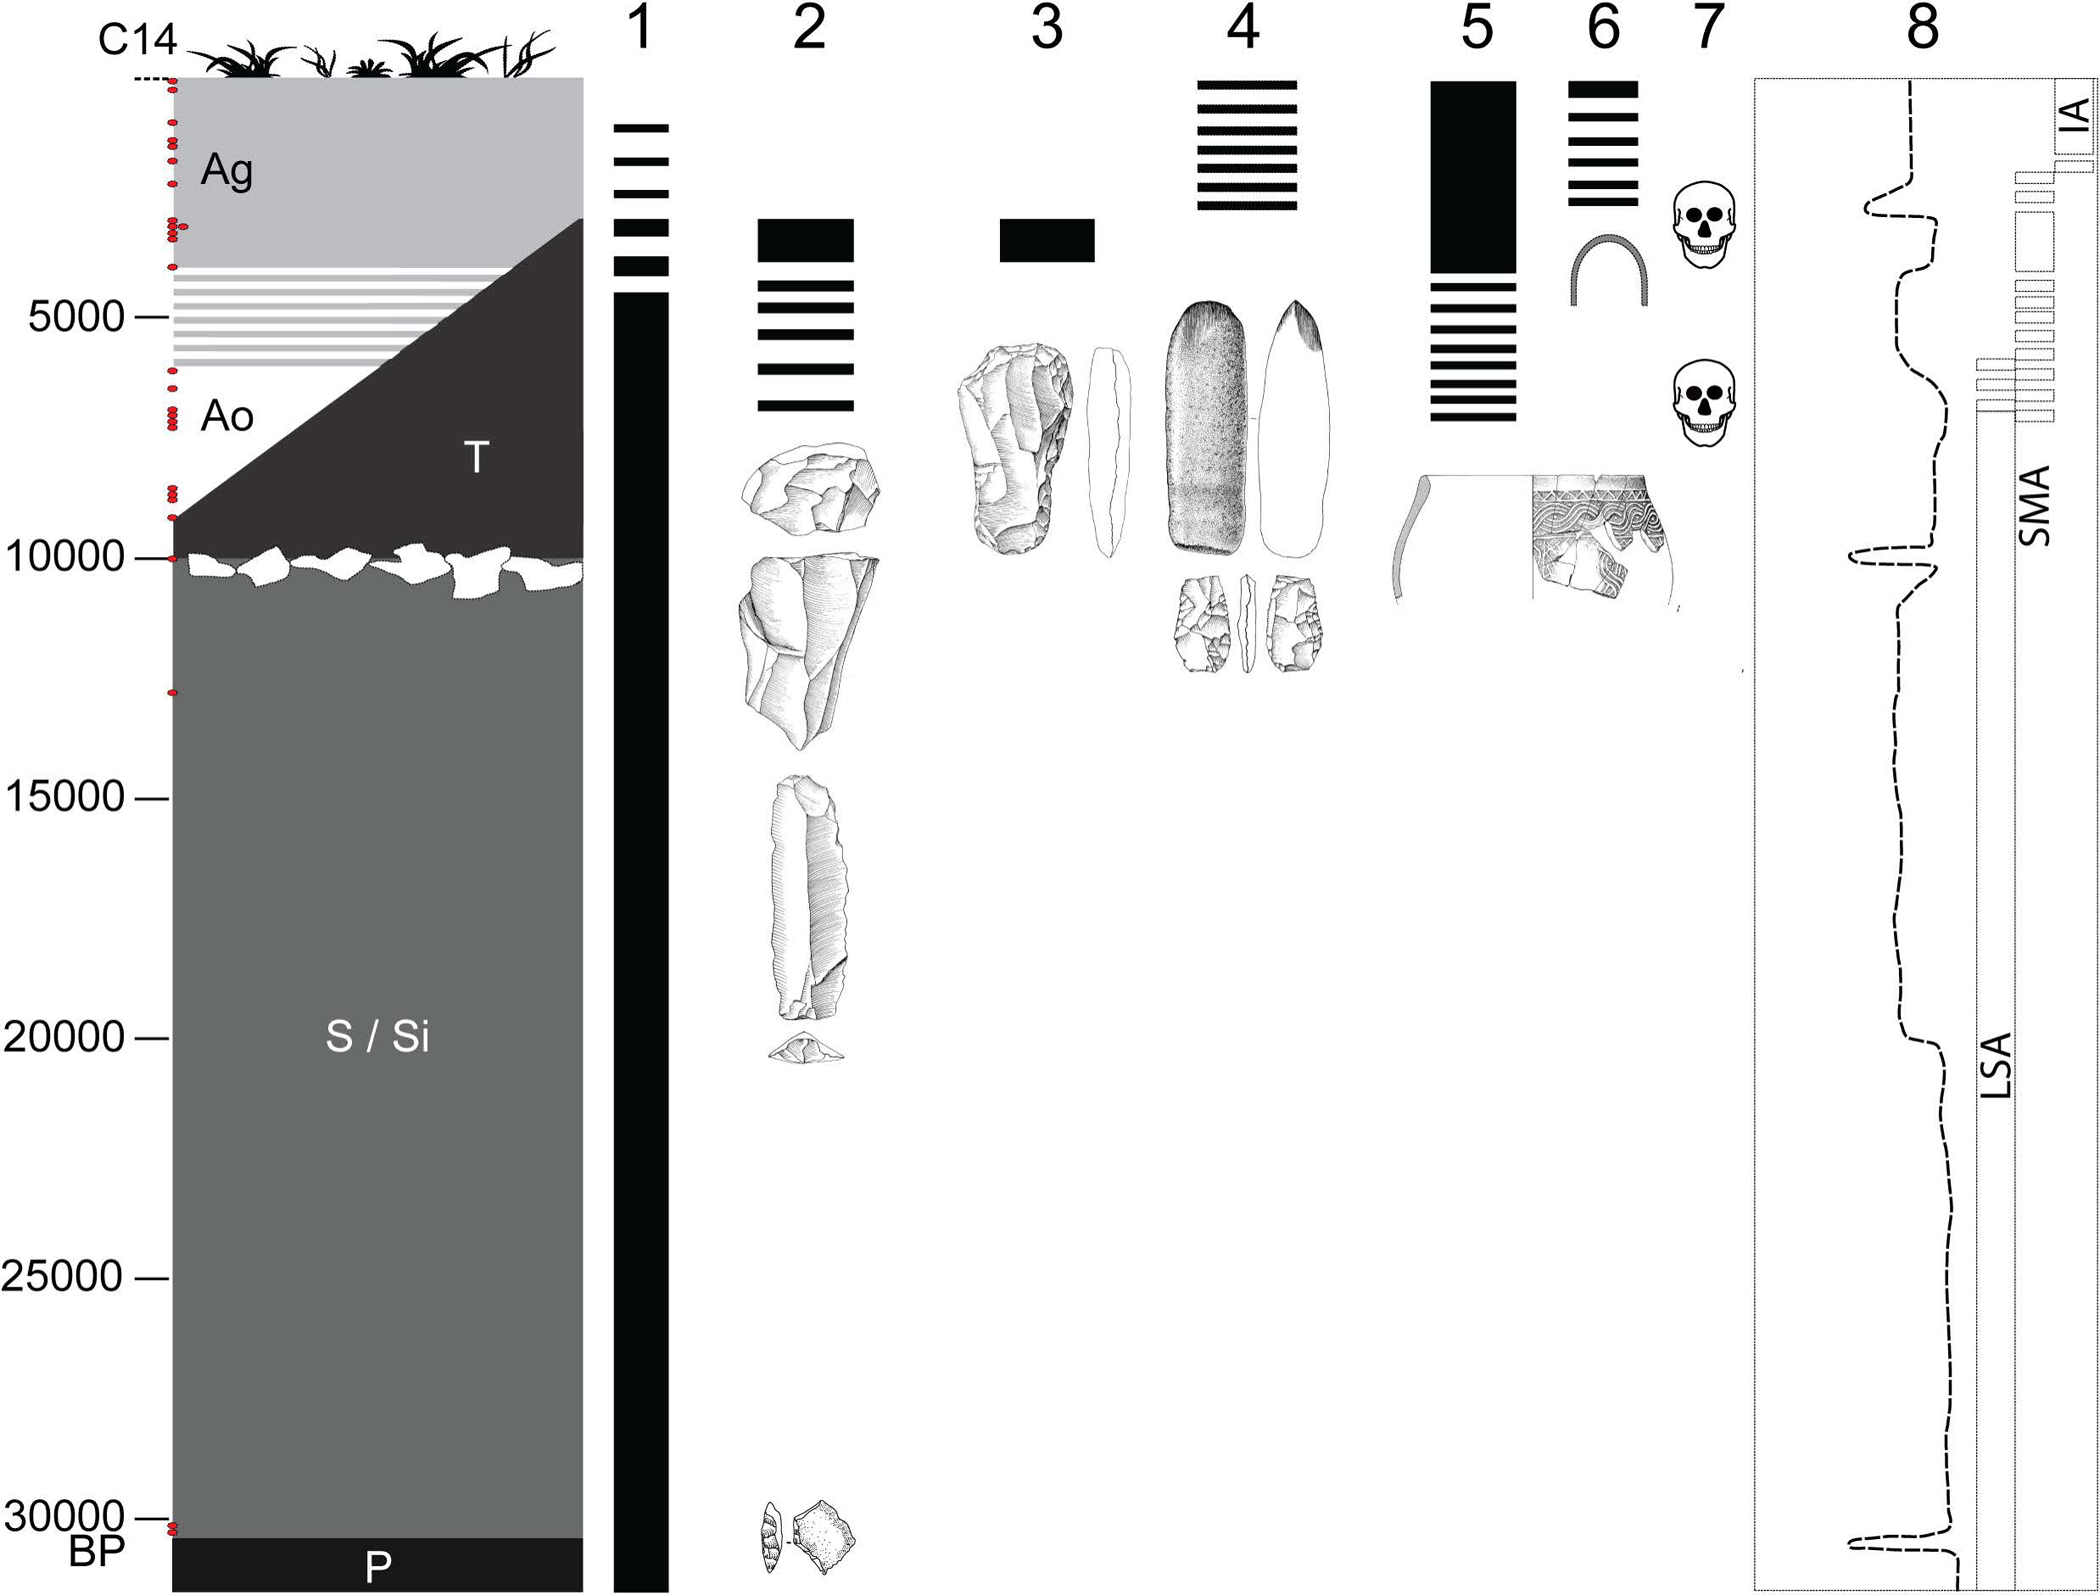
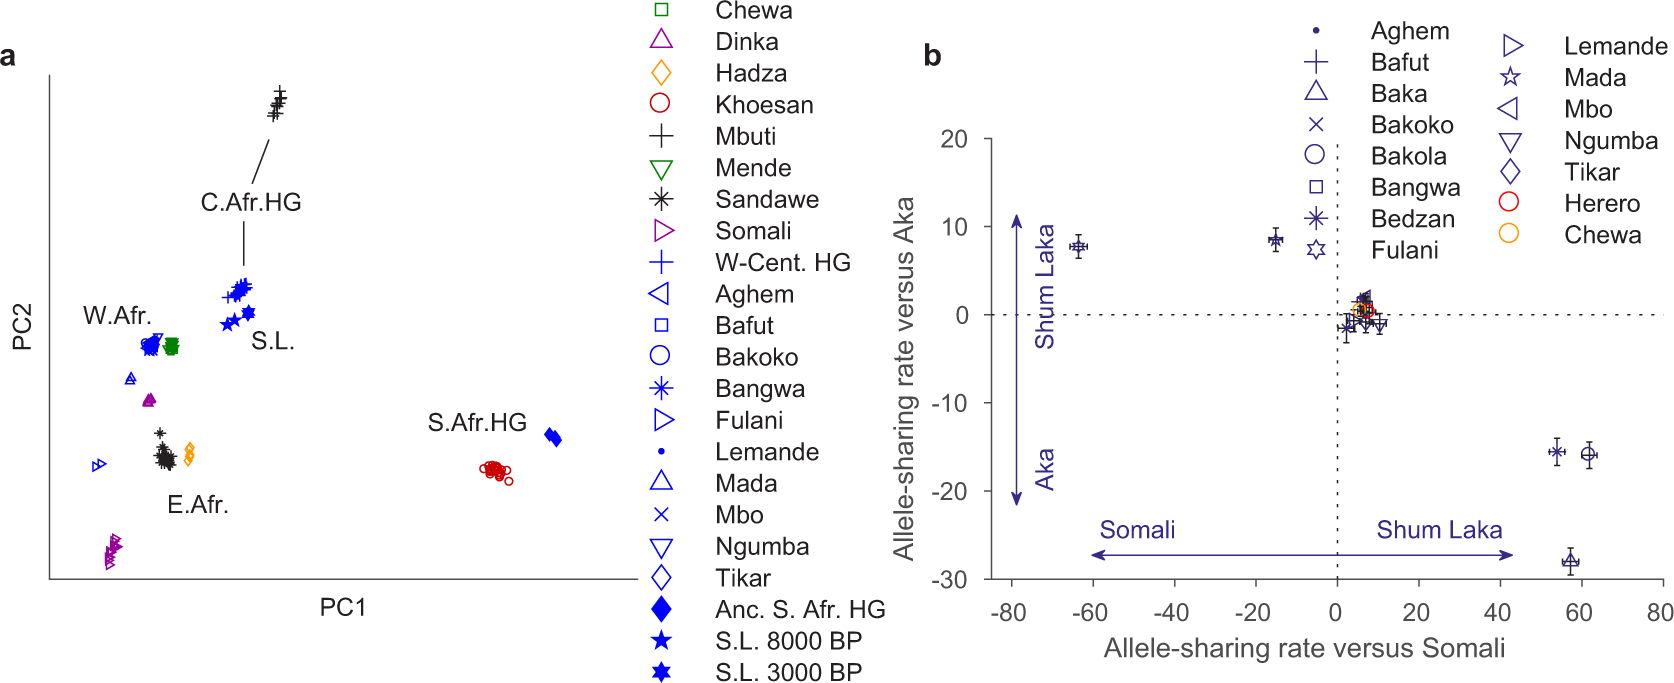
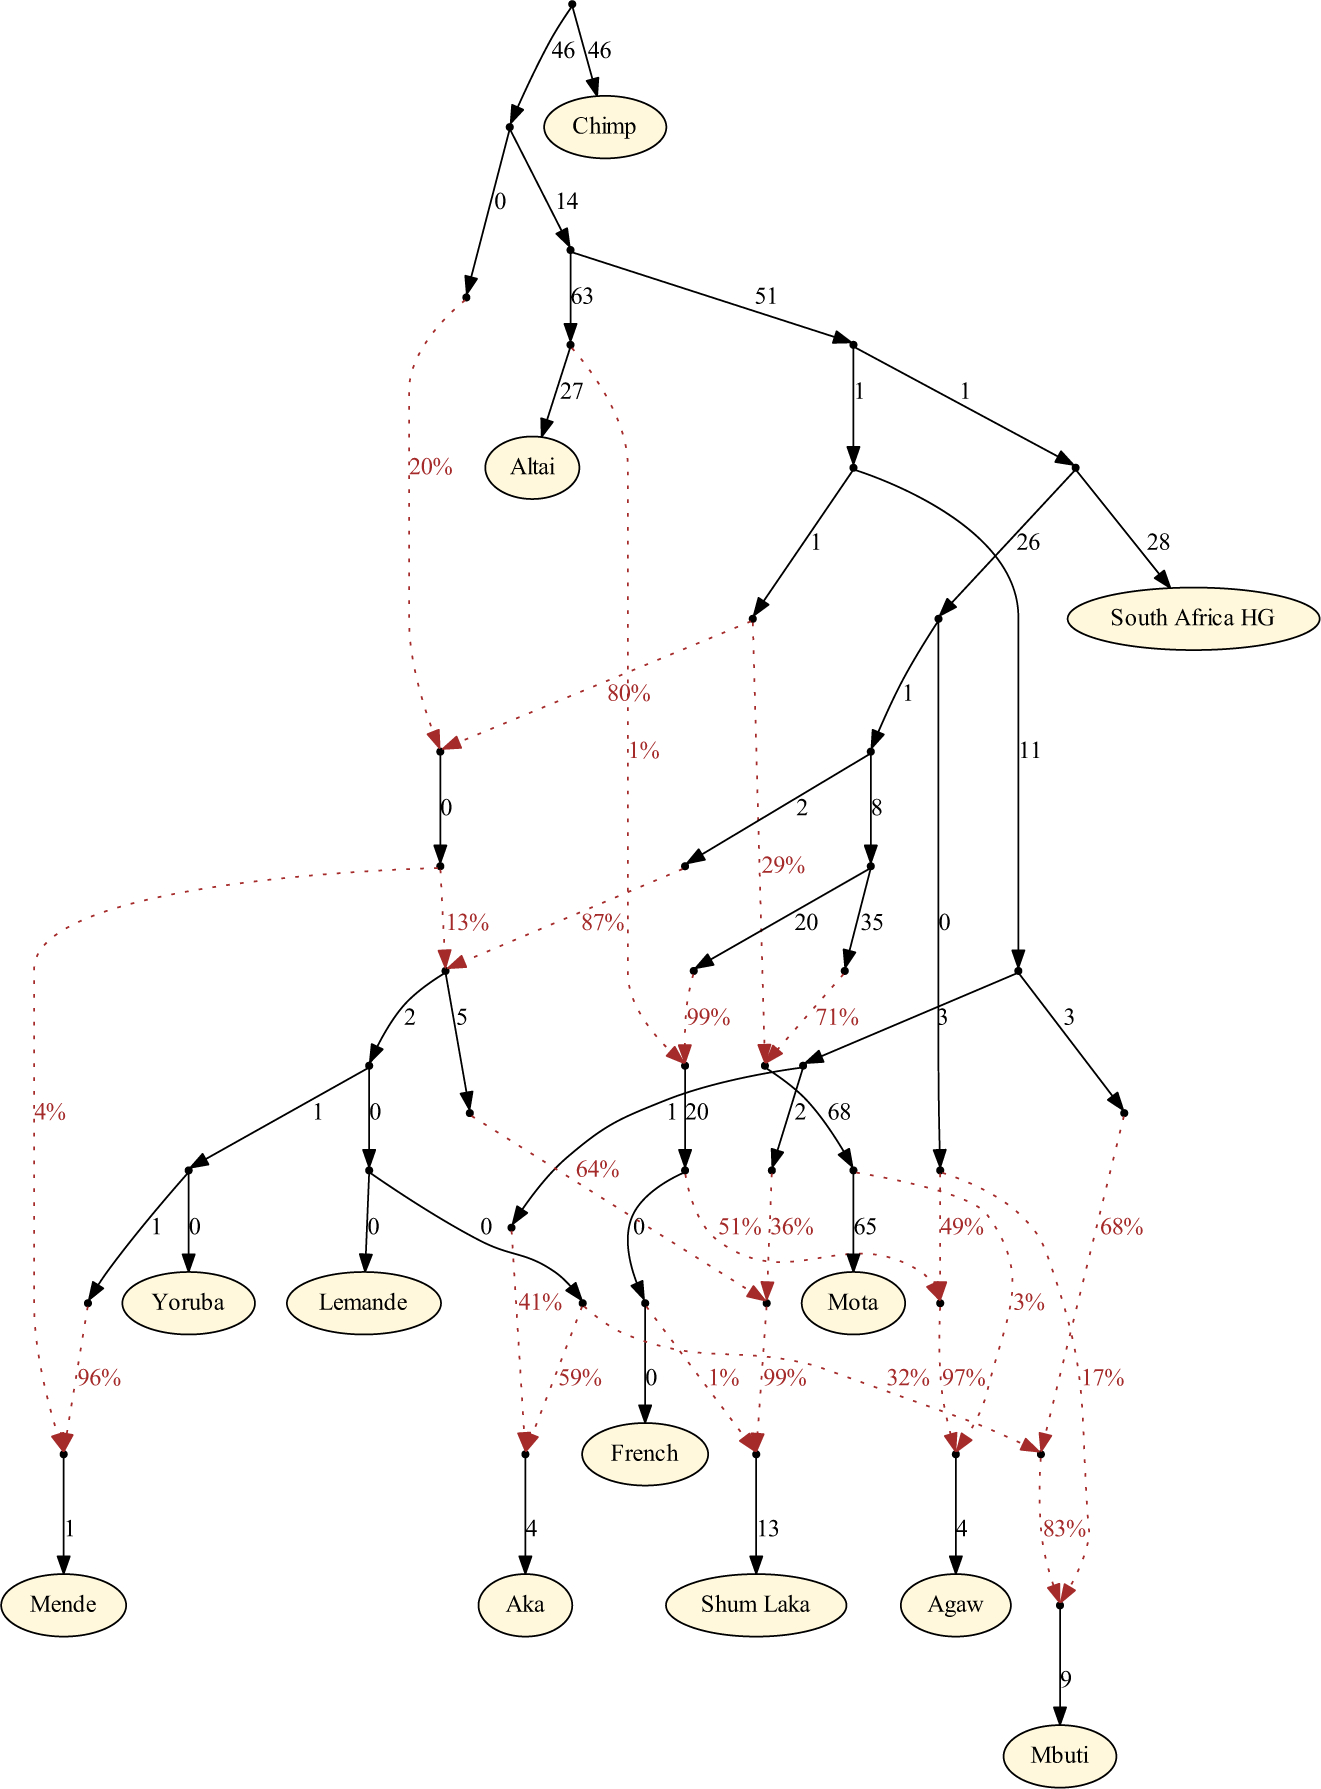
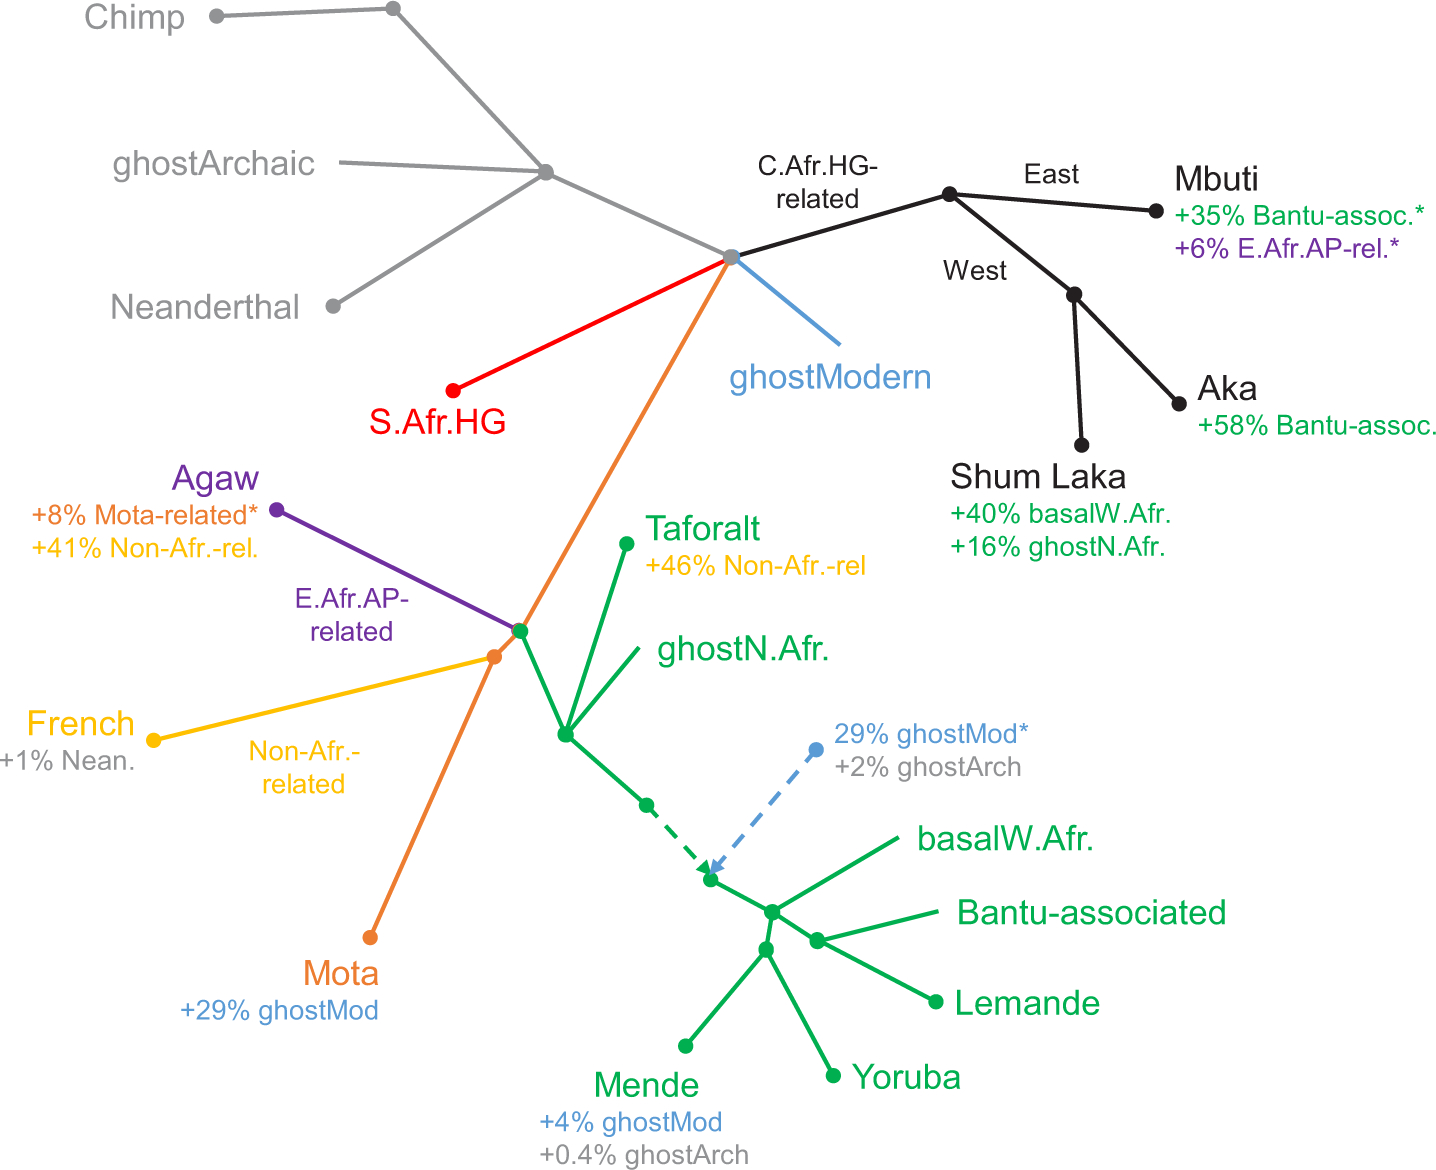
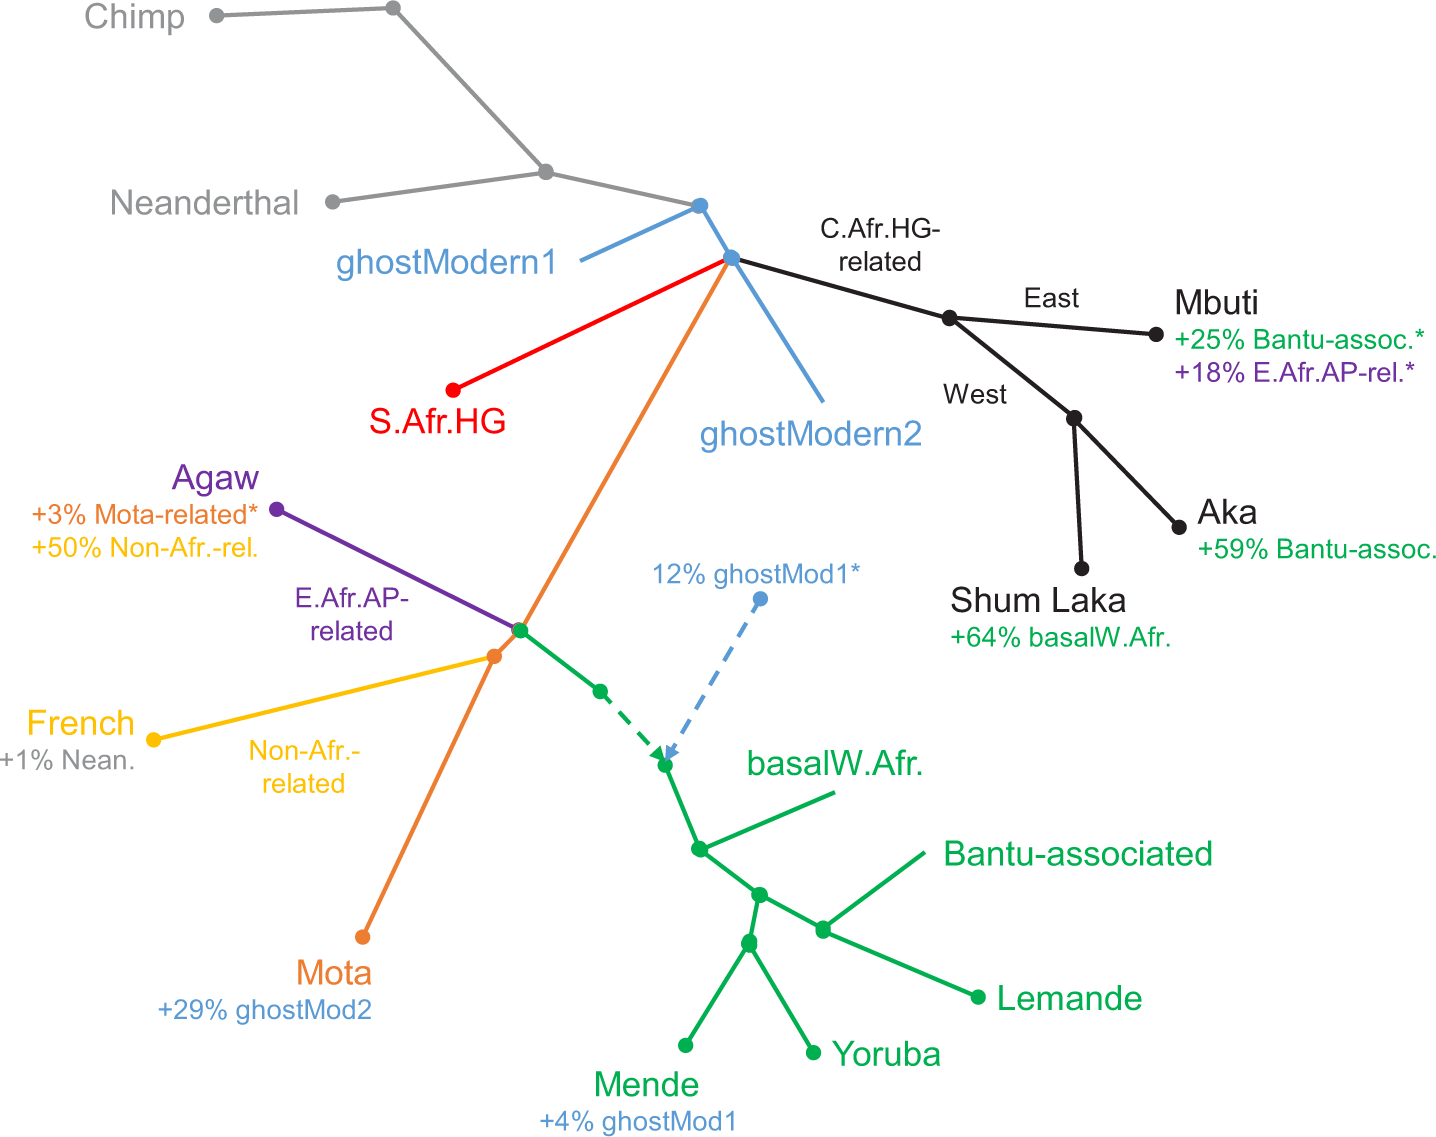
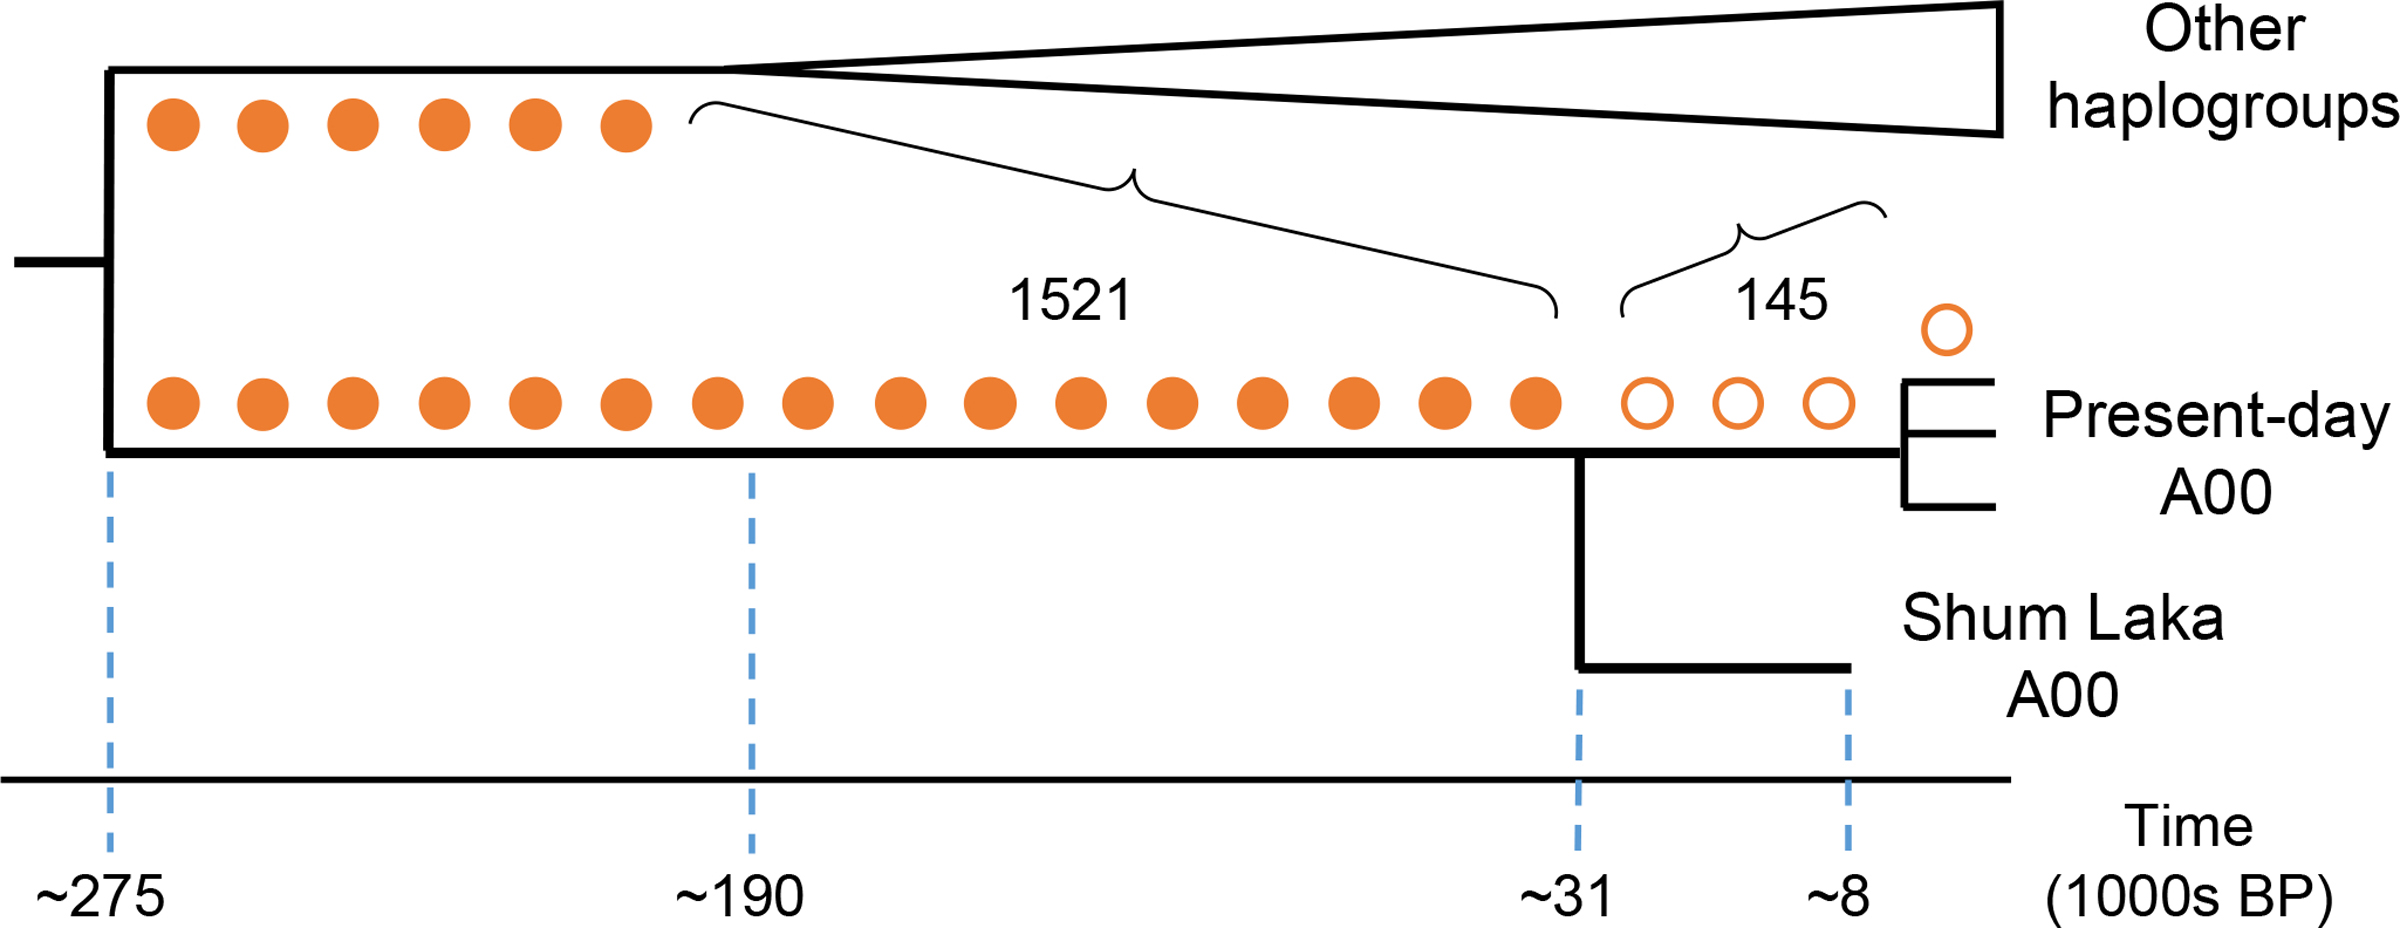
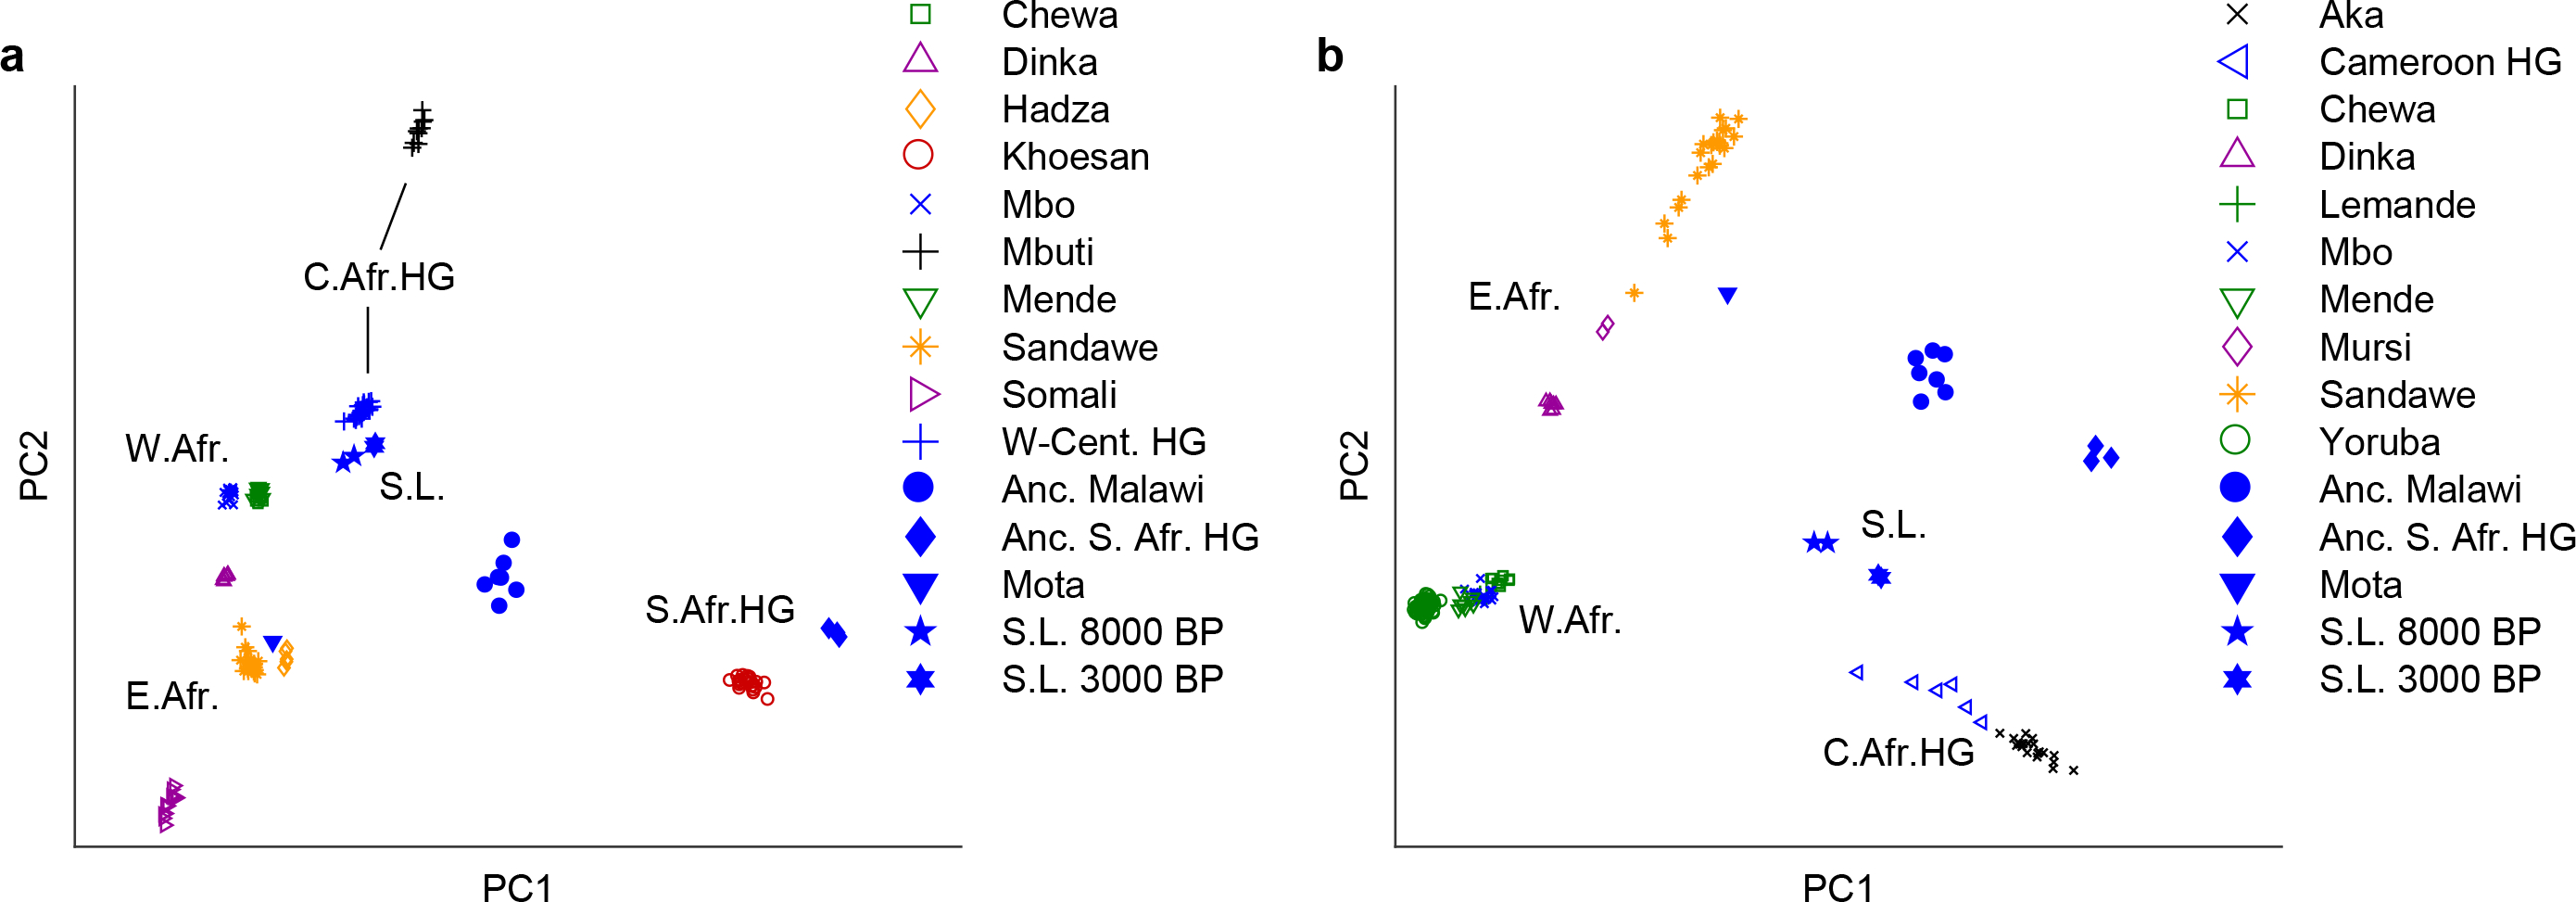
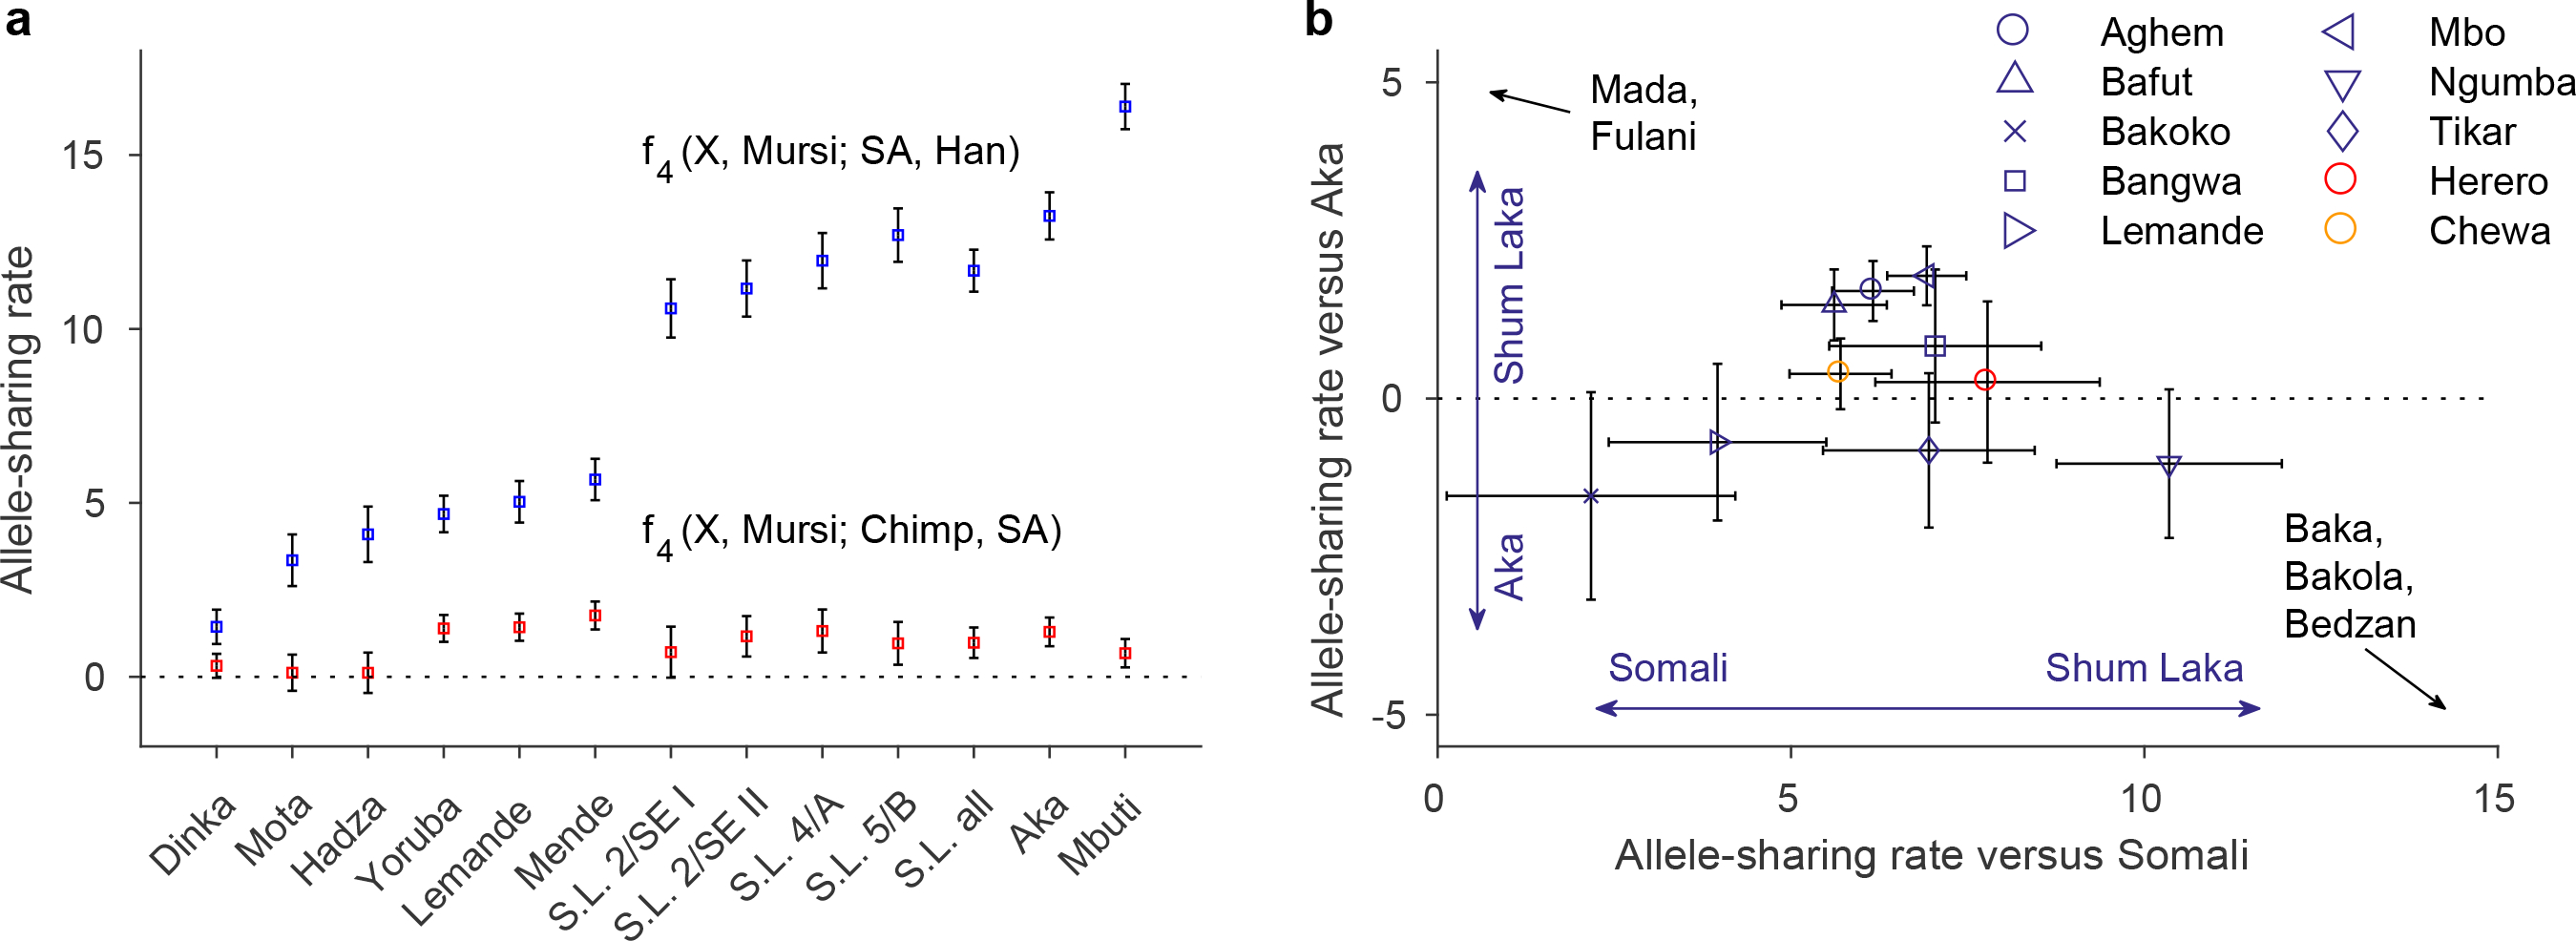
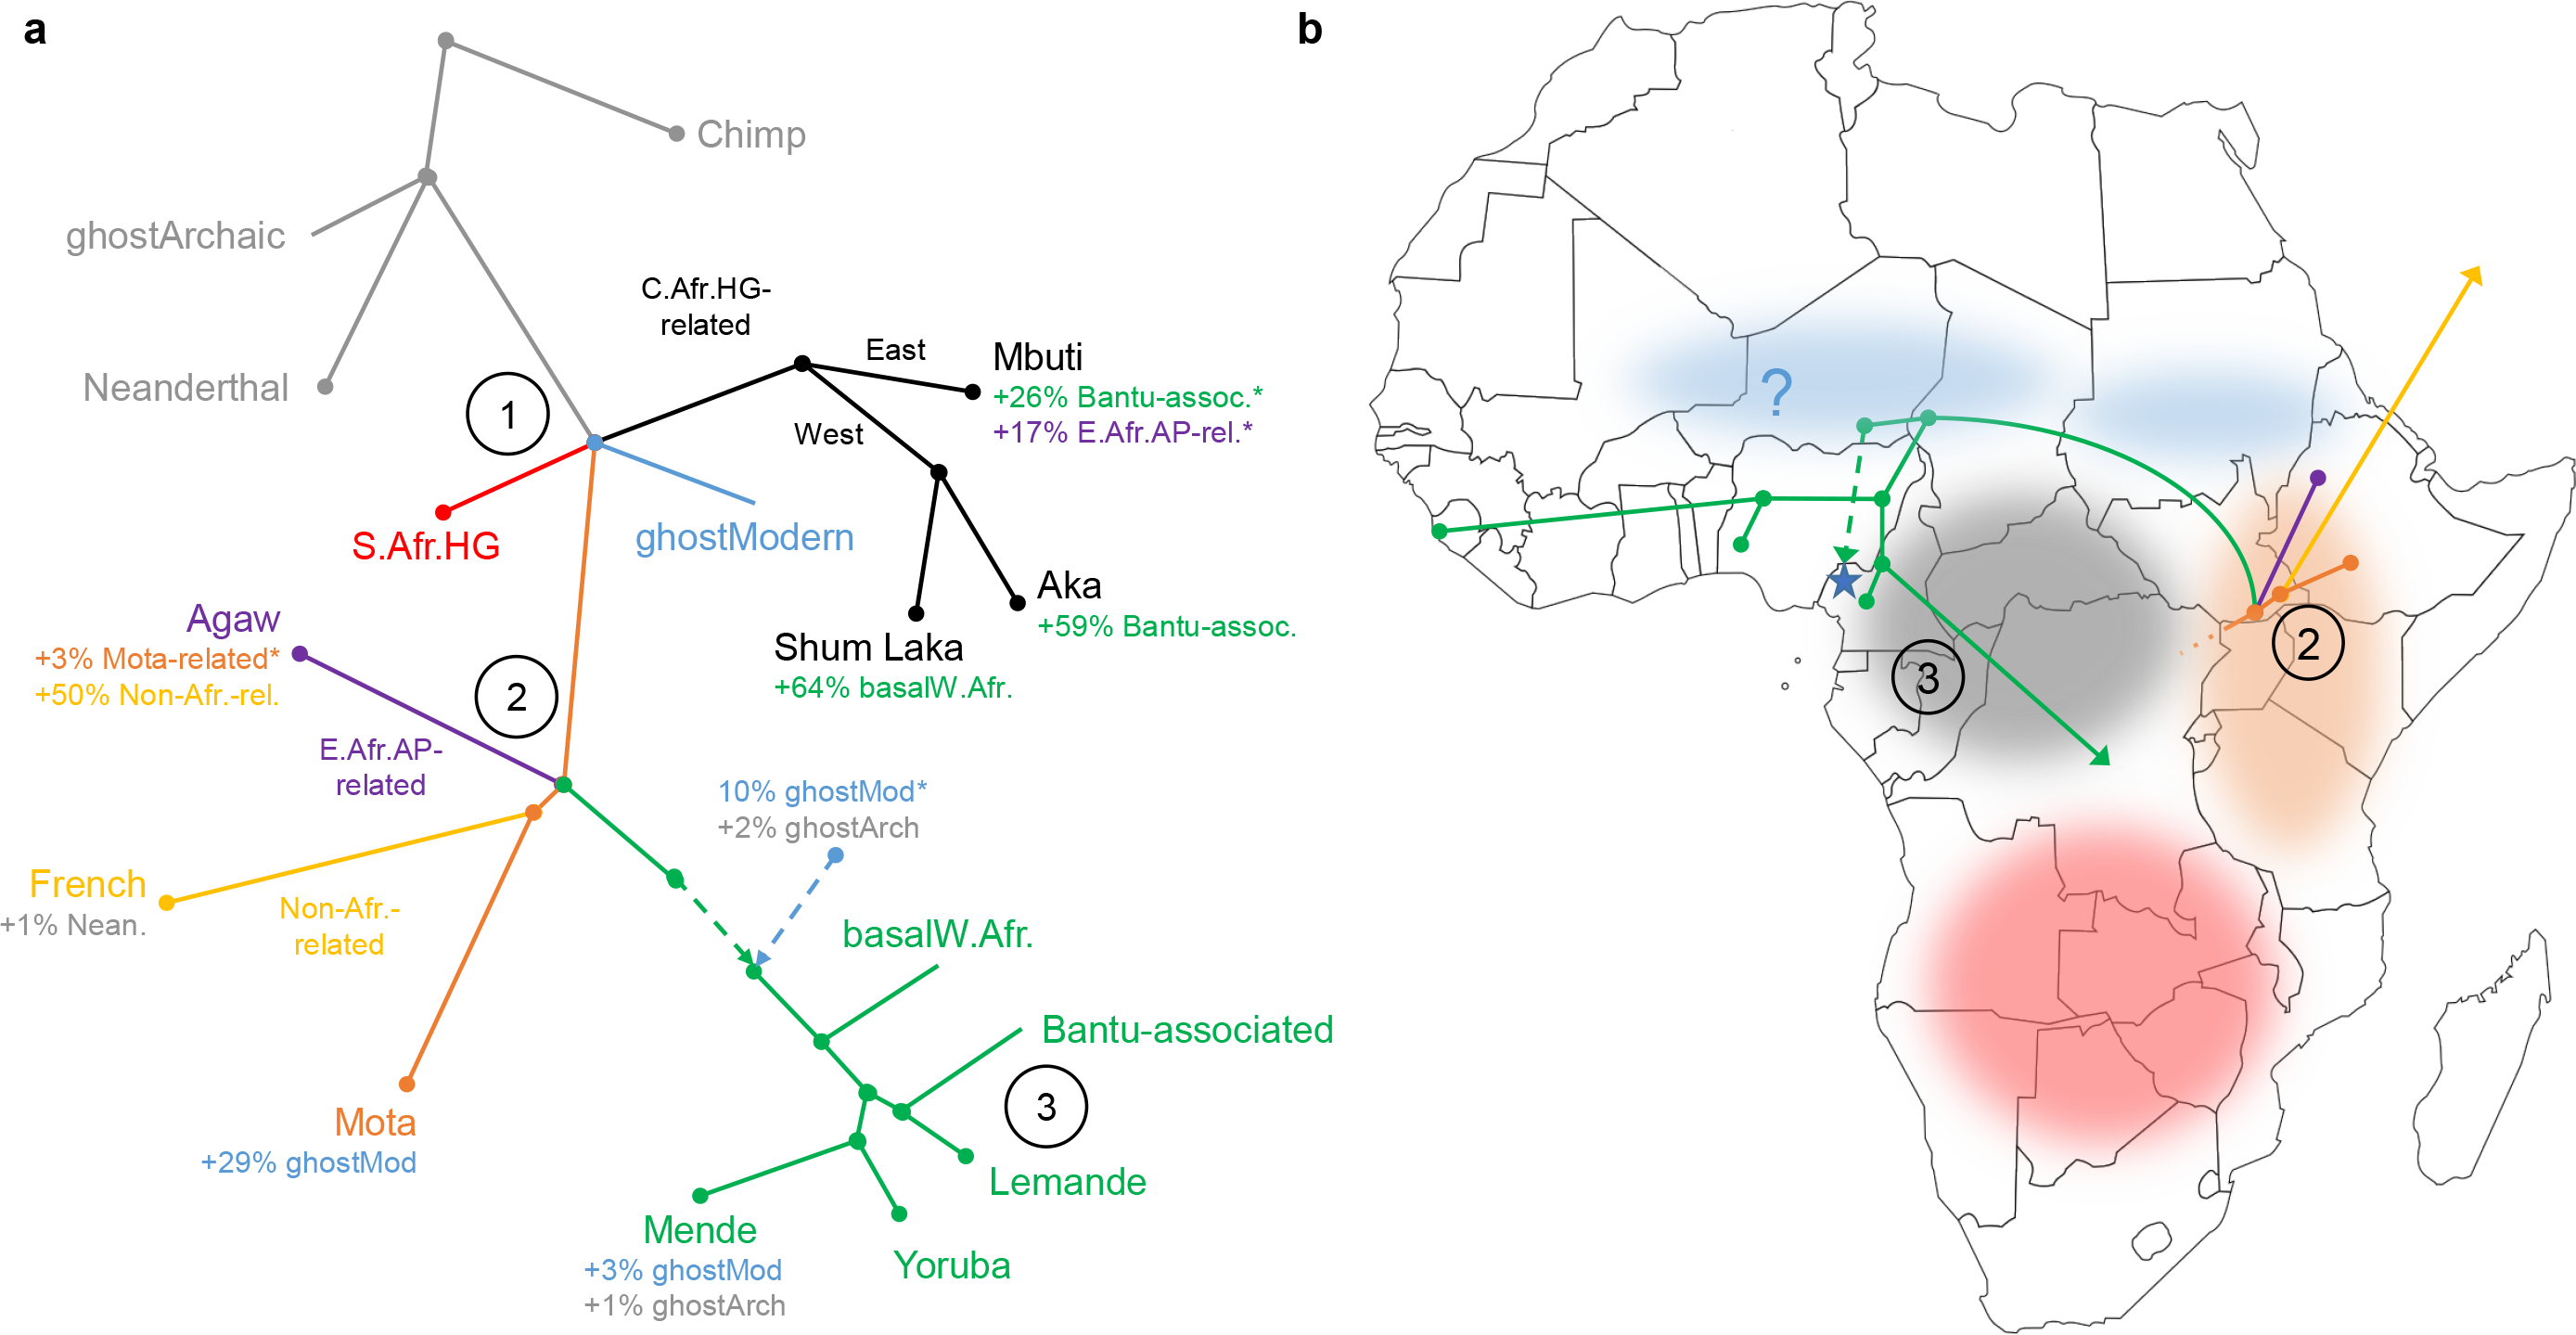
Our knowledge of ancient human population structure in sub-Saharan Africa, particularly prior to the advent of food production, remains limited. Here we report genome-wide DNA data from four children-two of whom were buried approximately 8,000 years ago and two 3,000 years ago-from Shum Laka (Cameroon), one of the earliest known archaeological sites within the probable homeland of the Bantu language group1-11. One individual carried the deeply divergent Y chromosome haplogroup A00, which today is found almost exclusively in the same region12,13. However, the genome-wide ancestry profiles of all four individuals are most similar to those of present-day hunter-gatherers from western Central Africa, which implies that populations in western Cameroon today-as well as speakers of Bantu languages from across the continent-are not descended substantially from the population represented by these four people. We infer an Africa-wide phylogeny that features widespread admixture and three prominent radiations, including one that gave rise to at least four major lineages deep in the history of modern humans.


Conflict of interest statement

Reprints and permissions information is available at www.nature.com/reprints. The authors declare no competing financial interests.

Figures

Extended Data Figure 1:
Extended Data Figure 1:. Overview of the site of Shum Laka.
The left column represents generalized stratigraphy, with radiocarbon dates (uncalibrated) shown as red dots on the y-axis, and deposits indicated by their archaeological nomenclature (P, S/Si = Pleistocene; T, A = Holocene; Ao = Holocene ochre ashy layer; Ag = Holocene gray ashy layer; after ref. [76]). Columns 1–6 display chronological extents of technological traditions: 1, microlithic quartz industry; 2, macrolithic flake and blade industry on basalt; 3, bifaces of the axe-hoe type; 4, pecked grounded adze and arrow heads; 5, pottery; and 6, iron objects. Column 7 indicates the two Shum Laka burial phases. Column 8 shows climatic reconstructions based on carbon stable isotopes and pollen from organic matter extracted from sediment cores at Lake Barombi Mbo in western Cameroon (more arid conditions to the left and more humid conditions to the right [60, 76]), along with archaeological eras (LSA, Later Stone Age; SMA, Stone to Metal Age; IA, Iron Age). RMCA Collection; Drawings Y. Paquay, composition © RMCA, Tervuren; modified by E. Cornelissen [77].
Extended Data Figure 2:
Extended Data Figure 2:. Kinship analysis.
Shown are mean genome-wide allelic mismatch rates for each pair of individuals (blue), as well as intra-individual comparisons (red). We selected one read per individual at random at each targeted SNP (using all 1,233,013 targeted sites). Monozygotic twins (or intra-individual comparisons) are expected to have a value one-half as large as unrelated individuals; first-degree relatives, halfway between monozygotic twins and unrelated individuals; second-degree relatives, halfway between first-degree relatives and unrelated individuals; and so on. The presence of inbreeding also serves to reduce the rates of mismatches. For 4/A and 5/B, because both died as children, we can eliminate a grandparent-grandchild relationship, and the lack of long segments with both homologous chromosomes shared IBD implies that they are not double cousins (the few ostensible double-IBD stretches are likely a result of inbreeding; see Supplementary Information section 2). Thus, we can conclude that they were either uncle and niece (or aunt and nephew) or half-siblings. Bars show 99% confidence intervals (computed by block jackknife).
Extended Data Figure 3:
Extended Data Figure 3:. Alternative PCA and allele-sharing analyses.
(A) Broad-scale PCA (differing from Fig. 2A by projecting all present-day Cameroon populations; again using 593,124 Human Origins SNPs). Groups shown in blue were projected onto axes computed using the other populations. HG, hunter-gatherers; S. L., Shum Laka. The W-Cent. HG grouping consists of Aka and Cameroon hunter-gatherers (Baka, Bakola, and Bedzan). The majority of the present-day Cameroon individuals fall in a tight cluster near other West Africans and Bantu speakers. (B) Relative allele sharing (mean ± SE, multiplied by 10,000, computed on 538,133 SNPs, as in Fig. 3B) with Shum Laka versus East Africans (f4 (X, Yoruba; Shum Laka, Somali); x-axis) and versus Aka (f4 (X, Yoruba; Shum Laka, Aka); y-axis) for present-day populations from Cameroon (blue points) and southern and eastern Bantu speakers (Herero in red and Chewa in orange). Mada and Fulani share more alleles with Shum Laka than with Aka, but this is likely a secondary consequence of admixture from East or North African sources (as reflected in greater allele sharing with Somali; see also Supplementary Information section 3). Bars show one standard error in each direction.
Extended Data Figure 4:
Extended Data Figure 4:. Primary inferred admixture graph with full parameters.
Of the ∼1.2M targeted SNPs, 932k are used for fitting (i.e., are covered by all populations in the model). Branch lengths (in units of squared allele frequency divergence) are rounded to the nearest integer. All f-statistics relating the populations are predicted to within 2.3 standard errors of their observed values.
Extended Data Figure 5:
Extended Data Figure 5:. Schematic of first alternative admixture graph.
Results are shown including ancient individuals from Taforalt in Morocco associated with the Iberomaurusian culture, with the Shum Laka individuals modeled as having a mixture of hunter-gatherer-related ancestry plus two additional components: one from within the main portion of the West African clade, and one splitting at nearly the same point as one of the sources contributing ancestry to Taforalt. Branch lengths are not drawn to scale. Points at which multiple lineages are shown diverging simultaneously indicate splits occurring in short succession (whose order we cannot confidently assess) but are not meant to represent exact multifurcations. HG, hunter-gatherer; AP, agro-pastoralist. Proportion not well constrained (for Mbuti, the sum of the two indicated proportions is well constrained but not the separate values). See Supplementary Information section 3 for full inferred model parameters.
Extended Data Figure 6:
Extended Data Figure 6:. Deep ancestry correlation from the West African clade.
An allele-sharing statistic sensitive to ancestry splitting more deeply than South African hunter-gatherers (f4 (X, Mursi; Chimp, South Africa HG), mean ± 2SE from block jackknife, computed on 1,121,119 SNPs, as in Fig. 3A) is shown as a function of West African-related ancestry (from admixture graph results; Mota, Yoruba, and Lemande shifted slightly away from the boundaries for legibility). The (relative) allele-sharing rate for Mursi is identically zero according to the definition of the statistic.
Extended Data Figure 7:
Extended Data Figure 7:. Schematic of second alternative admixture graph.
Results are shown with a single-component deep source for West Africans. Branch lengths are not drawn to scale. Points at which multiple lineages are shown diverging simultaneously indicate splits occurring in short succession (whose order we cannot confidently assess) but are not meant to represent exact multifurcations. HG, hunter-gatherer; AP, agro-pastoralist.*Proportion not well constrained (for Mbuti, the sum of the two indicated proportions is well constrained but not the separate values). See Supplementary Information section 3 for full inferred model parameters.
Figure 1:
Figure 1:. Y chromosome phylogeny.
Circles represent mutations along the (unrooted) A00 lineage where we observe the alternative (filled) or reference (empty) allele in the Shum Laka A00.
Figure 2:
Figure 2:. PCA results.
(A) Broad-scale analysis. (B) Narrow-scale analysis. Groups in blue (including ancient individuals, filled symbols) were projected onto axes computed using the other populations, using 593,124 SNPs (Methods). HG, hunter-gatherers; S.L., Shum Laka; W-Cent. HG, Aka plus Cameroon hunter-gatherers (Baka, Bakola, and Bedzan).
Figure 3:
Figure 3:. Allele-sharing statistics.
(A) Statistics sensitive to deep ancestry (mean ± 2SE, multiplied by 1000; blue, deeper than non-Africans; red, deeper than South African hunter-gatherers; computed on 1,121,119 SNPs). S.L., Shum Laka; SA, ancient South African hunter-gatherers. (B) Relative allele sharing (mean ± SE, multiplied by 10,000; computed on 538,133 SNPs) with Shum Laka versus East Africans (f4(X, Yoruba; Shum Laka, Somali); x-axis) and versus Aka (f4 (X, Yoruba; Shum Laka, Aka); y-axis) for present-day populations from Cameroon (blue) and southern (Herero, red) and eastern (Chewa, orange) Bantu speakers. See also Extended Data Fig. 3B.
Figure 4:
Figure 4:. Admixture graph results.
Points at which multiple lineages are shown diverging simultaneously indicate splits occurring in short succession (whose order we cannot confidently assess) but do not represent exact multifurcations. Key points are (1) early modern human split, (2) East African divergences, and (3) Bantu expansion. Branch lengths not drawn to scale. (A) Full model; see also Extended Data Fig. 4. HG, hunter-gatherer; AP, agro-pastoralist; *proportion not well constrained. (B) Geographical structure: shaded areas denote hypothesized historical locations of lineages descended from split point (1) in panel (A), and branching order is shown for populations descended from split point (2) (one ancestry component per population, with leaf nodes at sampling locations). The blue star represents Shum Laka (dashed line, possible direction of gene flow).

References

    1. de Maret P Shum Laka (Cameroon): human burials and general perspectives. In Pwiti G & Soper R (eds.) Aspects of African Archaeology: Papers from the 10th Congress of the Panafrican Association of Prehistory and Related Studies, 274–279 (University of Zimbabwe Publications, Harare, 1996).
    1. Ribot I, Orban R & de Maret P The Prehistoric Burials of Shum Laka Rockshelter (North-West Cameroon). In Annales du Musée Royal de l’Afrique Centrale, vol. 164 (Musée Royal de l’Afrique Centrale, Tervuren, Belgium, 2001).
    1. Lavachery P The Holocene archaeological sequence of Shum Laka rock shelter (Grassfields, western Cameroon). African Arch. Rev. 18, 213–247 (2001).
    1. de Maret P Archaeologies of the Bantu expansion. In Mitchell P & Lane P (eds.) The Oxford Handbook of African Archaeology, 627–643 (Oxford University Press, 2013).
    1. Cornelissen E Hunting and gathering in Africa’s tropical forests at the end of the Pleistocene and in the early Holocene. In Mitchell P & Lane P (eds.) The Oxford Handbook of African Archaeology, 403–417 (Oxford University Press, 2013).

Additional References

    1. Dabney J et al. Complete mitochondrial genome sequence of a Middle Pleistocene cave bear reconstructed from ultrashort DNA fragments. Proc. Natl. Acad. Sci. U. S. A. 110, 15758–15763 (2013). - PMC - PubMed
    1. Korlević P et al. Reducing microbial and human contamination in DNA extractions from ancient bones and teeth. BioTechniques 59, 87–93 (2015). - PubMed
    1. Briggs AW et al. Removal of deaminated cytosines and detection of in vivo methylation in ancient DNA. Nucleic Acids Res. 38, e87 (2010). - PMC - PubMed
    1. Lipson M et al. Ancient genomes document multiple waves of migration in Southeast Asian prehistory. Science 361, 92–95 (2018). - PMC - PubMed
    1. Fu Q et al. DNA analysis of an early modern human from Tianyuan Cave, China. Proc. Natl. Acad. Sci. U. S. A. 110, 2223–2227 (2013). - PMC - PubMed

Publication types

MeSH terms