. 2020 Feb;578(7793):160-165.
doi: 10.1038/s41586-020-1951-3. Epub 2020 Jan 22.

Systemic HIV and SIV latency reversal via non-canonical NF-κB signalling in vivo

Affiliations

Systemic HIV and SIV latency reversal via non-canonical NF-κB signalling in vivo

Christopher C Nixon et al. Nature. 2020 Feb.

Abstract

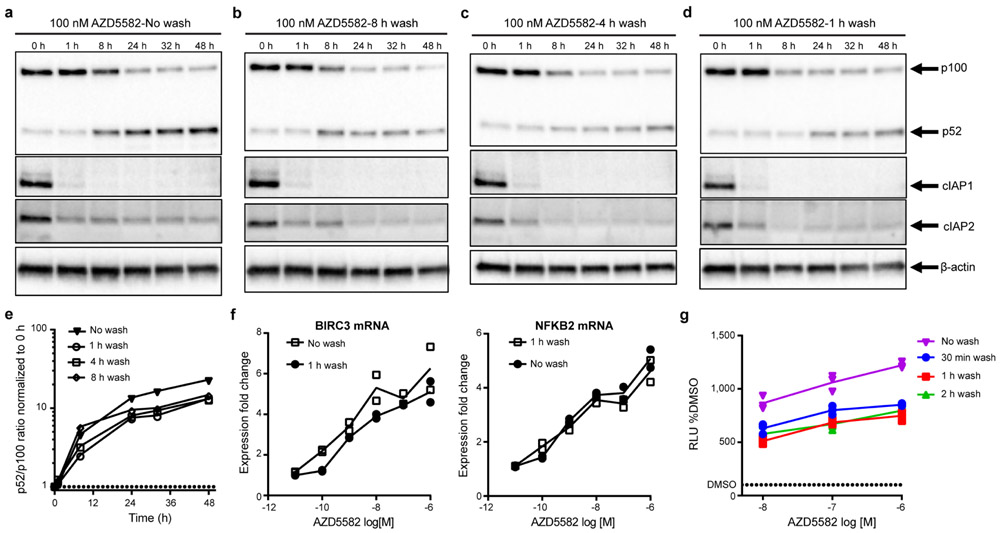
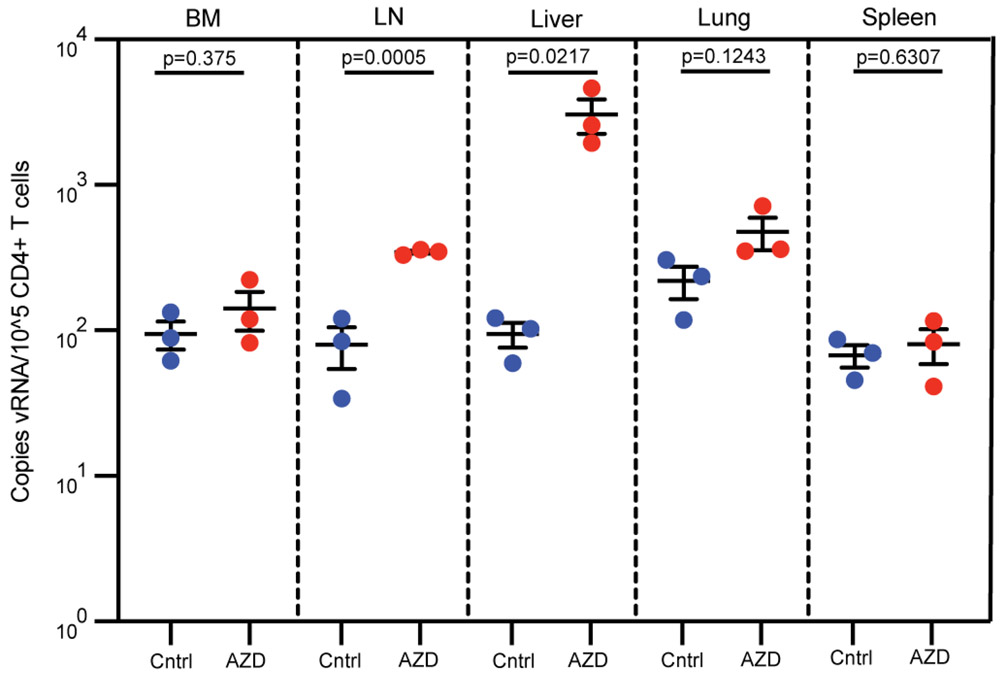
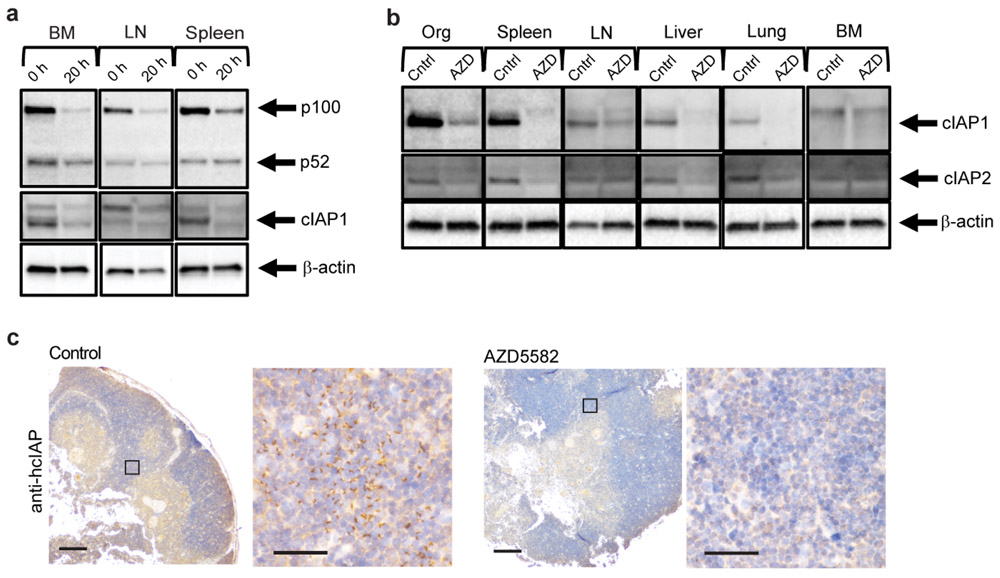
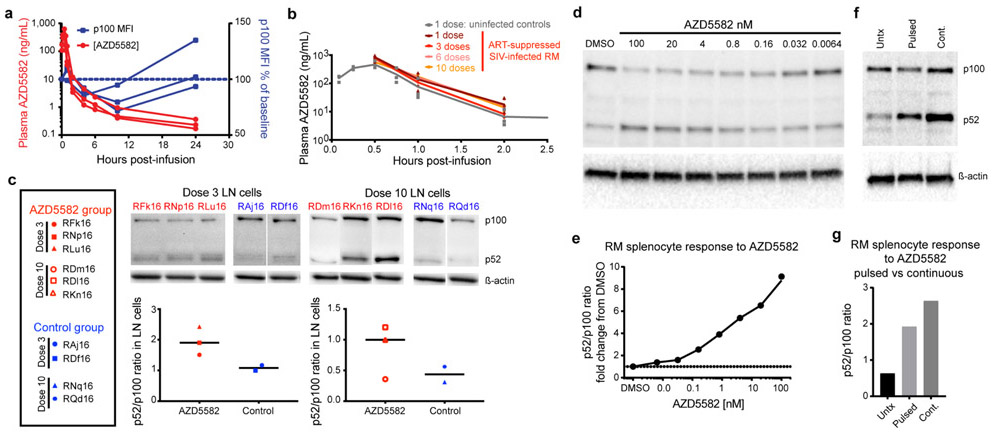
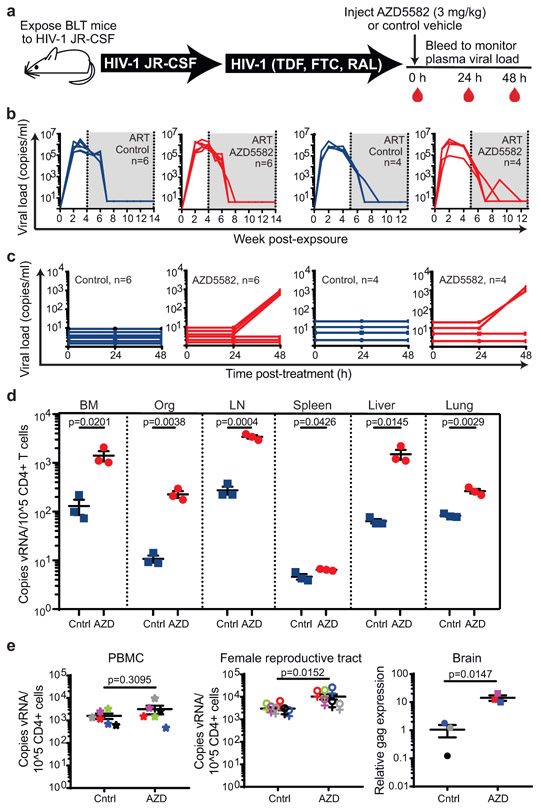
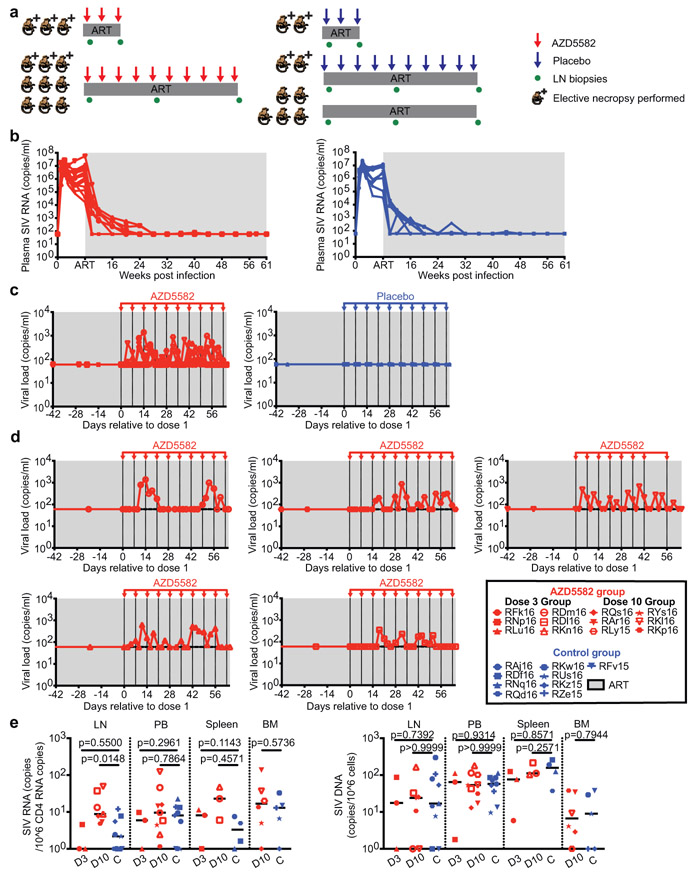
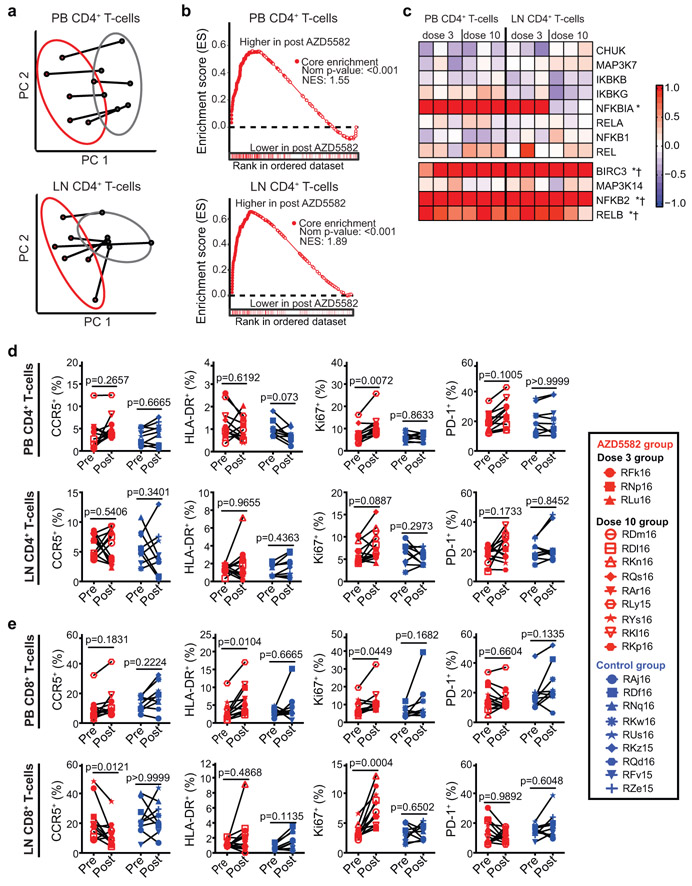
Long-lasting, latently infected resting CD4+ T cells are the greatest obstacle to obtaining a cure for HIV infection, as these cells can persist despite decades of treatment with antiretroviral therapy (ART). Estimates indicate that more than 70 years of continuous, fully suppressive ART are needed to eliminate the HIV reservoir1. Alternatively, induction of HIV from its latent state could accelerate the decrease in the reservoir, thus reducing the time to eradication. Previous attempts to reactivate latent HIV in preclinical animal models and in clinical trials have measured HIV induction in the peripheral blood with minimal focus on tissue reservoirs and have had limited effect2-9. Here we show that activation of the non-canonical NF-κB signalling pathway by AZD5582 results in the induction of HIV and SIV RNA expression in the blood and tissues of ART-suppressed bone-marrow-liver-thymus (BLT) humanized mice and rhesus macaques infected with HIV and SIV, respectively. Analysis of resting CD4+ T cells from tissues after AZD5582 treatment revealed increased SIV RNA expression in the lymph nodes of macaques and robust induction of HIV in almost all tissues analysed in humanized mice, including the lymph nodes, thymus, bone marrow, liver and lung. This promising approach to latency reversal-in combination with appropriate tools for systemic clearance of persistent HIV infection-greatly increases opportunities for HIV eradication.


Figures

Extended Data Fig. 1
Extended Data Fig. 1. Short duration exposure to AZD5582 activates the ncNF-κB pathway.
(a-d) Isolated total human CD4+ T cells treated with 100 nM of AZD5582 and then either not washed (a) or washed three times with PBS at (b) 8 h, (c) 4 h, or (d) 1 h post-treatment. Whole cell lysates were then analyzed by immunoblot for components of the ncNF-κB pathway. (e) Densitometry analysis of the ratio of p52 to p100 from the pulse-wash assay immunoblots. Points represent values for the densitometric ratio from one western blot, representative of several independent experiments. (a-e) Entire set representative of one experiment with 5 replicates of the 1 h wash condition conducted. (f) Fold induction of ncNF-κB target gene expression in isolated CD4+ T cells from an uninfected donor treated with the indicated concentration of AZD5582, and either washed after 1 h or not washed, then cultured for 24 h as measured by quantitative RT-PCR. Points represent two technical replicates and lines represent the average. The data presented are representative of three independent experiments. (g) DMSO-normalized induction of luciferase activity from the Jurkat reporter model after exposure to AZD5582 (10, 100, or 1000 nM) for either 30 min (blue), 1 h (red), 2 h (green), or continued exposure (purple). Points represent three replicates in one assay run, representative of two independent experiments. Lines represent the average of the three replicates. For gel source data, see Supplementary Figure 1.
Extended Data Fig. 2
Extended Data Fig. 2. AZD5582 induces HIV-RNA expression in resting CD4+ T cells from tissues of HIV-infected, ART-suppressed BLT mice.
HIV-RNA levels in resting CD4+ T cells isolated from the bone marrow (BM), lymph nodes (LN), liver (Liv), lung (lng), and spleen (spl) of control (Cntrl, blue circles) or AZD5582-treated (red circles) mice (cells pooled from n=6 mice/group for each tissue) were analyzed in triplicate. Statistical significance was determined with a two-sided student’s T test. The mean fold increase in viral RNA levels in resting CD4+ T cells from tissues between the experiment shown in Figure 2 of the manuscript was 12.1 (±3.7) and for Extended Data Figure 2 it was 8.4 (±6.0). These values were not statistically different (p=0.4286, two-sided Mann-Whitney test). Error bars, mean ± s.e.m.
Extended Data Fig. 3
Extended Data Fig. 3. AZD5582 ex vivo target engagement.
(a) Western blot analysis of p100, p52 and cIAP1 protein levels in cells isolated from the bone marrow (BM), lymph node (LN), and spleen of BLT mice prior to and 20 h post ex vivo treatment with AZD5582. Loading control: β-actin. Representative of two experiments. (b) cIAP expression in resting CD4+ T cells isolated from the thymus, spleen, lymph nodes (LN), liver, lung and bone marrow (BM). Loading control: β-actin. Representative of two experiments. (c) cIAP expression in the thymic organoid of HIV-infected, ART-suppressed BLT mice 48 h post administration of vehicle control or AZD5582 (three control and one AZD5582-treated analyzed). Positive cells: brown. 4x and 40x magnifications, scale bars: 100 μm (4x) and 50 μm (40x). Boxes on 4x images indicate regions corresponding to 40x magnification images. For gel source data, see Supplementary Figure 1.
Extended Data Fig. 4.
Extended Data Fig. 4.. Pharmacokinetic and pharmacodynamic assessment of AZD5582 in RMs.
(a) AZD5582 (0.1 mg/kg) was administered to healthy RMs (n=3) by intravenous infusion. Plasma concentrations of AZD5582 (left Y axis) are shown at the indicated time points. Flow cytometry was used to measure intracellular p100 levels, shown as geometric mean fluorescence intensity (gMFI) in CD4+ T cells and plotted as percentage of baseline p100 gMFI (right Y axis). (b) Plasma concentrations of AZD5582 after 1 (dark red), 3 (red), 6 (pink) or 10 (orange) doses in 6 SIV-infected, ART-treated RMs and after 1 dose in 3 uninfected control RMs (gray). Individual values are shown with symbols. (c) Western blot analyses of inactive p100 and active p52 forms of NF-κB2 in lymph node mononuclear cells collected 48 h after the third or tenth dose of AZD5582 in SIV-infected, ART-suppressed RMs (red; n=3 for both 3 dose and 10 dose groups) or at equivalent time points for placebo controls (blue; n=2 for both 3 dose and 10 dose groups). Immunoblots are shown in the top panels and densitometry analyses of the p52:p100 ratios are shown in the bottom panels. Line represents the median. (d) Cryopreserved control RM splenocytes were treated with the indicated concentration of AZD5582 for 48 h, then p100/p52 levels analyzed by Western blotting to measure engagement of the ncNF-κB pathway. For (d and e): the experiments were performed in duplicate. (e) DMSO-normalized densitometric p52:p100 ratio versus the AZD5582 concentration. (f) Cryopreserved RM splenocytes were exposed to DMSO alone (Untx), 100 nM AZD5582 washed off after 1 h and cultured for 47 h (Pulsed), or continuous 100 nM AZD5582 for 48 h (Cont.) then studied by Western blot for p100 and p52 levels. (g) Densitometric p52:p100 ratio. For (f and g): data represents a single experiment. For gel source data, see Supplementary Figure 1.
Extended Data Fig. 5.
Extended Data Fig. 5.. Phylogenetic trees based on full envelope sequencing.
Plasma virus was sequenced from four time points per animal (n=5): near peak viremia (2 wks post infection; red), immediately prior to ART (8 wks post infection; orange), and two time points of on-ART viremia during AZD5582 treatment (green, blue). All sequences per animal were phylogenetically analyzed and the resulting phylogenetic trees are shown for each animal. The horizontal bar indicates the genetic distance, nt: nucleotide.
Extended Data Fig. 6.
Extended Data Fig. 6.. SIV-DNA levels in total CD4+ T cells and replication-competent reservoir size in ART-suppressed SIV-infected RMs.
(a) Longitudinal assessment of cell-associated SIV-DNA levels in total CD4+ T cells isolated from peripheral blood (PB) and lymph nodes (LN) of AZD5582-treated (n=12, red) and control (n=4, blue,) ART-suppressed SIV-infected RMs. Gray shading represents the period of ART administration. (b) Comparison of cell-associated SIV-DNA levels in total CD4+ T cells isolated from the LN and PB of AZD5582-treated and control ART-suppressed, SIV-infected RMs. Total CD4+ T cells were analyzed from AZD5582-treated RMs 48 h after receiving 3 doses (LN and PB: n=3) or 10 doses (LN and PB: n=9) of AZD5582. Total CD4+ T cells were analyzed from placebo control RMs (LN and PB: n=4) at equivalent time points. Open symbols indicate AZD5582-treated RMs with on-ART viremia above 60 copies/mL of plasma. Statistical significance was determined with a two-sided Mann-Whitney test. (c) Quantitative viral outgrowth assays (QVOA) were performed from AZD5582-treated RMs 48 h after receiving three doses (LN: n=2, spleen: n=3) or 10 doses (LN: n=3, spleen: n=2) of AZD5582. QVOAs were performed from control RMs (LN and spleen: n=4) at equivalent time points. Open symbols indicate AZD5582-treated RMs with on-ART viremia. Statistical significance was determined with a two-sided Mann-Whitney U test. Horizontal lines represent the median (b,c).
Extended Data Fig. 7.
Extended Data Fig. 7.. AZD5582-induced gene pathways and genes in SIV-infected, ART-suppressed RMs.
(a) DAVID analysis showing pathways significantly enriched in genes differentially expressed after AZD5582 treatment relative to baseline in CD4+ T cells isolated from LN (black bars) and peripheral blood (gray bars). N=6 for both LN and PB; for each, n=3 for 3 doses of AZD5582 and n=3 for 10 doses of AZD5582. (b) Leading edge genes from the “HALLMARK TNFα SIGNALING VIA NF-κB” pathway from MSigDB. Genes were identified in the leading edge of LN CD4+ T cell samples pre-treatment vs. AZD5582-treated samples (shown in Fig. 4b). The contrast depicted is the fold-change of each gene for each animal’s post-treatment sample relative to its pre-treatment values, with LN CD4+ T cells above and PB CD4+ T cells below. N=6 for both LN and PB; for each, n=3 for 3 doses of AZD5582 and n=3 for 10 doses of AZD5582. (c) Heatmap of cNF-κB (top) and ncNF-κB (bottom) pathway gene expression in RMs with (left, n=5) or without (right, n=6) on-ART viremia > 60 copies/mL plasma. One RM without on-ART viremia was excluded from this analysis for technical issues (higher than expected unmapped and multi-mapped reads, and lower than expected unique identified reads compared to the means). Color scale: log2-fold changes from pre-treatment.
Extended Data Fig. 8.
Extended Data Fig. 8.. Relationship between virological status pre-intervention and virological response to AZD5582 treatment in SIV-infected, ART-suppressed RMs.
(a) Individual representations of plasma SIV-RNA levels measured by ultrasensitive assay (limit of detection 3 copies/mL of plasma) before and during AZD5582 treatment in SIV-infected, ART-suppressed RMs (n=12). “Baseline” shows two or three plasma viral loads before AZD5582 treatment and “AZD5582” shows three or four plasma viral loads during AZD5582 treatment. Open symbols indicate the five AZD5582-treated RMs with on-ART viremia > 60 copies of SIV-RNA/mL of plasma using the standard viral load assay (confirmed with ultrasensitive assay). The orange box highlights an additional three RMs who did not experience on-ART viremia > 60 copies/mL of plasma but showed ≥ 2 SIV-RNA measurements above baseline values using the ultrasensitive quantification. (b) Comparison of the medians of baseline and during AZD5582 treatment plasma SIV-RNA levels measured by ultrasensitive assay for ART-suppressed SIV-infected RMs (n=12). Statistical significance was determined with a Wilcoxon matched-pairs signed rank test. (c) Comparison of the levels of plasma SIV-RNA at peak, plasma SIV-RNA before ART initiation, SIV-DNA in PB CD4+ T cells before AZD5582 treatment (pre-LRA), SIV-DNA in LN CD4+ T cells pre-LRA, SIV-RNA in PB CD4+ T cells pre-LRA, and SIV-RNA in LN CD4+ T cells pre-LRA in RMs who showed increased plasma viral loads (PVL) by standard and/or ultrasensitive assay during AZD5582 treatment (increased PVL, n=8) vs. RMs who did not demonstrate increased viral loads (stable PVL, n=4). Statistical significance was determined with a two-sided Mann-Whitney test. Horizontal lines represent the median (a,c).
Extended Data Fig. 9.
Extended Data Fig. 9.. AZD5582 can be safely administered in SIV-infected, ART-suppressed RMs.
Longitudinal assessment of (a) serum chemistries, (b) complete blood counts, and (c) weight in SIV-infected, ART-treated RMs dosed with AZD5582 (red, n=12) compared to controls (blue, n=9). Gray shading represents the period of ART administration. AST: aspartate aminotransferase, ALT: alanine aminotransferase, BUN: blood urea nitrogen, GGT: gamma-glutamyltransferase, WBC: white blood cell, HGB: hemoglobin.
Extended Data Fig. 10.
Extended Data Fig. 10.. Immunologic impact of AZD5582 in SIV-infected, ART-suppressed RMs.
Longitudinal assessment of CD4+ T cell (a) count, (b) frequency and viability in SIV-infected, ART-treated RMs during the period of AZD5582 treatment (n=12). Lines represent median values. CD4+ T cell naïve and memory subset frequencies (c) and their expression of Ki-67 (d) in SIV-infected, ART-treated RMs during the period of AZD5582 treatment (n=12). Lines represent median values. (e) SIVgag-specific (left) and SIVenv-specific (right) CD8+IFNγ+ T cell responses in SIV-infected, ART-suppressed, AZD5582-treated (red, n=6) and control (blue, n=4) RMs. SFU: spot forming units. (f) Pie charts depicting the ability of memory CD8+ T cells isolated from SIV-infected, ART-suppressed control RMs (n=5) to produce IFNγ, IL-2 and/or TNFα in response to PMA/ionomycin stimulation in the absence (left) or presence (right) of AZD5582 pre-treatment. (g) Memory CD8+ T cell proliferative response to PMA/ionomycin stimulation with or without AZD5582 pre-treatment. Top panels show representative flow cytometry dot plots gated on memory CD8+ T cells. Bottom panel shows the comparison of divided cells 5 d post stimulation in each group (n=5 for each). Statistical significance was determined with a Wilcoxon matched-pairs signed rank test. Horizontal lines represent the median. (h) Longitudinal assessment of plasma levels of IP-10, MIP-1β, MCP-1, IL-6 and IL-10 by multiplex assay in SIV-infected, ART-suppressed RMs treated with AZD5582 (red, n=6) or control RMs (blue, n=4). An additional four analytes (IFNγ, IL-8, IL-1β, and IL-2) were undetectable in all animals. (a-e, h): gray shading represents the period of ART administration. Dashed lines represent AZD5582 or placebo infusions. LLOD: lower limit of detection.
Fig. 1
Fig. 1. Efficient in vitro AZD5582 target engagement and induction of HIV transcription.
(a) Total CD4+ T cells were treated with a broad range of concentrations (10 pM to 1 μM) of AZD5582 overnight, and cell lysates were analyzed by immunoblot, probing for cIAP1 and p100/p52 as indicated (top panel, representative of 10 experiments). Immunoblot analysis of isolated total CD4+ T cell lysate following treatment with 100 nM AZD5582 examining components of the canonical and ncNF-κB pathway over a 48 h time course post-treatment (middle and bottom panels, representative of 3 and 4 experiments respectively). (b) DMSO-normalized reporter signal induced by a dose titration of a panel of mono- and bivalent SMAC mimetics in a Jurkat luciferase reporter model of HIV-1 latency with 48 h exposure. Symbols represent technical replicates from a single run and are representative of three independent experiments. Lines represent a four-parameter logistic regression model fit. (c) Infectious units per million cells induced by DMSO or 100 nM AZD5582 were determined in a limiting dilution quantitative viral outgrowth assay. Values are infectious units per million resting CD4+ T cells. (d) Volcano plots summarizing average up- and down-regulated genes at 2, 6, and 24 h post-treatment with Ingenol B or AZD5582, with the average log2 fold change on the x-axis and log10 adjusted p-value (two-sided Wald test) on the y-axis as compared to DMSO alone. Dashed lines represent thresholds of log2 fold change of 1 and p-adjusted of 0.05. The data shown represents the average fold change across 4 donors and one experiment. For gel source data, see Supplementary Figure 1.
Fig. 2
Fig. 2. AZD5582 induces HIV-RNA expression resting CD4+ T cells from tissues of HIV-infected, ART-suppressed BLT mice.
(a) BLT mice were infected with HIV-1JR-CSF. Following 10 weeks of ART treatment, mice were administered vehicle control or AZD5582. (b) HIV-RNA copies/mL plasma in HIV-infected, ART-treated BLT mice prior to treatment with vehicle control (left panels, blue lines) or AZD5582 (right panels, red lines). These are two independent experiments (left panels: n=6 mice/group, right panels: n=4 mice/group). Gray shading: period of ART administration. (c) Plasma HIV-RNA levels in HIV-infected, ART-suppressed mice in panel B treated with vehicle control or AZD5582. (d) HIV-RNA levels in resting CD4+ T cells isolated from the bone marrow (BM), thymic organoid (Org), lymph nodes (LN), spleen, liver and lung of control or AZD5582-treated mice (cells pooled from n=6 mice/group for each tissue) were analyzed in triplicate. Error bars, mean ± s.e.m. Statistical significance was determined with a two-sided student’s T-test. (e) Cell-associated HIV-RNA (vRNA) copies in the blood (PBMCs, n=6), female reproductive tract (FRT, n=6) and brain (n=3). Statistical significance was determined with a two-sided Mann-Whitney test (PBMCs and FRT) or student’s T-test (brain). Colors indicate samples from the same mice. Error bars, mean ± s.e.m.
Fig. 3
Fig. 3. AZD5582 induces SIV-RNA expression in the plasma and lymph nodes of ART-suppressed SIV-infected RMs.
(a) Experimental design during AZD5582 treatment phase. Three RMs received 3 doses of AZD5582 and were sacrificed 48 h after the last dose. Nine RMs received 10 doses of AZD5582 and 3 were sacrificed 48 h after the last dose. The first dose of AZD5582 was administered after 55 to 67 weeks of ART (3 dose group: 55 weeks; 10 dose group: 55-67 weeks). Four control RMs received a weekly placebo infusion; 2 were sacrificed 48 h after 3 infusions and 2 were sacrificed 48 h after 10 infusions. Five control animals received ART only. (b) Plasma SIV-RNA levels in the 21 SIV-infected RMs prior to treatment with AZD5582 (left, n=12) and equivalent time period for controls (right, n=9). For (b-d): gray shading represents the period of ART administration. (c) Plasma SIV-RNA levels in ART-suppressed SIV-infected RMs during AZD5582 treatment (left, n=12) and the equivalent time period for controls (right, n=9). (d) Individual representation of plasma SIV-RNA levels in the 5 RMs experiencing on-ART viremia during AZD5582 treatment. (e) Cell-associated SIV-RNA (left) and SIV-DNA (right) levels in resting CD4+ T cells isolated from lymph nodes (LN), peripheral blood (PB), spleen and bone marrow (BM) of AZD5582-treated (red) and control (blue) ART-suppressed, SIV-infected RMs. Resting CD4+ T cells were analyzed from AZD5582-treated RMs 48 h after receiving 3 doses (D3, LN, PB and spleen: n=3) or 10 doses (D10, LN: n=7, PB: n=9, spleen: n=3, BM: n=6) of AZD5582. Resting CD4+ T cells were analyzed from control RMs (C, LN and PB: n=9, spleen: n=4, BM: n=5) at equivalent time points. Open symbols indicate AZD5582-treated RMs with on-ART viremia. Statistical significance was determined with a two-sided Mann-Whitney test. Horizontal lines represent the median.
Fig. 4
Fig. 4. AZD5582 specifically activates the ncNF-κB pathway in SIV-infected, ART-suppressed RMs without generalized T cell activation.
(a-c) Peripheral blood (PB) and lymph node (LN) CD4+ T cell gene expression in SIV-infected, ART-suppressed RMs pre- and post-AZD5582 treatment (n=6 for both LN and PB; for each, n=3 for 3 doses of AZD5582 and n=3 for 10 doses of AZD5582). (a) PCA plots comparing PB (top) and LN (bottom) CD4+ T cell transcriptomes pre- (gray) and post- (red) AZD5582. Ellipses: two standard deviations. (b) GSEA plots of NF-κB-induced genes in PB (top) and LN (bottom) CD4+ T cells. Gene Set: “HALLMARK TNFα SIGNALING VIA NF-κB” (MSigDB). (c) Heatmap of cNF-κB (top) and ncNF-κB (bottom) pathway gene expression. Color scale: log2-fold changes from pre-treatment. Genes differentially expressed post-AZD5582 in PB (asterisks) or LN (crosses) CD4+ T cells are noted. Expression of activation markers in (d) CD4+ and (e) CD8+ T cells in PB (top) and LN (bottom) of SIV-infected, ART-suppressed RMs pre-AZD5582 and 48 h after the final dose (n=12, red) and control RMs (n=9, blue). Statistical significance was determined with a two-sided Mann-Whitney test.

Comment in

References

    1. Finzi D et al. Latent infection of CD4+ T cells provides a mechanism for lifelong persistence of HIV-1, even in patients on effective combination therapy. Nat Med 5, 512–517, doi: 10.1038/8394 (1999). - DOI - PubMed
    1. Archin NM et al. Interval dosing with the HDAC inhibitor vorinostat effectively reverses HIV latency. J Clin Invest 127, 3126–3135, doi: 10.1172/JCI92684 (2017). - DOI - PMC - PubMed
    1. Archin NM et al. Administration of vorinostat disrupts HIV-1 latency in patients on antiretroviral therapy. Nature 487, 482–485, doi: 10.1038/nature11286 (2012). - DOI - PMC - PubMed
    1. Elliott JH et al. Activation of HIV transcription with short-course vorinostat in HIV-infected patients on suppressive antiretroviral therapy. PLoS Pathog 10, e1004473, doi: 10.1371/journal.ppat.1004473 (2014). - DOI - PMC - PubMed
    1. Gutierrez C et al. Bryostatin-1 for latent virus reactivation in HIV-infected patients on antiretroviral therapy. AIDS 30, 1385–1392, doi: 10.1097/QAD.0000000000001064 (2016). - DOI - PubMed

Publication types

MeSH terms

Substances