. 2020 Jan;577(7792):695-700.
doi: 10.1038/s41586-020-1947-z. Epub 2020 Jan 22.

Mechanism of adrenergic CaV1.2 stimulation revealed by proximity proteomics

Affiliations

Mechanism of adrenergic CaV1.2 stimulation revealed by proximity proteomics

Guoxia Liu et al. Nature. 2020 Jan.

Abstract

Increased cardiac contractility during the fight-or-flight response is caused by β-adrenergic augmentation of CaV1.2 voltage-gated calcium channels1-4. However, this augmentation persists in transgenic murine hearts expressing mutant CaV1.2 α1C and β subunits that can no longer be phosphorylated by protein kinase A-an essential downstream mediator of β-adrenergic signalling-suggesting that non-channel factors are also required. Here we identify the mechanism by which β-adrenergic agonists stimulate voltage-gated calcium channels. We express α1C or β2B subunits conjugated to ascorbate peroxidase5 in mouse hearts, and use multiplexed quantitative proteomics6,7 to track hundreds of proteins in the proximity of CaV1.2. We observe that the calcium-channel inhibitor Rad8,9, a monomeric G protein, is enriched in the CaV1.2 microenvironment but is depleted during β-adrenergic stimulation. Phosphorylation by protein kinase A of specific serine residues on Rad decreases its affinity for β subunits and relieves constitutive inhibition of CaV1.2, observed as an increase in channel open probability. Expression of Rad or its homologue Rem in HEK293T cells also imparts stimulation of CaV1.3 and CaV2.2 by protein kinase A, revealing an evolutionarily conserved mechanism that confers adrenergic modulation upon voltage-gated calcium channels.


Figures
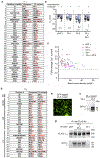
Extended Data Fig. 1.
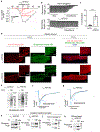
Extended Data Fig. 1.. Putative PKA phosphorylation sites in α1C and β2B subunit.
(a) The 35 putative PKA phosphorylation sites in rabbit α1C. The 51 residues in red are either predicted phosphorylation sites or within the immediate region of the predicted phosphorylation sites. All 51 residues were replaced with Ala in the 35-mutant α1C transgenic mice. (b) Combined bar and column scatter plot of Boltzmann function parameters V50. Mean ± SEM. ** P <0.01; *** P <0.001; **** P <0.0001 by paired two-tailed t-test. pWT α, n= 19; 35-α mutant, n= 14; 28-β mutant, n= 16; 35-α mutant X 28-β mutant, n= 24. Specific P values can be found in the Source Data associated with this figure. (c) Graph of isoproterenol and forskolin-induced increase in nisoldipine-resistant current stratified by total basal current density before nisoldipine. (d) The 28 putative PKA phosphorylation sites in the N-terminal (NT), Hook, GK and C-terminal (CT) domains of β2B. The 37 residues in red are either predicted phosphorylation sites or within the immediate vicinity of predicted phosphorylation sites, and were mutated to Ala in the 28-mutant GFP-tagged β2B transgenic mice. (e) Fluorescence imaging of isolated cardiomyocytes expressing GFP-tagged 28-β mutant. Representative of images from more than 5 biologically independent mice. (f) Anti-β antibody immunoblot of cleared lysates from doxycycline-fed 35-mutant α1C transgenic mice or 35-mutant α1C X GFP-tagged 28-mutant β2B expressing mice hearts. Representative of immunoblots obtained from at least 3 biologically independent mice. (g) Anti-FLAG antibody (upper) and anti-β antibody (lower) immunoblots of anti-FLAG antibody immunoprecipitations from cleared lysates of hearts from pWT, 35-α and three 35-α X GFP-tagged-28-β expressing mice. Representative images of two independent experiments. For source gel data, see Supplementary Fig. 1.
Extended Data Fig. 2.
Extended Data Fig. 2.. Trafficking and function of APEX2-conjugated CaV1.2 channels subunits in heart.
(a) Exemplar current-voltage relationship of Ca2+ currents from α1C-APEX2 mice cardiomyocytes acquired in absence (black trace) and presence of nisoldipine (red trace). Inset scale bars: horizontal 100 ms, vertical 10 pA/pF. Representative of 5 experiments. (b) Time course of changes in sarcomere length after superfusion of nisoldipine-containing solution. Representative of 7 experiments (c) Percent-shortening in the presence of nisoldipine. Mean ± SEM. ****, P <0.0001 by unpaired two-tailed t-test. n=12, 7 cardiomyocytes, respectively. (d) Immunofluorescence of cardiomyocytes isolated from α1C-APEX2 and β2B-APEX2 expressing mice exposed to biotin-phenol and H2O2 or no H2O2. Nuclear labeling with DAPI stain. Scale bar = 5 μm. Representative of 5 and 8 cardiomyocytes from 2 and 3 mice respectively. (e) Streptavidin-horseradish peroxidase (HRP) blot of lysates of isolated ventricular cardiomyocytes. Blot representative of 5 similar experiments. (f) Exemplar whole-cell CaV1.2 currents recorded from cardiomyocytes of α1C-APEX2 transgenic mice. Black trace: 300 nM nisoldipine; blue trace: 200 nM isoproterenol + nisoldipine. Representative of 9 cells from 2 biologically independent mice. (g) Same as (f) except from β2B-APEX2 transgenic mice. Black trace: control; blue trace: 200 nM isoproterenol. Representative of 7 experiments from 2 biologically independent mice. (h-j) Anti-phospho-phospholamban antibody immunoblot of isolated cardiomyocytes exposed to 1 μM isoproterenol. For cardiomyocytes isolated from α1C-APEX2 and β2B-APEX2 mice, the cardiomyocytes were exposed to isoproterenol after incubation with biotin-phenol. Blots representative of 3 independent experiments from at least 5 biologically independent mice for each genotype. (k) Same as (h-j) except whole heart exposed to 1 μM isoproterenol for 5 minutes after infusion of biotin-phenol. Blots representative of at least 5 biologically independent mice for no isoproterenol and at least 5 biologically independent mice for isoproterenol. For source gel data, see Supplementary Fig. 1.
Extended Data Fig. 3.
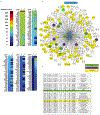
Extended Data Fig. 3.. Analysis of proteins quantified by mass spectrometry in cardiomyocytes isolated from α1C-APEX2 and β2B-APEX2 mice.
(a) Proteins with a ratio of >2 (measured by normalized TMT signal/noise) in the experimental conditions compared to a no-labeling control (no H2O2) are sorted by spectral counts. The 150 proteins with the highest peptide counts are displayed in the color-coded table. α1C-APEX2 and β2B-APEX2 data were collected in biological duplicate experiments. The full table with 3883 proteins quantified by multiplexed SPS MS3 TMT mass spectrometry is reported in Supplementary Data Table 1. (b) Prefuse force directed map of proteins from (a). Peptide counts were used as weight. Proteins mapping to the GO-terms “Z disc” are colored in green, to “membrane” in yellow and to both in purple. The α1C-APEX2 and β2B-APEX2 are colored in blue. (c) Gene-ontology (GO) term (cellular localization) enrichment for proteins in (a). The full table is reported in Supplementary Data Table 2.
Extended Data Fig. 4.
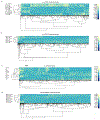
Extended Data Fig. 4.. Two-way hierarchical clustering of scaled data from Fig. 2.
(a) Dendrogram showing two-way hierarchical clustering of scaled TMT signal to noise (s/n) data for streptavidin-purified proteins from α1C-APEX2 expressing cardiomyocytes after vehicle or after isoproterenol stimulation. Scaled relative TMT protein quantification data for 1951 proteins from biological quintuplicate α1C-APEX2. Clustering used Ward’s minimum variance method. (b) Dendrogram showing two-way hierarchical clustering of scaled relative quantification data for 1936 proteins from biological triplicate β2B-APEX2 experiments. Heterogeneity between cardiomyocyte preparations from different mice is apparent. (c) Dendrogram showing two-way hierarchical clustering of scaled relative quantification data for 2610 proteins from whole-organ α1C-APEX without or with perfusion of isoproterenol. Prominent heterogeneity in relative protein quantification between hearts is apparent. Position of Rad is indicated by a red line. In this experiment, the individual hearts are not paired. (d) Dendrogram showing two-way hierarchical clustering of scaled TMT signal to noise (s/n) data from non-transgenic (NTG) cardiomyocytes under isoproterenol stimulation or with vehicle. Scaled data of 4622 quantified proteins from biological quadruplicate experiment are displayed. Pairing of samples is apparent.
Extended Data Fig. 5.
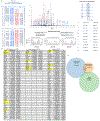
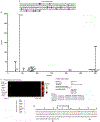
Extended Data Fig. 5.. Isoproterenol-induced change in Rad detected by mass spectrometry.
(a) MS2 spectrum and TMT quantification parameters of a Rad peptide changed upon isoproterenol treatment of murine hearts. The MS2 spectrum used for identification of the peptide: IFGGIEDGPEAEAAGHTYDR mapping to Rad is displayed. y and b ion m/z identified in the spectrum and their deviation from theoretical m/z are displayed on the left. Precursor mass was measured as 778.71 Da with a charge of +3. Peptide modifications were +229.16 Da for TMT on the peptide N-terminus and lysine residues, +57.02 Da for cysteine alkylation and +15.99 for methionine oxidation. Ion injection times, isolation specificity, sum of signal to noise (SN) over all TMT channels, TMT raw intensities, adjusted intensities and final SN intensities used for relative quantification as well as SPS ion m/z are displayed. (b) Table showing gene names of proteins with P < 0.05 for the three approaches: cardiomyocytes isolated from α1C-APEX and β2B-APEX mice, and α1C-APEX hearts. Yellow-highlighted genes are in common amongst groups, but note for Mast2, the fold-change is not consistent. D3Z0N2* is a single peptide with the sequence ESFDSQSLINNQSK and its abundance is reduced by isoproterenol-treatment in non-transgenic cardiomyocytes to 27% likely by post-translational modification (P =0.000002, see Fig. 3 and Supplementary Data Table 6). Data are mean fold-change for 5 pairs of biologically independent pairs of α1C-APEX2 cardiomyocyte samples, 3 pairs of biologically independent pairs of β2B-APEX cardiomyocyte samples, and 10 α1C-APEX2 hearts, 5 without isoproterenol and 5 with isoproterenol. Non-adjusted unpaired two-tailed t-test. (c) Venn diagram of the data from (b). Proteins: Rad = Rrad; PKA catalytic subunit= Prkaca; Acss1 = acyl-CoA synthetase short chain family member 1. Rad is the only protein consistently changed amongst the three approaches.
Extended Data Fig. 6.
Extended Data Fig. 6.. Rad is required for Forskolin-induced activation of heterologously expressed CaV1.2 channels.
(a) Exemplar whole-cell CaV1.2 currents elicited from step depolarizations recorded from HEK293T cells expressing Rad. Pulses every 10-s before (black traces) and during Forskolin (blue traces). Representative of at least 10 cells. (b) Methodology used for generating G/V curves. i. Upper: 200-ms voltage ramp from −60 mV to + 60 mV was applied every 10-s. Lower: Current traces – average of 3 traces before Forskolin (black) and 3 traces after Forskolin (blue). ii. Conversion of time scale to applied voltage. iii. Convert to G-V relationship. (G). Fold-change was calculated at Gmax. (c) Graph of Forskolin-induced fold-change in current stratified by basal current density. (d) Exemplar traces of Ba2+ currents in absence and presence of Rad elicited by voltage ramp every 10-s. Black traces before and blue traces after Forskolin. no Rad:7 cells; Rad:16 cells. (e) Boltzmann function parameter V50. Mean ± SEM. ** P <0.01 by paired two-tailed t-test. n= 7, 16, left to right. (f-g) Graphs of ratio of current after Forskolin to current before Forskolin for cells transfected without and with Rad. Representative of analyses for 3 cells for each condition. (h-l) The distribution of sweep-by-sweep average PO (single trial PO). (h) In absence of Rad, sweeps with no openings or blank sweeps are rare (10%), while most sweeps exhibit either intermediate-high levels of openings. (k) Pale blue lines are conditional Po-voltage relationship obtained for sweeps exhibiting high activity. Blue line is Boltzmann fit. (i) Fraction of blank sweeps is increased with expression of Rad. (j) If PKA catalytic domain is also co-expressed with Rad, the fraction of blank sweeps is reduced and there is a resurgence of the high activity mode. (l) Same as (k) but with Rad and PKA expression.
Extended Data Fig. 7.
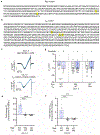
Extended Data Fig. 7.. PKA phosphorylation sites in mouse Rad.
(a) Serine/threonine residues (purple-highlighted) mutated to alanine in the 14-SA mutant. (b) Mass spectrometry identification of phosphorylated residues on Rad enriched with an anti-GFP nanobody matrix from HEK cells expressing GFP-Rad and treated with forskolin. The number of spectral counts is plotted against the position of the phosphorylated amino acids in Rad. 534 aggregated phosphopeptides were detected from two independent experiments. (c) The database entry of phosphorylation sites identified previously in Rad is displayed. The highest level of Rad phosphorylation was detected in the heart. Peptides with phosphorylated Ser residues (bold, red) on positions 25, 38 and 300 (mapped to Rad expression constructs used in this study) were detected. (https://phosphomouse.hms.harvard.edu/site_view.php?ref=IPI00133102). (d) Serine residues mutated to alanine in 4-SA mutant indicated by arrows.
Extended Data Fig. 8.
Extended Data Fig. 8.. Binding of Rad and β2B is required for regulation of Forskolin-induced stimulation of voltage-gated Ca2+ channels.
(a) Alanine substitutions of Rad at residues R208 and L235 (yellow-highlighted), and (b) alanine substitutions at residues D244, D320 and D322 (yellow-highlighted) of β2B were created to attenuate Rad binding to β as described previously ,. (c) Ba2+ current of CaV1.2 channels elicited by voltage ramp every 10 s from −60 mV to +60 mV over 200 ms. Black traces before and blue traces after Forskolin. Representative of 20 and 15 cells, from top to bottom. (d) Boltzmann function parameter V50. Mean ± SEM. ** P <0.001 by paired two-tailed t-test. Data for WT Rad is same as Fig. 3h. Specific P values can be found in the Source Data associated with this figure. N= 16, 19, 13, from left to right. (e) Fold-change (Forskolin vs. No Forskolin) in Gmax. Mean ± SEM. P < 0.0001 by one-way ANOVA; **** P <0.0001 by Dunnett’s test. Data for WT Rad and WT β2B is same as Fig. 4e. n= 7, 7, 9 cells, from left to right. (f) Fold-change (forskolin vs. no forskolin) in Gmax. Mean ± SEM. P < 0.001 by one-way ANOVA; *** P < 0.001 by Dunnett’s test. Data for WT Rad and WT β2B is same as Fig 4h. n= 11, 7, 8 cells, from left to right.
Extended Data Fig. 9.
Extended Data Fig. 9.. Phosphorylation-dependent dissociation of Rad and β3 and β4 subunits.
(a-b) FRET 2-hybrid binding isotherms were determined for Cerulean (Cer)-tagged β3 and β4, and N-terminal Venus (Ven)-tagged WT or 4-SA mutant Rad. FRET efficiency (ED) is plotted against the free concentration Ven-WT or Ven-4SA-mutant Rad. Solid line fits a 1:1 binding isotherm. Co-expression of the PKA catalytic subunit weakened binding in WT Rad-expressing cells, but not 4-SA mutant Rad-expressing cells. (c) Bar graph summarizing mean Kd,EFF for β2B, β3 and β4, and WT and 4-SA mutant Rad, expressed without and with catalytic PKA subunit. Mean ± 95% confidence intervals (CI). The error bars on the Kd,EFF are a 95%-CI for the pooled non-linear fits based on the Jacobians computed. The sample size for each condition is 1,580-10,364 cells acquired via two independent transfections and then pooled. The distribution of data in this graph is reflected in Fig. 4b-c, and in (a) and (b) of this figure.
Extended Data Fig. 10.
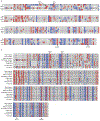
Extended Data Fig. 10.. ClustalW alignment of Rad sequences and RGK GTPases.
(a) Conserved phosphorylation sites for mouse Ser25, Ser38, Ser272 and Ser300 are shown. Blue highlights basic amino acids (Arg, Lys and His), and red highlights Ser and Thr. (b) Phosphorylation sites for mouse Rad Ser25, Ser38, Ser272 and Ser300 are indicated (arrows). The C-terminal phosphorylation sites are conserved. The equivalent of Ser25 phosphorylation site is conserved in Rem1. The equivalent of Ser38 phosphorylation site is probably conserved in Gem. Blue highlights basic amino acids (Arg, Lys and His), and red highlights Ser and Thr.
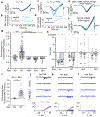
Fig. 1.
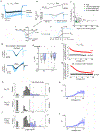
Fig. 1.. Phosphorylation of α1C and β subunits by PKA is not required for β-adrenergic regulation of CaV1.2.
(a)Schematic of rabbit cardiac α1C and β subunits. Red dots indicate putative PKA phosphorylation sites. (b) Schematic of binary transgene system. The expression of reverse tetracycline-controlled transactivator (rtTA) is driven by the cardiac-specific α-myosin heavy chain promoter. The cDNAs for FLAG-DHP-resistant (DHP*) α1C or GFP-β2B were ligated behind 7 tandem tetO sequences. (c) Exemplar whole-cell CaV1.2 currents of 35-mutant α1C transgenic mice cardiomyocytes in nisoldipine before (black trace) and after isoproterenol (blue trace). Representative of 25 experiments. (d) Fold-change of peak DHP-resistant Ca2+ current at 0 mV caused by isoproterenol or forskolin. Mean ± SEM. P =0.39 by unpaired two-tailed t-test. n= 45 cardiomyocytes from 5 mice, n = 25 cardiomyocytes from 5 mice. (e-f) Exemplar whole-cell CaV1.2 currents of GFP-tagged-28-mutant β2B transgenic mice cardiomyocytes, and 35-mutant α1C X 28-mutant β2B transgenic mice cardiomyocytes. Representative of 8 and 22 independent experiments respectively. (g) Fold-change in peak Ca2+ current caused by isoproterenol or forskolin for cardiomyocytes isolated from transgenic mice expressing GFP-tagged WT β2B subunit , GFP-tagged 28-mutant β2B, or both 35-mutant α1C and GFP-tagged 28-mutant β2B. Mean ± SEM. P =0.27 by one way-ANOVA. n= 19, 8, 21 cardiomyocytes from 4, 4, 3 mice, from left to right.
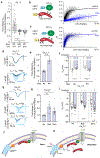
Fig. 2.
Fig. 2.. Changes in CaV1.2 subdomain proteome upon β-adrenergic agonist activation of PKA signaling in heart.
(a) Immunofluorescence of isolated α1C-APEX2 and β2B-APEX2 cardiomyocytes exposed to biotin-phenol and H2O2. Representative of 13 and 8 cardiomyocytes from 2 and 3 mice respectively. Scale bar = 5 μm. (b) Immunofluorescence of tissue sections of Langendorff-perfused α1C-APEX2 heart. Scale bars: upper −100 μm; lower − 5 μm; lower inset− 5 μm. Representative of 10 sections from 2 mice. (c) Immunoblots of biotin-labeled proteins from α1C-APEX2 and β2B-APEX2 mice cardiomyocytes. In contrast to CaV1.2 subunits, RyR2, Jph2 and CaM, KV1.5 channels were not detected in streptavidin-pulldown. Blots representative of 3 independent experiments. (d) Schematic of workflow for isolated cardiomyocytes. (e) Volcano plot of fold-change for relative protein quantification by TMT mass spectrometry of α1C-APEX2 samples. Data shown are means for 5 pairs of biologically-independent samples. Non-adjusted unpaired two-tailed t-test. Rad (red dot) is reduced by 50% and PKA catalytic subunit (green dot) is increased by 50%. (f) Same as (e) except cardiomyocytes from β2B-APEX2 mice. Data shown are means for 3 pairs of biologically independent samples. Rad is reduced by 30% and PKA catalytic subunit is increased by 68%. (g) Schematic of protein labeling and workflow for Langendorff-perfused α1C-APEX2 mice hearts. bpm= beats per minute. (h) Same as (d) except proteins from α1C-APEX2 whole heart samples. Data shown are means for 10 hearts, 5 without isoproterenol and 5 with isoproterenol. Rad is reduced by 36% (i) Schematic of workflow for isolated cardiomyocytes from non-transgenic (NTG) mice. (j) Same as (e) except proteins isolated from non-transgenic (NTG) mice cardiomyocytes without biotinylation or pull-down. * single peptide ESFDSQSLINNQSK. Data shown are means for 4 pairs of biologically-independent samples. Rad (red dot) in whole heart is unchanged by isoproterenol. For source gel data, see Supplementary Fig. 1.
Fig. 3.
Fig. 3.. Phosphorylation of Rad is required for cAMP-PKA activation of CaV1.2.
(a, c, e, f) Ba2+ current elicited by voltage ramp every 10s. Black traces before and blue traces after forskolin. Representative of 15,16, 8 and 13 cells, respectively. (b, d) Diary plot of normalized Ba2+ current amplitude at 0 mV. Representative of 15 and 16 cells. (g) Fold-change in maximum conductance (Gmax) induced by forskolin. Mean ± SEM. P < 0.0001 by one-way ANOVA; ** P < 0.01, **** P < 0.0001 by Tukey’s test. n= 27, 76, 9, 23, 18 cells, from left to right. Specific P values can be found in the Source Data associated with this figure. (h) Boltzmann function parameter V50. Mean ± SEM. *** P <0.001 by two-tailed paired t-test. n= 15, 16, 8, 13, from left to right. (i) Fold-change in Gmax induced by forskolin in absence and presence of Rad. Mean ± SEM. **** P < 0.0001 by unpaired two-tailed t-test. n= 7, 16, left to right. (j-l) The top rows display stochastic records, where channel closures are zero-current portions of the trace (horizontal gray lines) and openings are downward deflections to the open level (slanted gray lines). Bottom row: pale blue and gray lines are average PO-V relationship from multiple cells. Blue and black lines are Boltzmann fits. In all experiments, α1C and β2B were expressed in HEK cells with no Rad (j), WT Rad (k), or 4 SA-mutant Rad (l), in the absence or presence of exogenous PKA catalytic subunit. Dashed line is maximal PO for control of α1C + β2B without Rad. Scale bars: 1 pA and 25 ms. Control, n= 10; Control + PKA, n=5; Rad, n=5; Rad + PKA, n=8; 4SA mutant Rad, n=6, 4SA mutant Rad + PKA, n=5.
Fig. 4.
Fig. 4.. RGK GTPases confer adrenergic regulation to CaV1.2, CaV1.3 and CaV2.2 channels via binding to β.
(a) Fold-change in Gmax. Mean ± SEM. P < 0.0001 by one-way ANOVA; *** P < 0.001 by Dunnett’s test. Data for Rad is same as Fig. 3g. n= 76, 20, 15, left to right. Specific P values can be found in the Source Data associated with this figure. (b-c) FRET efficiency (ED) is plotted against the free concentration Ven-WT (b) or Ven-4SA-mutant Rad (c). Solid line fits a 1:1 binding isotherm. (d) Ba2+ current of CaV1.3 channels without or with expression of Rad elicited by voltage ramp every 10 s. Black traces before and blue traces after forskolin. No Rad, Rad: 7 cells each. (e) Fold-change in Gmax. Mean ± SEM. **** P <0.0001 by unpaired two-tailed t-test. n= 7 for both. (f) Boltzmann function parameter V50. Mean ± SEM. * P < 0.05; ** P <0.01 by paired two-tailed t-test. n=7 for no Rad and Rad. (g) Ba2+ current of CaV2.2 channels without or with expression of Rad or Rem elicited by voltage ramp every 10 s. Black traces before and blue traces after forskolin. Representative of 11,11,15, top to bottom. (h) Fold-change in Gmax. Mean ± SEM. P < 0.001 by one-way ANOVA; **** P < 0.0001, *** P <0.001, * P < 0.05 by Dunnett’s test. n= 11, 11, 15, left to right. (i) Boltzmann function parameter V50. Mean ± SEM. **** P <0.001 by paired two-tailed t-test; n=11, 11, 15, from left to right. (j-k) Proposed model of β-adrenergic regulation of Ca2+ channels. Basal state (j) and after (k) β-agonist-induced activation of PKA leads to PKA-phosphorylation of Rad causing dissociation of Rad from the CaV1.2 complex and subsequently increased Ca2+ influx. AC: adenylyl cyclase.

Comment in

References

    1. Cachelin AB, de Peyer JE, Kokubun S & Reuter H Ca2+ channel modulation by 8-bromocyclic AMP in cultured heart cells. Nature 304, 462–464 (1983). - PubMed
    1. Reuter H & Scholz H The regulation of the calcium conductance of cardiac muscle by adrenaline. J Physiol 264, 49–62 (1977). - PMC - PubMed
    1. Hartzell HC, Mery PF, Fischmeister R & Szabo G Sympathetic regulation of cardiac calcium current is due exclusively to cAMP-dependent phosphorylation. Nature 351, 573–576, doi: 10.1038/351573a0 (1991). - DOI - PubMed
    1. Tsien RW, Giles W & Greengard P Cyclic AMP mediates the effects of adrenaline on cardiac purkinje fibres. Nat New Biol 240, 181–183 (1972). - PubMed
    1. Hung V et al. Spatially resolved proteomic mapping in living cells with the engineered peroxidase APEX2. Nat Protoc 11, 456–475, doi: 10.1038/nprot.2016.018 (2016). - DOI - PMC - PubMed

Publication types

MeSH terms