. 2020 Feb;578(7793):149-153.
doi: 10.1038/s41586-020-1936-2. Epub 2020 Jan 22.

Targeting of temperate phages drives loss of type I CRISPR-Cas systems

Affiliations

Targeting of temperate phages drives loss of type I CRISPR-Cas systems

Clare Rollie et al. Nature. 2020 Feb.

Erratum in

Abstract

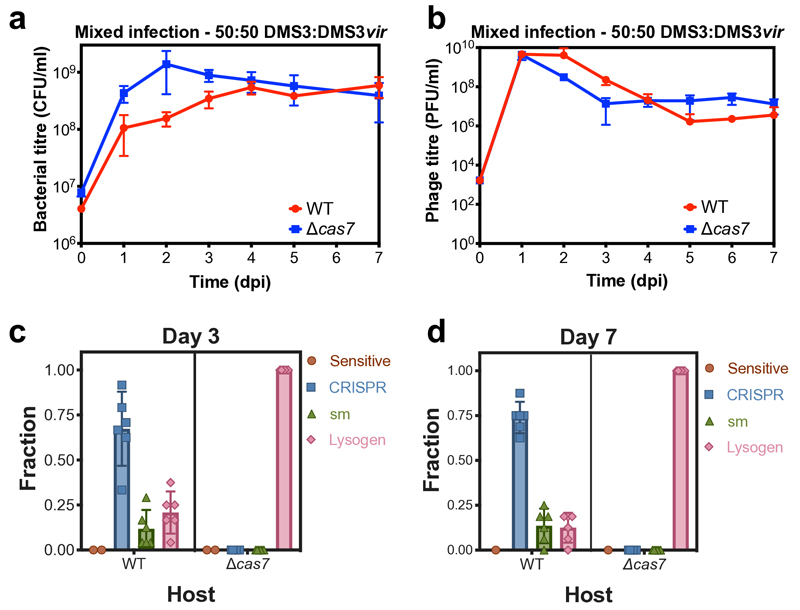
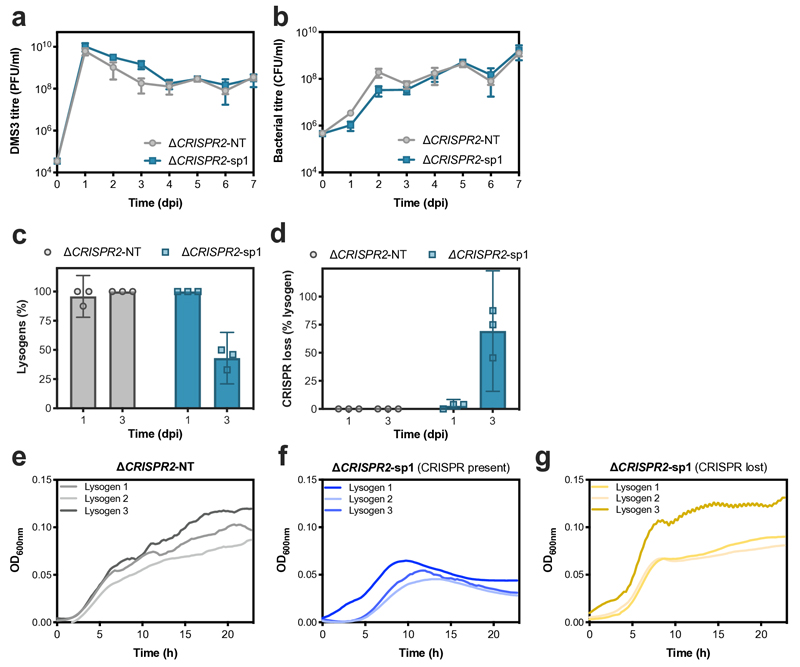
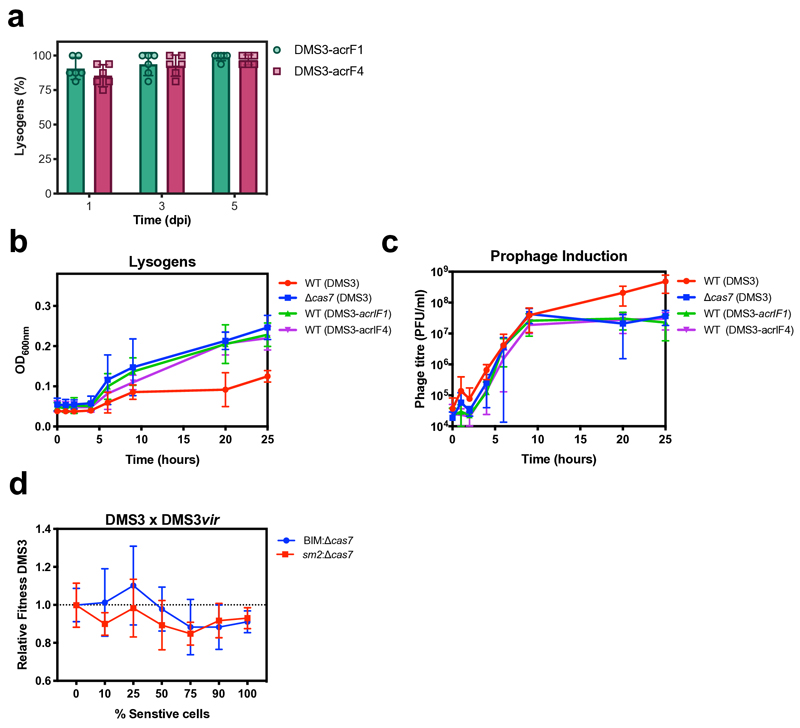
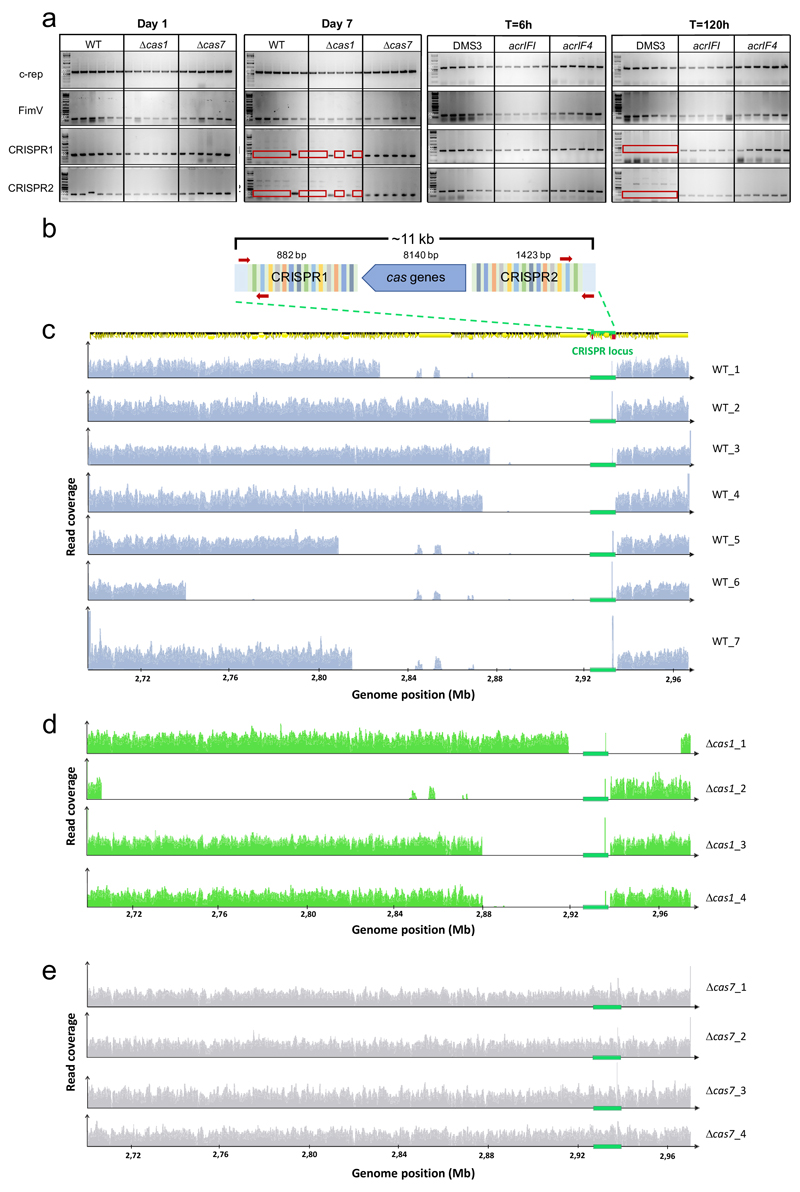
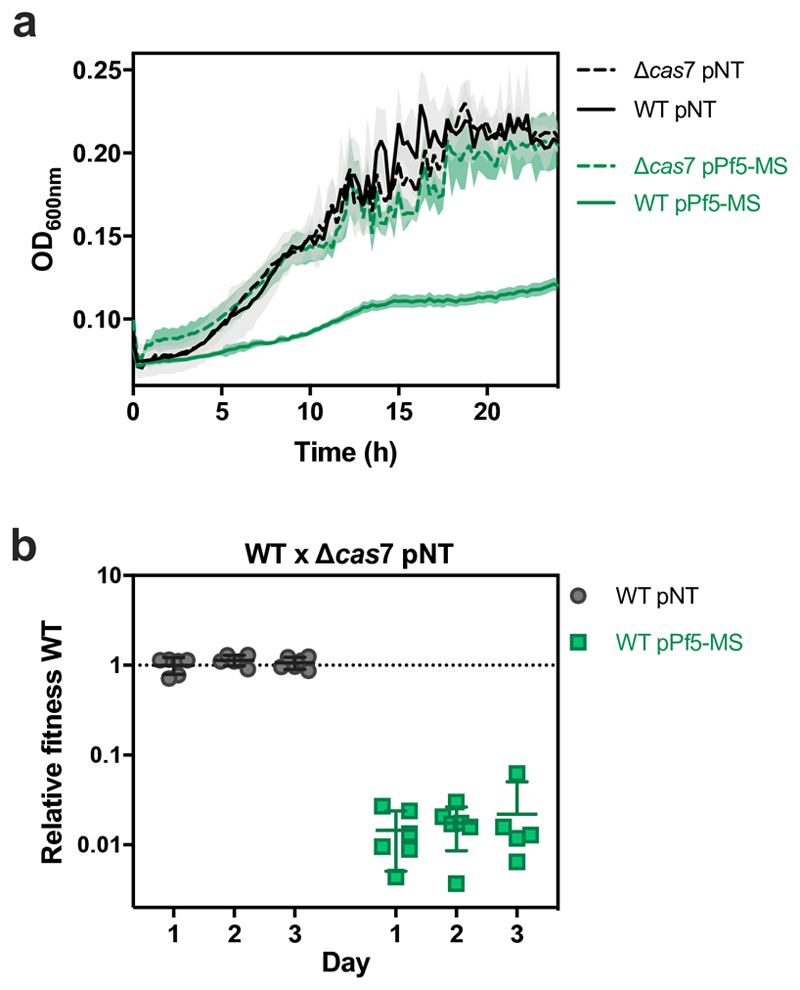
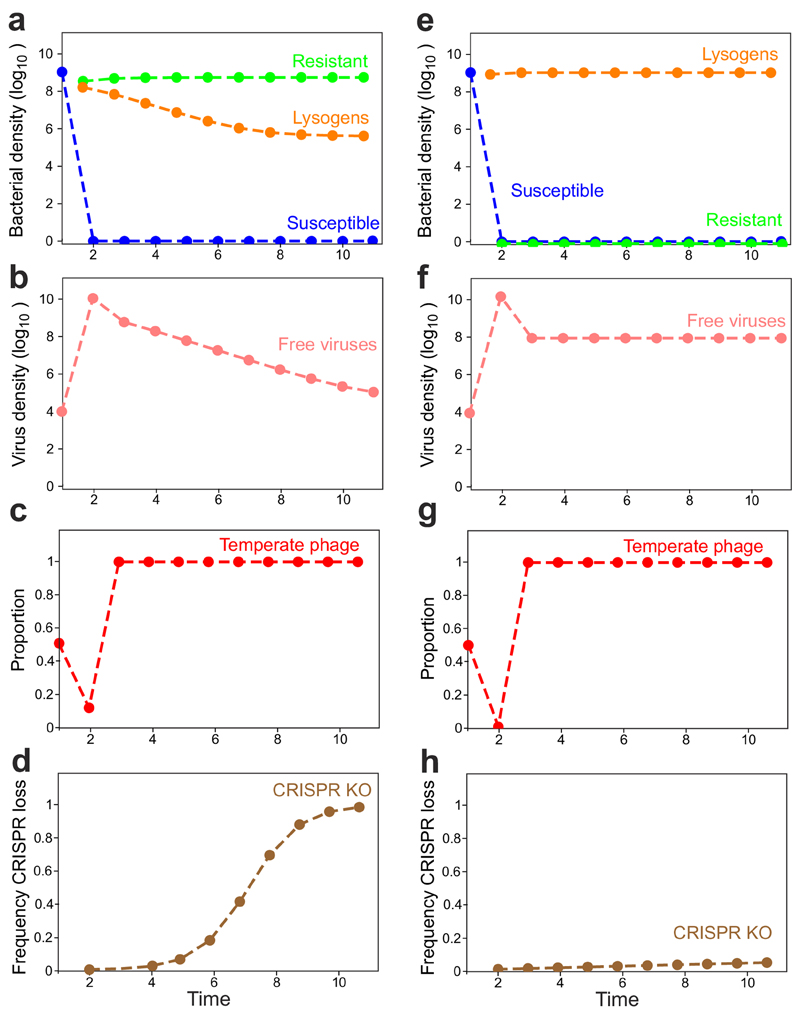
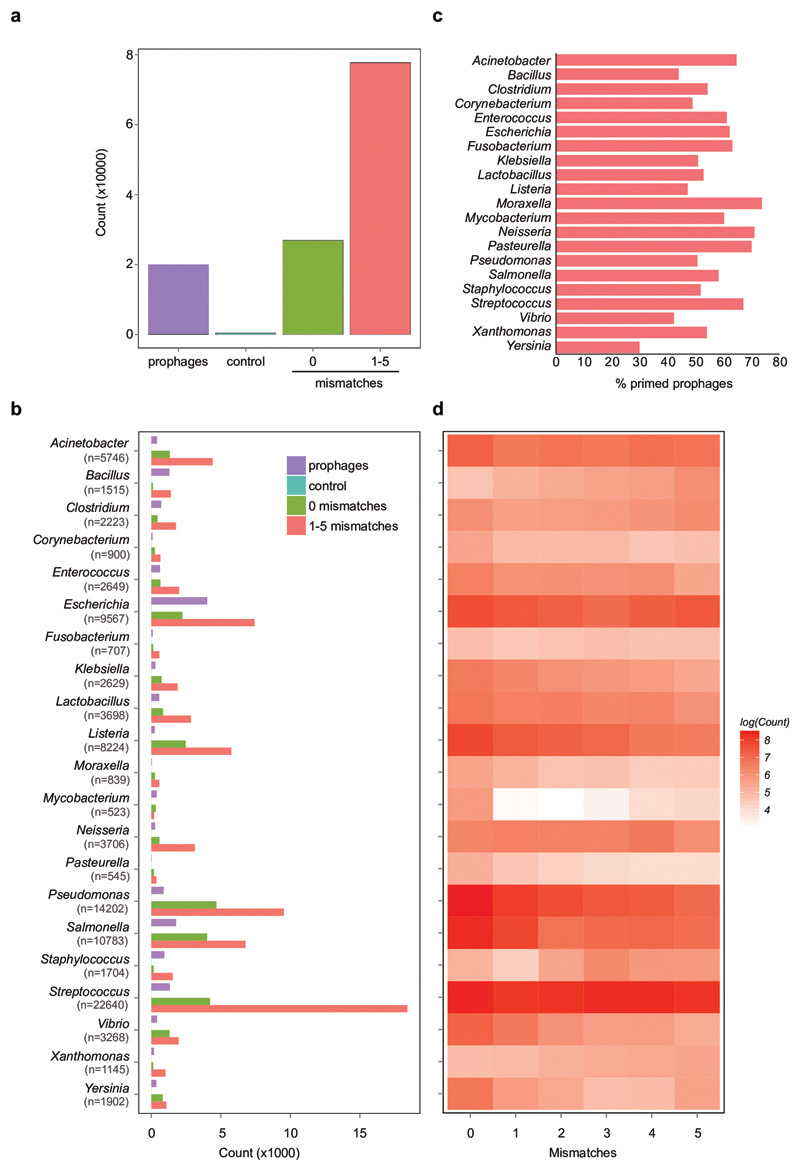
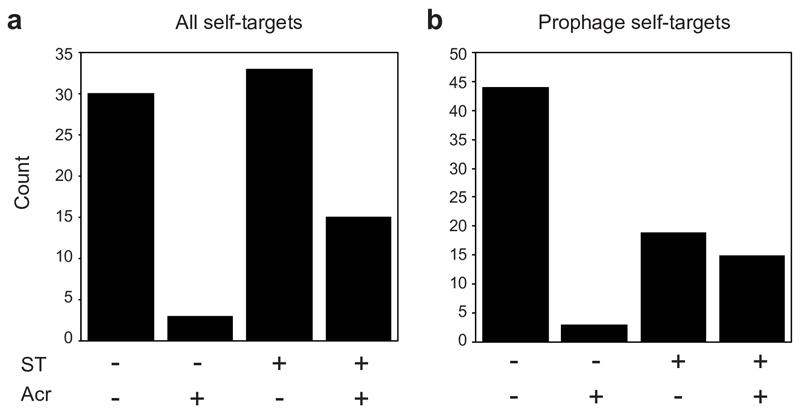
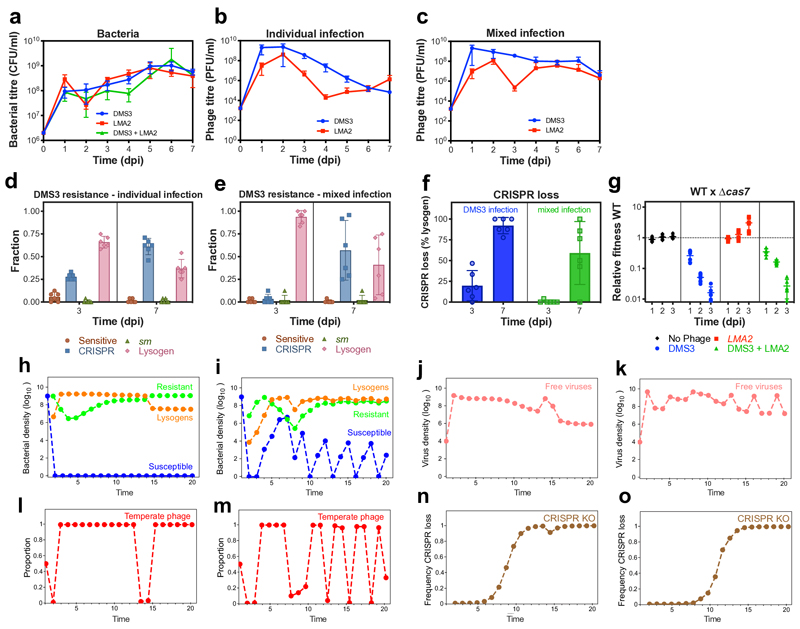
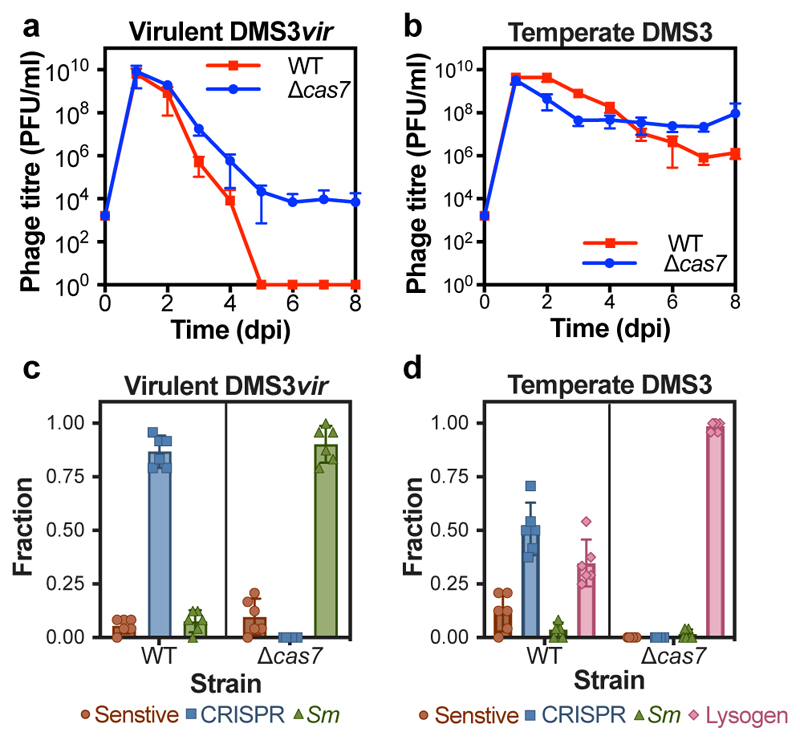
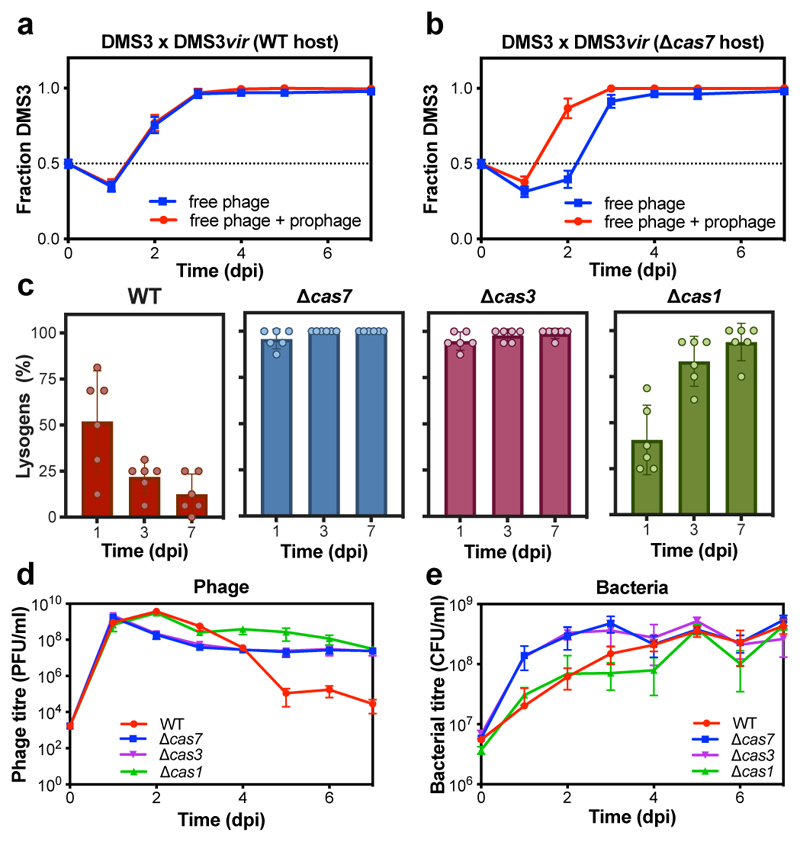
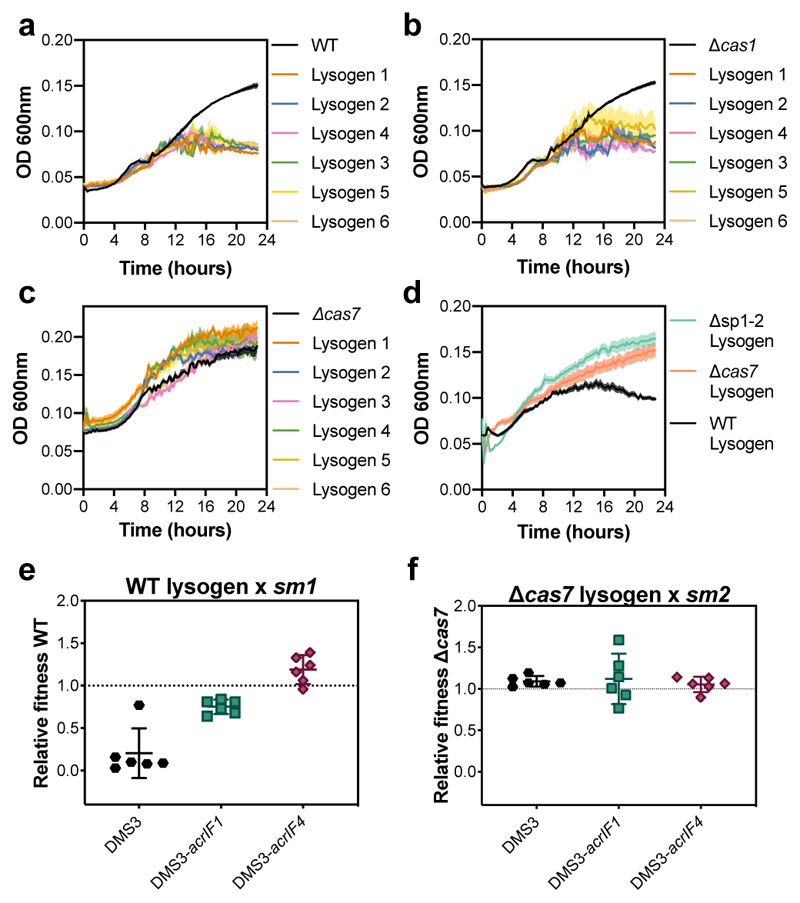
On infection of their host, temperate viruses that infect bacteria (bacteriophages; hereafter referred to as phages) enter either a lytic or a lysogenic cycle. The former results in lysis of bacterial cells and phage release (resulting in horizontal transmission), whereas lysogeny is characterized by the integration of the phage into the host genome, and dormancy (resulting in vertical transmission)1. Previous co-culture experiments using bacteria and mutants of temperate phages that are locked in the lytic cycle have shown that CRISPR-Cas systems can efficiently eliminate the invading phages2,3. Here we show that, when challenged with wild-type temperate phages (which can become lysogenic), type I CRISPR-Cas immune systems cannot eliminate the phages from the bacterial population. Furthermore, our data suggest that, in this context, CRISPR-Cas immune systems are maladaptive to the host, owing to the severe immunopathological effects that are brought about by imperfect matching of spacers to the integrated phage sequences (prophages). These fitness costs drive the loss of CRISPR-Cas from bacterial populations, unless the phage carries anti-CRISPR (acr) genes that suppress the immune system of the host. Using bioinformatics, we show that this imperfect targeting is likely to occur frequently in nature. These findings help to explain the patchy distribution of CRISPR-Cas immune systems within and between bacterial species, and highlight the strong selective benefits of phage-encoded acr genes for both the phage and the host under these circumstances.


Conflict of interest statement

Author Information

The authors declare no competing interests.

Figures

Extended Figure 1
Extended Figure 1. Infections with a 50:50 mix of temperate:virulent phages.
(a) Bacterial and (b) phage titres during a co-culture experiment of either WT PA14 (red) or Δcas7 mutant (blue) and a 50:50 mix of DMS3 and DMS3vir. (c) Resistance phenotypes at day 3 or (d) day 7 of the co-culture experiment, based on 24 random clones per replicate experiment. Data shown are the mean of 6 biological replicates per treatment. Error bars represent 95% c.i.
Extended Figure 2
Extended Figure 2. Suppression of lysogeny and immunopathological effects are due to spacer 1 of CRISPR array 2.
(a) Phage and (b) bacterial titres during co-culture of phage DMS3 and P. aeruginosa PA14ΔCRISPR2 expressing either a non-targeting spacer from a plasmid (ΔCRISPR2-NT) or the original CRISPR2 spacer 1 (ΔCRISPR2-sp1). (c)The proportion of lysogens and (d) the frequency of loss of CRISPR-Cas immune systems at 1 and 3 dpi, based on PCR analyses of 24 random clones per replicate experiment. Panels a to d show the mean of 3 biological replicates (error bars represent 95% c.i.) (e-g) Growth of 3 independent lysogen clones isolated at 3 dpi as determined by OD600nm measurements. (e) ΔCRISPR2-NT and (f) ΔCRISPR2-sp1 lysogen clones carry the ancestral ΔCRISPR2 CRISPR-Cas immune system, while (g) ΔCRISPR2-sp1 lysogen clones have evolved to lose CRISPR-Cas.
Extended Figure 3
Extended Figure 3. Prophage induction rates are increased in hosts with active CRISPR-Cas.
(a) Percentage lysogens formed upon infection of WT host with DMS3 phages engineered to produce AcrIF1 or AcrIF4 anti-CRISPR proteins. (b) Optical density and (c) phage titres during growth of lysogens of DMS3, DMS3-acrIFI or DMS3-acrIF4 in a WT PA14 or Δcas7 genetic background. (d) Relative fitness of DMS3 phage during competition with the virulent mutant DMS3vir in the presence of varying fractions of sensitive (Δcas7) host and resistant hosts with either CRISPR- (BIM) or surface-based immunity (sm2) against these phages. Data show mean fitness at 8 hours post-infection. All panels show the mean of 6 biological replicates and error bars represent 95% c.i.
Extended Figure 4
Extended Figure 4. Lysogens lose their CRISPR-Cas immune systems.
(a) PCR amplification of the c-repressor gene of the prophage (c-rep, 611 bp), the fimV gene (located ~ 1 Mb from the CRISPR loci, positive control for the PCR, 116 bp) and CRISPR loci 1 (349 bp) and 2 (206 bp) on the host genome. PCRs were performed on 6 independent DMS3 lysogens in WT, Δcas1 and Δcas7 backgrounds isolated at 1 or 7 dpi as well as on 6 independent lysogens of DMS3, DMS3-acrIF1 or DMS3-acrIF4 (WT background) isolated at 6 or 120 hours post infection. Red frames indicate failure to amplify a product. PCR amplifications were performed on clones isolated from 3 biological replicate experiments and produced similar results. For gel source data, see Supplementary Figure 1. (b) Schematic of the CRISPR-Cas locus of PA14 WT which spans a region of around 11 kb. Primers used to amplify regions of CRISPR arrays 1 or 2 are shown as red arrows. (c) Whole genome sequencing of DMS3 lysogens that lost their CRISPR-Cas system (red frames in panel a) in WT PA14, (d) Δcas1 or (e) Δcas7 backgrounds. Graphs show the read coverage of the region encompassing positions 2,700,000 – 2, 970,000 of WT PA14 genome. CRISPR-Cas locus is indicated by a green box on the x-axis. A genome map depicting coding sequences (yellow arrows) is shown above the graphs. Region comprised between 2.84-2.88 Mb includes sequences that are repeated elsewhere on PA14 genome, explaining why reads mapping these positions are still detected in some of the deletion mutants. High peak at the 3’-end of the CRISPR locus corresponds to the coverage of spacer 20 of CRISPR2 by reads that derive from DMS3 prophage (5’- and 3’ extremities of these reads map to phage genome). Spacer 20 of CRISPR2 has 100% identity to DMS3 but is not immunogenic because there is no consensus PAM.
Extended Figure 5
Extended Figure 5. Expression of Pf5 priming spacer in P. aeruginosa PA14.
(a) Growth of Δcas7 (dashed line) or WT (solid line) clones carrying an expression plasmid encoding a non-targeting spacer (pNT) or a spacer targeting PA14 natural prophage Pf5 with one mismatch (pPf5-MS) as determined by OD600nm measurements. Graphs show mean curves from 6 biological replicates and shaded areas corresponds to 95% c.i. (b) Relative fitness of WT pNT or WT pPf5-MS during competition with Δcas7 pNT. Data shown are the mean of 6 biological replicates per treatment. Error bars represent 95% c.i.
Extended Figure 6
Extended Figure 6. Simulations of population and evolutionary dynamics of bacteria-phage interactions, when virulent and temperate phages compete on bacteria with CRISPR-Cas system.
Graphs show densities of (a) susceptible hosts, CRISPR-resistant bacteria and lysogens or (b) free viruses over time, as well as (c) the frequency of temperate phages in a population composed of both temperate and virulent types. Note that temperate phages can transmit both horizontally and vertically, whereas virulent phages can transmit only horizontally and cannot superinfect lysogens. (d) Frequency of evolutionary loss of CRISPR-Cas system in the lysogen population over time. The simulations shown in (a-d) reflect the situation where both virulent and temperate phages lack acr genes, whereas (e-h) reflect the scenario where the temperate type carries an acr.
Extended Figure 7
Extended Figure 7. Matches between spacers and temperate phages are widespread.
(a) Total matches between non-redundant spacers (n=1,239,973) from 171,361 RefSeq and Genbank complete genomes and a non-redundant set of temperate phages (n=19,996). The counts of perfect (0) or mis-matched (1-5) targets are shown. As a control, the temperate phages were shuffled ten times retaining the hexanucleotide content (Control). (b) Counts of spacers matching temperate phages from all genera with over 500 spacer-prophage matches. The total number of spacer-prophage matches is shown for each genus in brackets (i.e. n=X). Counts of matches are shown (0 or 1-5 mismatches, green and red). The number of temperate phages analysed is plotted (Prophage, purple) and the matches to shuffled prophages (Control, blue; not visible as only 0 to 10 counts). (c) Percentage of prophages within each genus that were targeted by self-priming spacers (1-5 mismatches). (d) Heatmap of the distribution of mismatches (0-5). Genera are as in (b) and data is shown as log(Count) for each genus, as the number of matches varied widely between genera.
Extended Figure 8
Extended Figure 8. Self-targeting genomes are enriched for acr gene(s).
The number of P. aeruginosa genomes with complete CRISPR-Cas systems that contain (+) or lack (-) genes encoding known Acr. For these strains, the total with perfect (0) or mismatched (1-5) self-targeting (ST) spacers to (a) anywhere in the genome or to (b) prophages are shown. For complete P. aeruginosa genomes all self-targeting events were analysed for matches to prophages using PHASTER. The greater number of genomes with acr genes (Acr +) and self-targeting (ST +) compared to those without ST is significant (p = 8.14E-05, Fisher’s exact test, two sided, n=71).
Extended Figure 9
Extended Figure 9. Presence of a superinfecting virulent phage does not alter immunopathological effects.
(a) Bacterial and (b-c) phage titres upon (b) individual or (c) mixed infection of WT PA14 with phage DMS3 and virulent phage LMA2. (d-e) Resistance phenotypes evolved by bacteria against DMS3 upon (d) individual or (e) mixed infection. (f) Frequency of loss of CRISPR-Cas immune systems upon infection with phage DMS3 or with both phages DMS3 and LMA2, based on 24 random clones per replicate experiment. (g) Relative fitness of WT PA14 during competition with PA14 Δcas7 in the presence or absence of phages DMS3 and LMA2. All panels (a-g) show means of 6 biological replicates and error bars indicate 95% c.i. (h-o) Simulations of population and evolutionary dynamics during infection of bacteria carrying CRISPR-Cas systems with a mixed population of unrelated virulent and temperate phages. Graphs show densities of (h,i) susceptible hosts, CRISPR-resistant bacteria, lysogens and (j,k) free viruses over time, as well as (l,m) the frequencies of temperate phages in a population composed of both temperate and virulent types. Note that temperate phage can transmit both horizontally and vertically, whereas virulent phage can transmit only horizontally and can superinfect the lysogens (because temperate and virulent phages are unrelated). (n,o) Frequencies of evolutionary loss of CRISPR-Cas system in the lysogen population over time. The simulations shown in (h, j, l, n) reflect the scenario where bacteria can evolve CRISPR-based resistance against both phages, whereas (I, k, m, o) reflects the situation where CRISPR-based resistance does not evolve against the virulent phage and bacteria instead evolve costly surface-based resistance (as it is the case in the experiments). See also supplementary information for a detailed description of the simulations.
Figure 1
Figure 1. Phage persistence and host resistance evolution upon virulent or temperate phage infections.
(a) Phage densities over time following infection of WT PA14 or the Δcas7 mutant with DMS3vir or (b) DMS3. The limit of phage detection is 200 PFU/ml. (c) Fraction of bacteria that had evolved resistance at 3 dpi following infection with phage DMS3vir or (d) DMS3, either through CRISPR-Cas (CRISPR), surface modification (sm) or lysogeny (Lysogen). Fractions are based on 24 random clones per replicate experiment. In all panels, data shown are the mean of 6 biologically independent replicates per treatment. Error bars represent 95% confidence intervals (c.i.).
Figure 2
Figure 2. The impact of CRISPR adaptation and interference on lysogeny and phage persistence.
(a) Relative frequency of DMS3 over time following infection of WT PA14 or (b) the Δcas7 mutant host with an equal mix of DMS3 and DMS3vir. Relative frequencies are shown both for the free and total (i.e. including lysogens) phage population. (c) Percentage of DMS3 lysogens in the host population at 1, 3, or 7 dpi of either the WT PA14 strain, the isogenic CRISPR-interference deficient mutants Δcas7 and Δcas3, or the isogenic CRISPR-adaptation deficient mutant Δcas1, based on 24 random clones per replicate experiment per time point. (d) DMS3 phage and (e) bacterial densities during this co-culture experiment. In all panels, data shown are the mean of 6 biologically independent replicates per treatment. Error bars represent 95% c.i.
Figure 3
Figure 3. Fitness of lysogens with an active CRISPR-Cas system is reduced unless they encode acr genes.
(a) 24-hour growth curves of uninfected control cultures, or 6 independent DMS3 lysogens in WT PA14, (b) Δcas1 (CRISPR-adaptation deficient), and (c) Δcas7 (CRISPR-interference deficient) genetic backgrounds. Lysogens were isolated from day 1 of the co-culture experiment shown in Fig. 2. Curves are the mean of 6 (a,b) or 4 (c) replicates and shaded areas represent standard error of the mean. (d) 24-hour mean growth curves of 6 lysogens in WT, Δcas7 and Δsp1-2 (carrying a deletion of CRISPR2 spacers 1 and 2) backgrounds isolated from 6 biological replicates. Each growth curve was performed in 5 technical replicates. Shaded areas represent standard error of the mean. (e) Fitness relative to a surface mutant (sm) of WT PA14 lysogens isolated 1 day post infection with DMS3 or (f) PA14 Δcas7 lysogens isolated 1 day post infection with DMS3. Relative fitness was determined after 1 day of competition. Each point represents the average relative fitness of one independent lysogen clone measured across 6 biologically independent experiments and error bars indicate 95% c.i.
Figure 4
Figure 4. Lysogens evolve to mitigate fitness costs.
(a) Relative fitness of WT during competition with Δcas7 hosts following infection with 104 PFU of either DMS3, the lytic mutant DMS3vir, or the anti-CRISPR-encoding mutants DMS3-acrIF1 and DMS3-acrIF4. (b) Relative fitness of DMS3 (free phages + lysogens) following 3 days of competition with DMS3-acrIF1 or DMS3-acrIF4 on either WT PA14 or Δcas7 mutant. (c) 24-hour growth curves of uninfected control cultures, or 6 biologically independent DMS3 lysogens in the WT PA14 or (d) Δcas1 genetic backgrounds, which were isolated from day 7 of the co-culture experiment shown in Fig. 2. Curves are the mean of 6 replicates and error bars represent standard error of the mean. (e) Relative fitness of a DMS3 lysogen in a WT PA14 genetic background, isolated from day 5 of a co-culture experiment, during competition with a surface mutant. Relative fitness was calculated after 1 day of competition. All panels show the mean of 6 biologically independent replicates per treatment. Error bars represent 95% c.i. (panels a,b and e) or standard error of the mean (panels c and d).

Similar articles

Cited by

References

    1. Stewart FM, Levin BR. The population biology of bacterial viruses: Why be temperate. Theor Popul Biol. 1984;26:93–117. - PubMed
    1. Westra ER, et al. Parasite Exposure Drives Selective Evolution of Constitutive versus Inducible Defense. Curr Biol. 2015;25:1043–1049. - PubMed
    1. van Houte S, et al. The diversity-generating benefits of a prokaryotic adaptive immune system. Nature. 2016;532:385–388. - PMC - PubMed
    1. Barrangou R, et al. CRISPR Provides Acquired Resistance Against Viruses in Prokaryotes. Science. 2017;315:1709–1712. - PubMed
    1. Garneau JE, et al. The CRISPR/Cas bacterial immune system cleaves bacteriophage and plasmid DNA. Nature. 2010;468:67–71. - PubMed

Publication types