. 2020 Jan 8:10:2923.
doi: 10.3389/fimmu.2019.02923. eCollection 2019.

Helicobacter pylori Dampens HLA-II Expression on Macrophages via the Up-Regulation of miRNAs Targeting CIITA

Affiliations

Helicobacter pylori Dampens HLA-II Expression on Macrophages via the Up-Regulation of miRNAs Targeting CIITA

Gaia Codolo et al. Front Immunol. .

Abstract

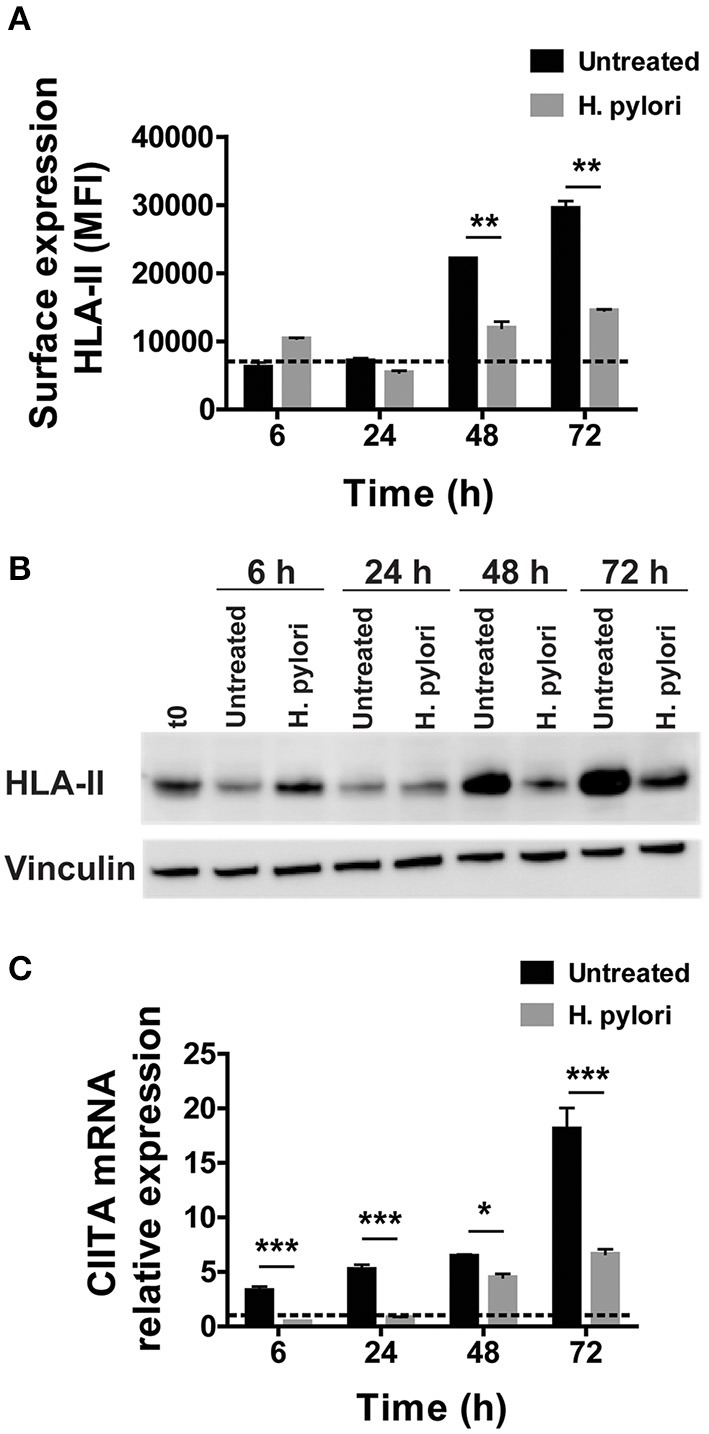
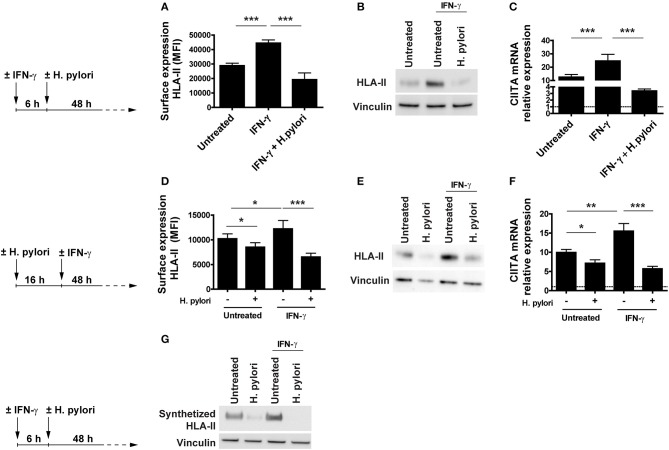
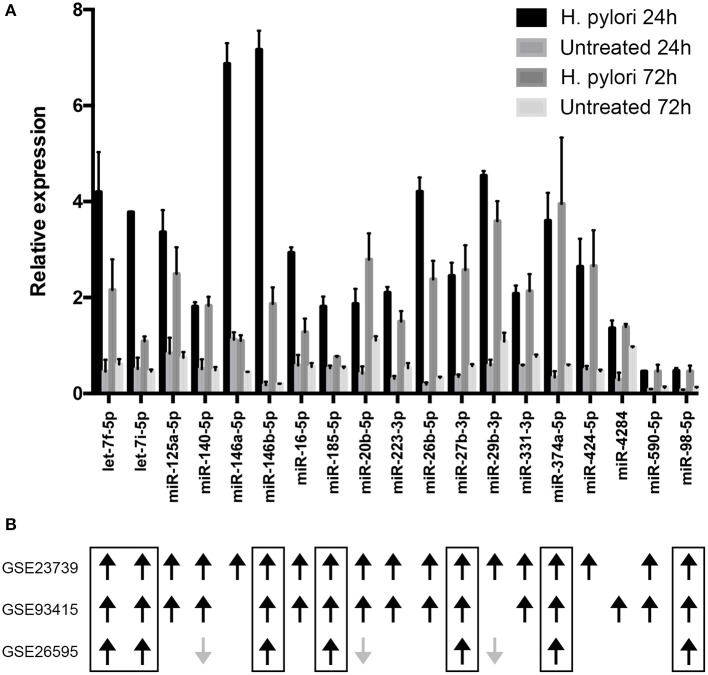
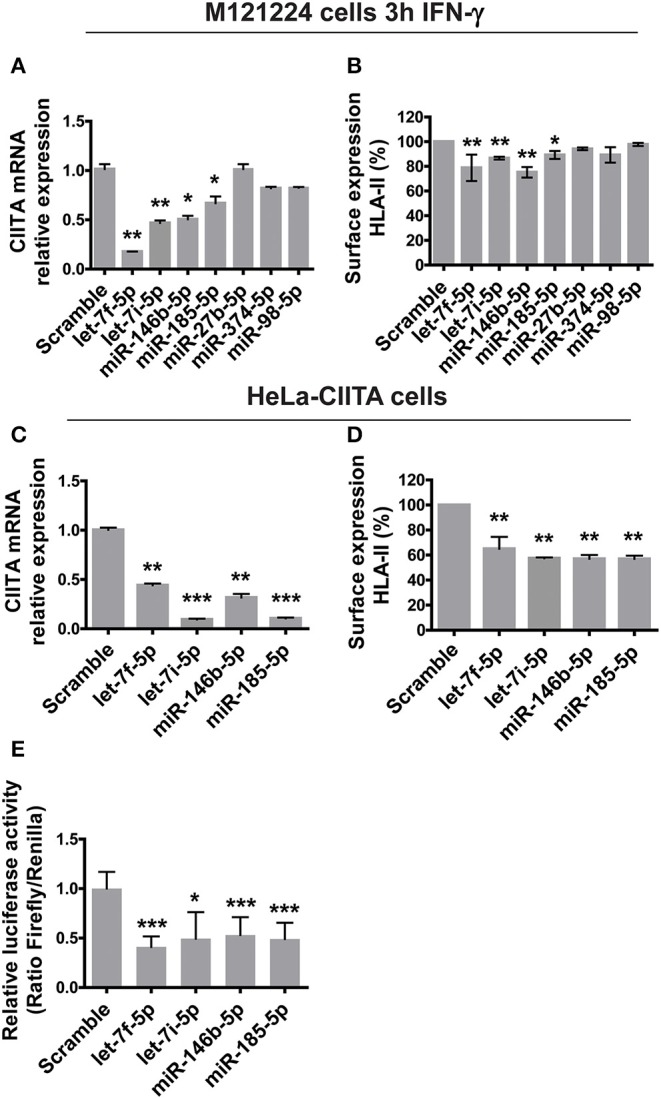
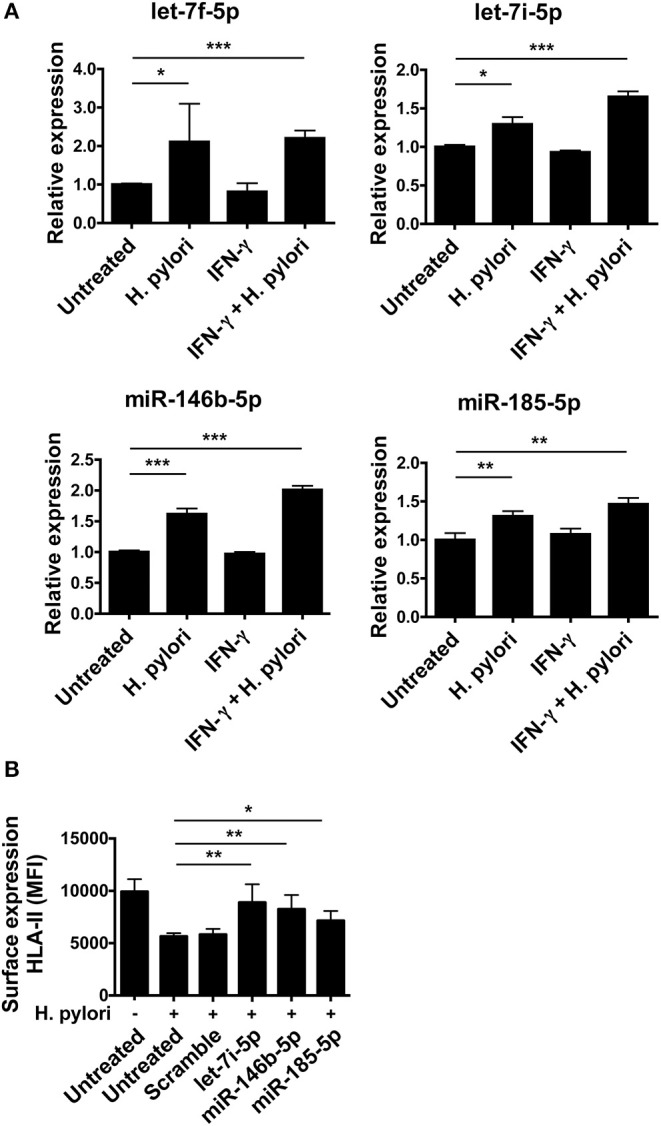
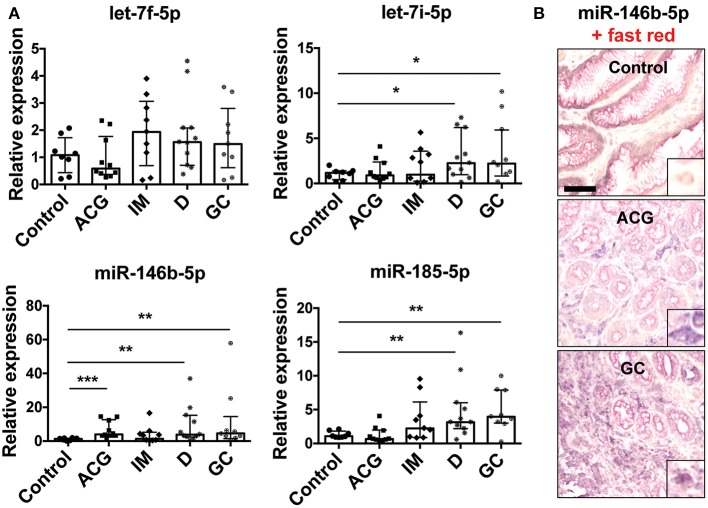
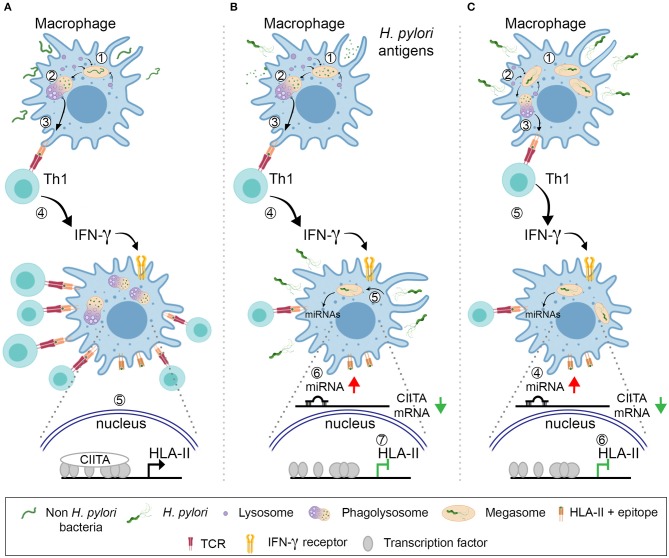
Macrophages have a major role in infectious and inflammatory diseases, and the available data suggest that Helicobacter pylori persistence can be explained in part by the failure of the bacterium to be killed by professional phagocytes. Macrophages are cells ready to kill the engulfed pathogen, through oxygen-dependent and -independent mechanisms; however, their killing potential can be further augmented by the intervention of T helper (Th) cells upon the specific recognition of human leukocyte antigen (HLA)-II-peptide complexes on the surface of the phagocytic cells. As it pertains to H. pylori, the bacterium is engulfed by macrophages, but it interferes with the phagosome maturation process leading to phagosomes with an altered degradative capacity, and to megasomes, wherein H. pylori resists killing. We recently showed that macrophages infected with H. pylori strongly reduce the expression of HLA-II molecules on the plasma membrane and this compromises the bacterial antigen presentation to Th lymphocytes. In this work, we demonstrate that H. pylori hampers HLA-II expression in macrophages, activated or non-activated by IFN-γ, by down-regulating the expression of the class II major histocompatibility complex transactivator (CIITA), the "master control factor" for the expression of HLA class II genes. We provided evidence that this effect relies on the up-regulation of let-7f-5p, let-7i-5p, miR-146b-5p, and -185-5p targeting CIITA. MiRNA expression analysis performed on biopsies from H. pylori-infected patients confirmed the up-regulation of let-7i-5p, miR-146b-5p, and -185-5p in gastritis, in pre-invasive lesions, and in gastric cancer. Taken together, our results suggest that specific miRNAs may be directly involved in the H. pylori infection persistence and may contribute to confer the risk of developing gastric neoplasia in infected patients.

Keywords: Helicobacter pylori; antigen presentation; gastric cancer; macrophages; miRNA.


Figures

Figure 1
Figure 1
Expression and transcriptional modulation of HLA-II in macrophages infected by H. pylori. (A) Surface expression of HLA-II protein in human macrophages infected by H. pylori (MOI 10) for 6, 24, 48, and 72 h. Data are expressed as median fluorescence intensity (MFI) ± SEM of five independent experiments. (B) HLA-II total cell content evaluated by Western blot in macrophages infected as in (A). Blot refers to a representative of three independent experiments. (C) Relative expression of mRNA encoding CIITA in macrophages infected as in (A). Data were normalized to an endogenous reference gene (β-actin). Values at T0 cells were taken as reference and set as 1 and the expression levels for treated cells were relative to the expression of T0 cells. Data are expressed as mean ± SEM of five independent experiments. Significance was determined by Student's t-test. *p < 0.05; **p < 0.01; and ***p < 0.001.
Figure 2
Figure 2
Expression and transcriptional modulation of HLA-II in IFN-γ-activated macrophages infected by H. pylori. (A) Surface expression of HLA-II protein in human macrophages activated for 6 h with 20 ng/ml IFN-γ before the infection with H. pylori (MOI 10) for 48 h. Data are expressed as MFI ± SEM of three independent experiments, performed with cells from three different donors. (B) HLA-II total cell content in macrophages infected as in (A), evaluated by Western blot. Blot refers to a representative of three independent experiments, performed with cells from three different donors. (C) Relative expression of mRNA encoding CIITA in macrophages activated as in (A). Data were normalized to an endogenous reference gene (β-actin). Values at T0 cells were taken as reference and set as 1 (dotted line); the expression levels for treated cells were relative to the expression of T0 cells. Data are expressed as mean ± SEM of three independent experiments, performed with cells from three different donors. (D) Surface expression of HLA-II protein in human macrophages infected for 16 h with H. pylori (MOI 10) and treated with 20 ng/ml IFN-γ for 48 h. Data are expressed as MFI ± SEM of three independent experiments, performed with cells from three different donors. (E) HLA-II total cell content in macrophages treated as in (D), evaluated by Western blot. Blot refers to a representative of three independent experiments, performed with cells from three different donors. (F) Relative expression of mRNA encoding CIITA in macrophages activated as in (D). Data were normalized to an endogenous reference gene (β-actin). Values at T0 cells were taken as reference and set as 1 (dotted line); the expression levels for treated cells were relative to the expression of T0 cells. Data are expressed as mean ± SEM of three independent experiments, performed with cells from three different donors. (G) HLA-II synthetic rate in macrophages treated as in (A). At the end of stimulation, macrophages were labeled with the methionine analog AHA (L-Azidohomoalanine) for 2 h. Cells were lysed, and newly synthetized proteins were tagged with biotin alkyne. Proteins were pulled down with neutravidin agarose resin, processed for Western blot and developed for HLA-II. Blot refers to a representative of three independent experiments, performed with cells from three different donors. Significance was determined by Student's t-test. *p < 0.05; **p < 0.01; and ***p < 0.001.
Figure 3
Figure 3
Relative expression of miRNAs putatively targeting CIITA transcript. (A) miRNA expression was evaluated by microarray in macrophages infected with H. pylori for 24 or 72 h. Data are expressed relative to the average of the expression of each miRNA. SD is relative to three biological replicates. Differentially expressed miRNAs were identified according to the significance analysis of microarray (SAM) using a median false discovery rate (FDR) of 0%. (B) Results of meta-analyses. Black arrows indicate miRNAs up-regulated in gastric cancer, while gray arrows indicate miRNAs down-regulated in gastric cancer. The Limma (Linear Models for Microarray Analysis) algorithm implemented in R package was used to identify differentially expressed miRNAs statistically significant. Benjamini and Hochberg correction was used to correct p values for multiple testing and it was considered if lower than 0.05.
Figure 4
Figure 4
Functional analysis of miRNAs modulated by H. pylori. (A) Relative expression of mRNA encoding CIITA in M121224 melanoma cells activated for 3 h with 50 ng/ml IFN-γ and then transfected with pCMV-miR plasmid carrying the indicated miRNAs for 48 h. Data were normalized to an endogenous reference gene (β-actin). Values of cells expressing miRNA scramble were taken as reference and set as 1. (B) Surface expression of HLA-II in M121224 cells treated as in (A). HLA-II expression in transfected cells was relative to control cells (expressing miRNA scramble). Data are expressed as mean ± SEM of three independent experiments, performed with 3 different cell preparations. (C) Relative expression of mRNA encoding CIITA in HeLa-CIITA cells transfected with pCMV-miR plasmid carrying the indicated miRNAs for 48 h. Data were normalized to an endogenous reference gene (β-actin). Values of cells expressing miRNA scramble were taken as reference and set as 1. (D) Surface expression of HLA-II in HeLa-CIITA cells treated as in (C). HLA-II expression in transfected cells was relative to control cells. Data are expressed as mean ± SEM of three independent experiments, performed with three different cell preparations. (E) Luciferase assay. Luciferase assay supports the interaction between let-7f-5p,−7i-5p, miR-146b-5p, and -185-5p and the 3′-UTR of CIITA. As controls, we used cells transfected with pCMV-miR plasmid encoding miRNA scramble. Data are expressed as mean ± SEM of three independent experiments. Significance was determined by Student's t-test. *p < 0.05; **p < 0.01; and ***p < 0.001.
Figure 5
Figure 5
Modulation of miRNA expression in H. pylori-infected macrophages. (A) Relative expression of miRNAs in macrophages activated or not for 6 h with 20 ng/ml IFN-γ and then infected with H. pylori (MOI 10) for 48 h. Data were normalized to an endogenous reference gene (U6). Values of untreated cells were taken as reference and set as 1; the expression levels for treated cells were relative to the expression of untreated cells. (B) Surface expression of HLA-II in infected macrophages silenced for the indicated miRNAs. Data are expressed as mean ± SEM of three independent experiments, performed with cells from three different donors. Significance was determined by Student's t-test. *p < 0.05; **p < 0.01; and ***p < 0.001.
Figure 6
Figure 6
Modulation of miRNA expression in gastric biopsies. (A) Relative expression of miRNAs in gastric biopsies from control biopsies (control, n = 8), patients with active non-atrophic chronic gastritis (ACG, n = 10), patients with intestinal metaplasia (IM, n = 9), with dysplasia (D, n = 11), and patients with gastric adenocarcinoma (GC, n = 9). Data were normalized to an endogenous reference gene (U6). Values of control biopsies were taken as reference and set as 1; the expression levels for patients were relative to the expression of control biopsies. Data are expressed as median with interquartile range (IQR). Significance was determined by the Mann–Whitney U-test. *p < 0.05; **p < 0.01; and ***p < 0.001. (B) Representative images of miR-146b-5p ISH in control biopsies, ACG and GC. Scale bar: 100 μm. In each case, a higher magnification (10×) of miR-146b-5p expression in macrophages is shown as right bottom inlet.
Figure 7
Figure 7
Model for the H. pylori action against the antigen presentation by HLA-II. (A) A common bacterium is engulfed by macrophages (1). Upon killing and digestion in the phagolysosomes (2), bacterial antigens are displayed by HLA-II molecules on the plasma membrane (3). Specific Th1 cells recognize the peptide–HLA-II complexes by TCR and release IFN-γ (4), which activates the transcription of CIITA (5). The increased number of HLA-II-epitopes that can be exposed on the cell surface maximizes the number of T cells activated and amplify the intensity of the ensuing immune response. (B) Macrophages internalize H. pylori antigens released by bacteria (1). Antigens are processed in phagolysosomes (2) and presented in HLA-II to Th1 lymphocytes (3). The latter release IFN-γ (4), but the cytokine action is hindered because of the surrounding/engulfed bacteria (5) that up-regulate the expression of CIITA-targeting miRNAs in macrophages (6). The number of HLA-II molecules does not increase (7) and the activation of Th1 cells with different epitope-specificity is compromised. (C) H. pylori infect macrophages and are phagocytosed (1); bacteria accumulate in megasomes and partial digestion occurs (2); bacterial epitopes are presented in HLA-II to Th1 lymphocytes (3). Concomitantly, the up-regulation of CIITA-targeting miRNAs is elicited (4) and this nullifies the effect of IFN-γ (5), in terms of HLA-II synthesis (6).

References

    1. Makola D, Peura DA, Crowe SE. Helicobacter pylori infection and related gastrointestinal diseases. J Clin Gastroenterol. (2007) 41:548–58. 10.1097/MCG.0b013e318030e3c3 - DOI - PubMed
    1. Sitarz R, Skierucha M, Mielko J, Offerhaus J, Maciejewski R, Polkowski W. Gastric cancer: epidemiology, prevention, classification, and treatment. Cancer Manage Res. (2018) 10:239–48. 10.2147/CMAR.S149619 - DOI - PMC - PubMed
    1. Correa P, Piazuelo MB. Helicobacter pylori infection and gastric adenocarcinoma. US Gastroenterol Hepatol Rev. (2011) 7:59–64. - PMC - PubMed
    1. Wang F, Meng W, Wang B, Qiao L. Helicobacter pylori-induced gastric inflammation and gastric cancer. Cancer Lett. (2014) 13:543–8. 10.1016/j.canlet.2013.08.016 - DOI - PubMed
    1. D'Elios MM, Amedei A, Benagiano M, Azzurri A, Del Prete G. Helicobacter pylori, T cells and cytokines: the dangerous liaisons. FEMS Immunol Med Microbiol. (2005) 44:113–9. 10.1016/j.femsim.2004.10.013 - DOI - PubMed

Publication types