. 2020 Jan 8:10:1300.
doi: 10.3389/fgene.2019.01300. eCollection 2019.

Molecular Characterization of New FBXL4 Mutations in Patients With mtDNA Depletion Syndrome

Affiliations

Molecular Characterization of New FBXL4 Mutations in Patients With mtDNA Depletion Syndrome

Sonia Emperador et al. Front Genet. .

Abstract

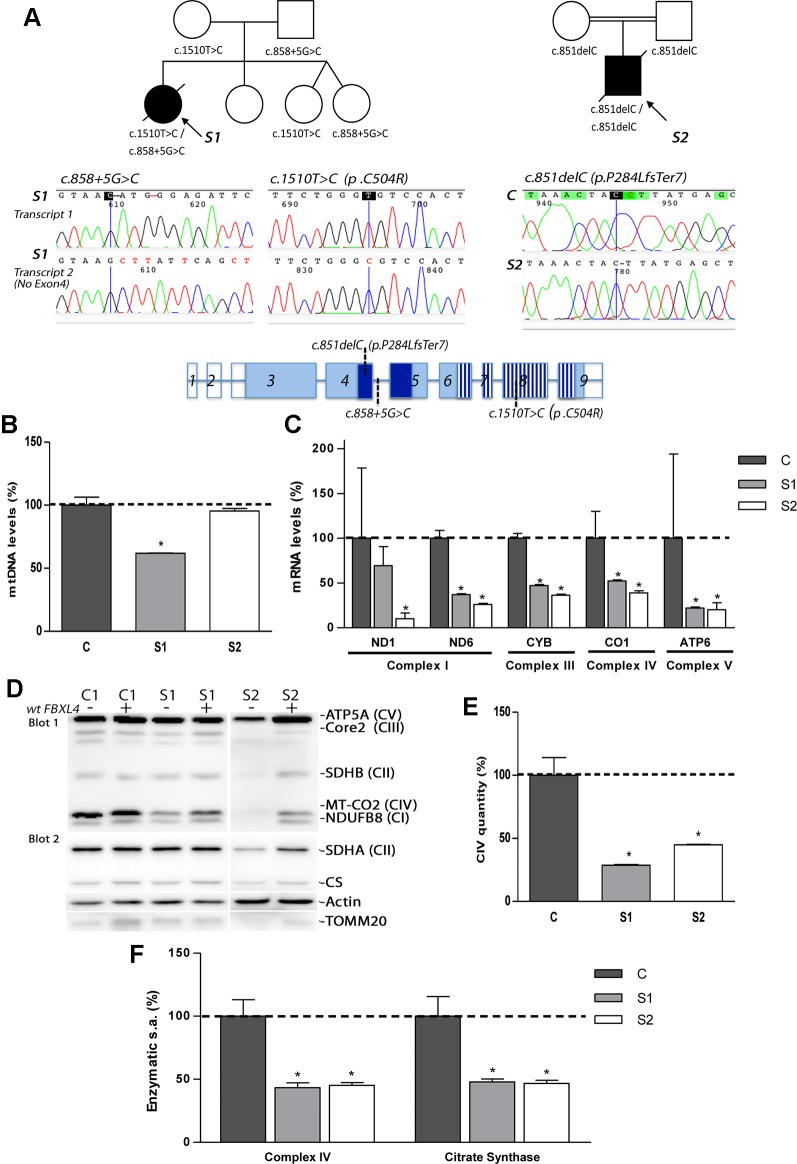
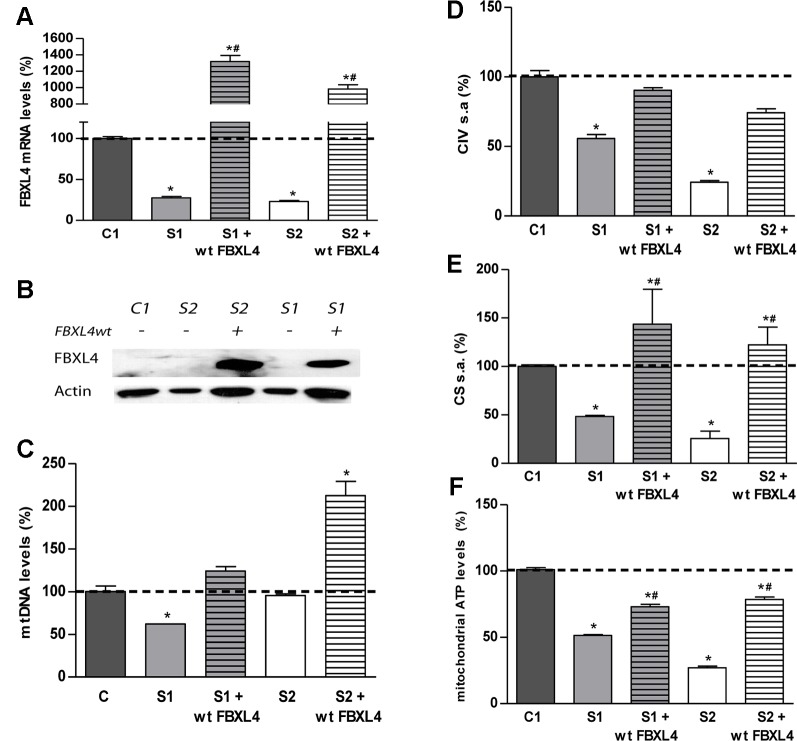
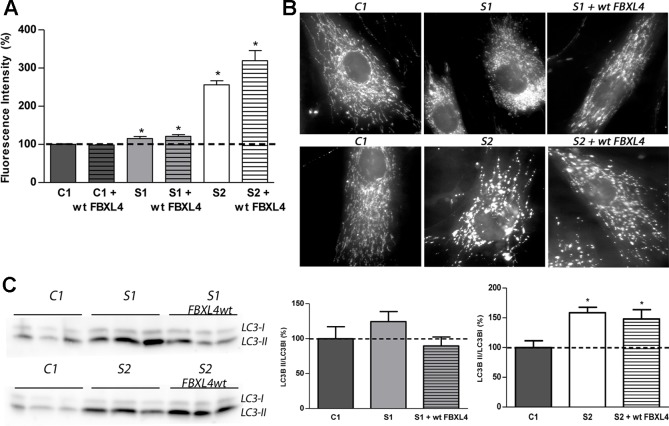
Encephalomyopathic mitochondrial DNA (mtDNA) depletion syndrome 13 (MTDPS13) is a rare genetic disorder caused by defects in F-box leucine-rich repeat protein 4 (FBXL4). Although FBXL4 is essential for the bioenergetic homeostasis of the cell, the precise role of the protein remains unknown. In this study, we report two cases of unrelated patients presenting in the neonatal period with hyperlactacidemia and generalized hypotonia. Severe mtDNA depletion was detected in muscle biopsy in both patients. Genetic analysis showed one patient as having in compound heterozygosis a splice site variant c.858+5G>C and a missense variant c.1510T>C (p.Cys504Arg) in FBXL4. The second patient harbored a frameshift novel variant c.851delC (p.Pro284LeufsTer7) in homozygosis. To validate the pathogenicity of these variants, molecular and biochemical analyses were performed using skin-derived fibroblasts. We observed that the mtDNA depletion was less severe in fibroblasts than in muscle. Interestingly, the cells harboring a nonsense variant in homozygosis showed normal mtDNA copy number. Both patient fibroblasts, however, demonstrated reduced mitochondrial transcript quantity leading to diminished steady state levels of respiratory complex subunits, decreased respiratory complex IV (CIV) activity, and finally, low mitochondrial ATP levels. Both patients also revealed citrate synthase deficiency. Genetic complementation assays established that the deficient phenotype was rescued by the canonical version of FBXL4, confirming the pathological nature of the variants. Further analysis of fibroblasts allowed to establish that increased mitochondrial mass, mitochondrial fragmentation, and augmented autophagy are associated with FBXL4 deficiency in cells, but are probably secondary to a primary metabolic defect affecting oxidative phosphorylation.

Keywords: F-box leucine-rich repeat protein 4; encephalomyopathic mtDNA depletion syndrome 13; mitochondrial DNA; mitochondrial disease; mtDNA depletion; mtDNA transcription; oxidative phosphorylation.


Figures

Figure 1
Figure 1
Genetic, molecular, and biochemical characterization of the patients. (A) Pedigrees of S1 and S2 with genotypes indicated under each symbol (black symbols designate affected subjects); sequencing electropherograms corresponding to the two different FBXL4-derived transcripts found in S1 and to the unique transcript found in S2; and FBXL4 gene structure (reference sequence NM_012160.4). In gene structure, empty boxes: non-coding exons; dark blue boxes: F-Box domain; striped boxes: leucine-rich repeats domain (LRRs). (B) Quantification of mtDNA copy number. The bars represent percentage of mtDNA normalized to nDNA relative to the mean value of controls levels (C, dotted line, 100%). *: Significant mtDNA copy-number reduction, p < 0.05, compared with C cells. (C) Mitochondrial transcript levels. For each transcript, the bars represents mean values, in percentage, relative to the mean value of control fibroblasts (C, dotted line, 100%). *: significant mtDNA reduction, p < 0.05, compared with C cells. (D) Steady-state levels of mitochondrial respiratory chain subunits. WB-immunodetection of SDS-PAGE separated total cellular protein isolated from patient S1, S2 and C fibroblasts (−), and those transduced with wt-FBXL4 expressing construct (+). An OXPHOS cocktail of antibodies was used in the upper membrane (blot 1) and the indicated antibodies were sequentially used in the lower membrane (blot 2). (E) Complex IV quantity (Microplate Assay). The bars represent the mean value of S1 and S2, in percentage, compared to that of controls fibroblasts (dotted line, 100%). *: p < 0.05 (vs. C cells). (F) Complex IV (CIV) and CS specific activities (s.a.) (Microplate Assay). The bars represent enzymatic activity of CIV and CS normalized for total cellular protein and compared to the mean value of controls fibroblasts in percentage (dotted line, 100%). *: p < 0.05 (vs. C cells).
Figure 2
Figure 2
FBXL4 complementation assays. (A) FBXL4 expression levels. Bars represent FBXL4 mRNA levels of patient fibroblasts compared to the mean value of an age-matched control in percentage (C1 dotted line, 100%). *: p < 0.05 (vs. C1 cells); #: p < 0.05 (vs. non-transduced cells). (B) FBXL4 protein levels. WB-immunodetection with anti-FBXL4 antibody of total cellular proteins isolated from S1, S2, and C1 fibroblasts, and those transduced with wt-FBXL4 expressing construct. (C) Quantification of mtDNA copy number of S1, S2, and C1 fibroblasts and those transduced with the wt-FBXL4 expressing construct. Bars represent the mean value of mtDNA normalized to nDNA, in percentage, relative to the mean value of controls levels (C, dotted line, 100%). *: p < 0.05 (vs. C cells); #: p < 0.05 (vs. non-transduced cells). (D) Complex IV specific activity of S1, S2, and C1 fibroblasts and of those transduced with the wt-FBXL4 expressing construct. Bars represent the mean value relative to that of control fibroblasts in percentage (C1, dotted line, 100%). *: p < 0.05 (vs. C1 cells). (E) CS specific activity of S1, S2, and C fibroblasts and those transduced with the wt-FBXL4 expressing construct. Bars represent the mean value relative to that of control fibroblasts, in percentage (C1, dotted line, 100%). *: p < 0.05 (vs. C1 cells); #: p < 0.05 (vs. non-transduced cells). (F) Mitochondrial ATP levels. Bars represent the mean values in S1, S2 and C1, S1 and S2 transduced with the wt-FBXL4 expressing construct, relative to that of control cells in percentage (C1, dotted line, 100%). *: p < 0.05 (vs. C1 cells); #: p < 0.05 (vs. non-transduced cells).
Figure 3
Figure 3
Mitochondrial network shape and size, and autophagy detection. (A) Quantification of mitochondrial mass. Bars represent the mean fluorescence values relative to the mean value of age-matched control fibroblasts in percentage (C1, dotted line, 100%). *: p < 0.05 (vs. C1 cells). (B) Mitochondrial networks of control and patients fibroblasts. Fluorescence microscopy representative images of cells obtained from control and patient fibroblasts and of those transduced with the wt-FBXL4 expressing construct, as indicated. (C) Quantification of autophagy marker LC3-II. WB-immunodetection of the LC3B isoforms (LC3B-I and LC3B-II) of total cell homogenates, and ratio LC3B-II/LC3B-I obtained by quantification of the respective WB-band intensities. The bars represent the mean value, in percentage, compared to that of control fibroblasts (dotted line, 100%). *: p < 0.05 (vs. C1 cells).

References

    1. Andreu A. L., Martinez R., Marti R., Garcia-Arumi E. (2009). Quantification of mitochondrial DNA copy number: pre-analytical factors. Mitochondrion 9 (4), 242–246. 10.1016/j.mito.2009.02.006 - DOI - PubMed
    1. Antoun G., McBride S., Vanstone J. R., Naas T., Michaud J., Redpath S., et al. (2016). Detailed biochemical and bioenergetic characterization of FBXL4-related encephalomyopathic mitochondrial DNA depletion. JIMD Rep. 27, 1–9. 10.1007/8904_2015_491 - DOI - PMC - PubMed
    1. Bonnen P. E., Yarham J. W., Besse A., Wu P., Faqeih E. A., Al-Asmari A. M., et al. (2013). Mutations in FBXL4 cause mitochondrial encephalopathy and a disorder of mitochondrial DNA maintenance. Am. J. Hum. Genet. 93 (3), 471–481. 10.1016/j.ajhg.2013.07.017 - DOI - PMC - PubMed
    1. Craig K. L., Tyers M. (1999). The F-box: a new motif for ubiquitin dependent proteolysis in cell cycle regulation and signal transduction. Prog. Biophys. Mol. Biol. 72 (3), 299–328. - PubMed
    1. DiMauro S., Schon E. A. (2003). Mitochondrial respiratory-chain diseases. N Engl. J. Med. 348 (26), 2656–2668. 10.1056/NEJMra022567 - DOI - PubMed