. 2020 Jan 8:9:1462.
doi: 10.3389/fonc.2019.01462. eCollection 2019.

Context-Dependent Roles for SIRT2 and SIRT3 in Tumor Development Upon Calorie Restriction or High Fat Diet

Affiliations

Context-Dependent Roles for SIRT2 and SIRT3 in Tumor Development Upon Calorie Restriction or High Fat Diet

Mohamed A Ahmed et al. Front Oncol. .

Abstract

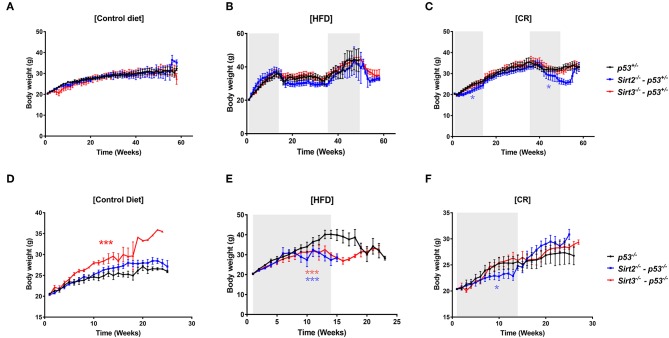
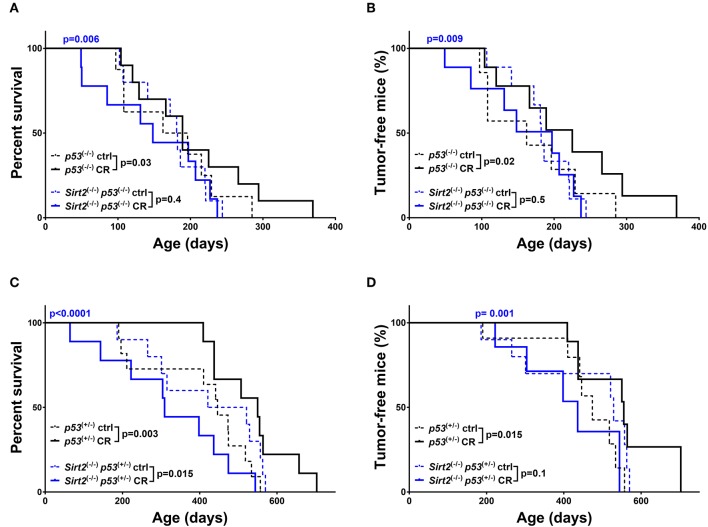
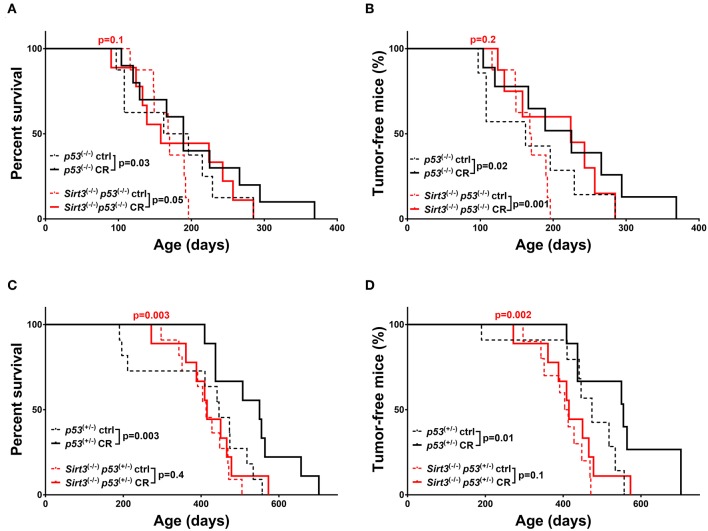
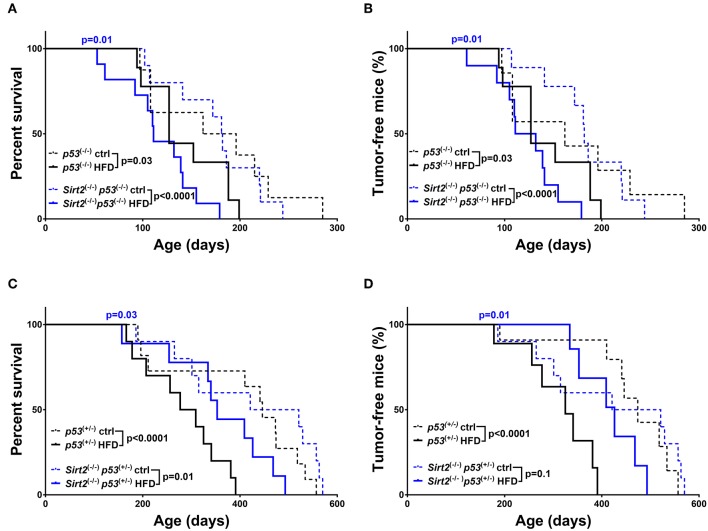
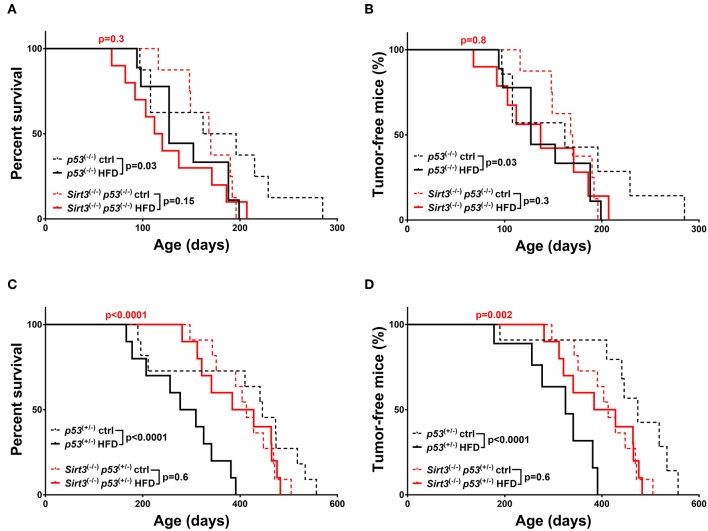
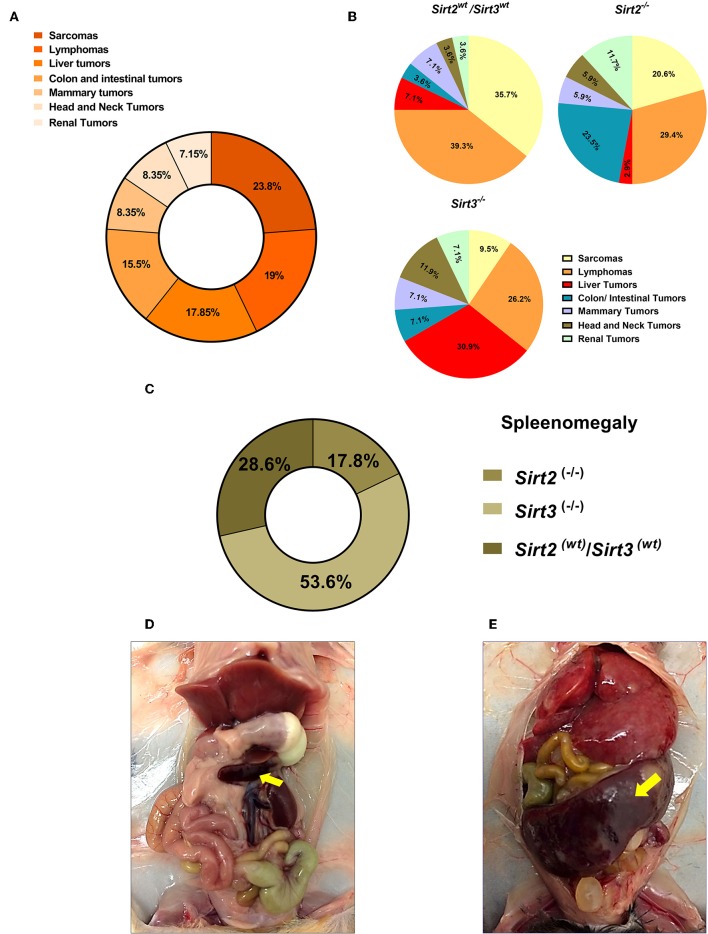
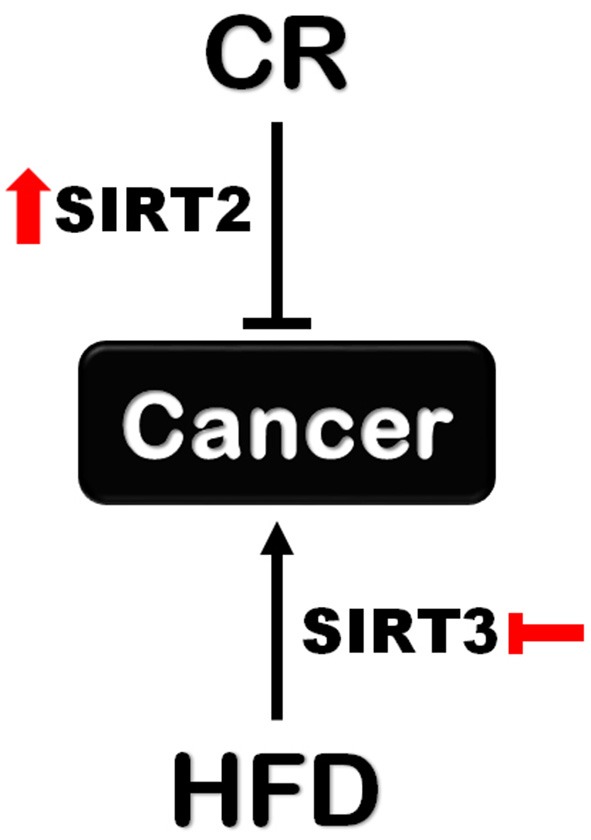
Calorie restriction (CR) is considered one of the most robust ways to extend life span and reduce the risk of age-related diseases, including cancer, as shown in many different organisms, whereas opposite effects have been associated with high fat diets (HFDs). Despite the proven contribution of sirtuins in mediating the effects of CR in longevity, the involvement of these nutrient sensors, specifically, in the diet-induced effects on tumorigenesis has yet to be elucidated. Previous studies focusing on SIRT1, do not support a critical role for this sirtuin family member in CR-mediated cancer prevention. However, the contribution of other family members which exhibit strong deacetylase activity is unexplored. To fill this gap, we aimed at investigating the role of SIRT2 and SIRT3 in mediating the anti and pro-tumorigenic effect of CR and HFD, respectively. Our results provide strong evidence supporting distinct, context-dependent roles played by these two family members. SIRT2 is indispensable for the protective effect of CR against tumorigenesis. On the contrary, SIRT3 exhibited oncogenic properties in the context of HFD-induced tumorigenesis, suggesting that SIRT3 inhibition may mitigate the cancer-promoting effects of HFD. Given the different functions regulated by SIRT2 and SIRT3, unraveling downstream targets/pathways involved may provide opportunities to develop new strategies for cancer prevention.

Keywords: SIRT2; SIRT3; aging; calorie restriction; cancer; high fat diet.


Figures

Figure 1
Figure 1
Body weight changes in response to the different diets. Body weights of Sirt2−/− (blue line), Sirt3−/− (red line), and control Sirt2wt/Sirt3wt (black line) mice heterozygous or nullizygous for p53 were measured weekly during exposure to (A,D) a control diet, (B,E) a high fat diet, or (C,F) a 30% calorie restricted diet. *p < 0.05, ***p < 0.001.
Figure 2
Figure 2
Sirt2 deficiency abolished CR-mediated increased survival and tumor protection in mice. Kaplan-Meier curves show overall survival (A,C) and tumor free survival (B,D). Sirt2−/−; p53−/− (blue lines) and p53−/− (black lines) mice (A,B), Sirt2−/−; p53+/− (blue lines) and p53+/− (black lines) (C,D) were included in the analysis. Mice were either calorie restricted (CR) or fed ad libitum control diet. Solid lines represent mice in the CR groups, whereas control diet groups are represented in dotted lines. The blue p-values on the top of each curve represent the statistical difference in survival and tumor incidence between calorie restricted Sirt2−/− mice, and calorie restricted Sirt2+/+ mice with similar p53 genotypes. All p-values are calculated using the log rank test.
Figure 3
Figure 3
Overall survival and tumor incidence in calorie-restricted Sirt3−/− mice. Kaplan-Meier curves show overall survival (A,C) and tumor free survival (B,D). Sirt3−/−; p53−/− (red lines) and p53−/− (black lines) mice (A,B), Sirt3−/−; p53+/− (red lines) and p53+/− (black lines) (C,D) were included in the analysis. Mice were either calorie restricted (CR) or fed ad libitum control diet. Solid lines represent mice in the CR groups, whereas control diet groups are represented in dotted lines. The red p-values on the top of each curve represent the statistical difference in survival and tumor incidence between calorie restricted Sirt3−/− mice, and calorie restricted Sirt3+/+ mice with similar p53 genotypes. All p-values are calculated using the log rank test.
Figure 4
Figure 4
Effect of Sirt2 deletion in overall survival and tumorigenesis upon HFD. Kaplan-Meier curves show overall survival (A,C) and tumor free survival (B,D). Sirt2−/−; p53−/− (blue lines) and p53−/− (black lines) mice (A,B), Sirt2−/−; p53+/− (blue lines) and p53+/− (black lines) (C,D) were included in the analysis. Mice were either fed a high fat diet (HFD) or fed ad libitum control diet. Solid lines represent mice in the HFD groups, whereas control diet groups are represented in dotted lines. The blue p-values on the top of each curve represent the statistical difference in survival and tumor incidence between HFD Sirt2−/− mice, and HFD Sirt2+/+ mice with similar p53 genotypes. All p-values are calculated using the log rank test.
Figure 5
Figure 5
Sirt3 deletion exhibited a protective effect against HFD-induced tumorigenesis. Kaplan-Meier curves show overall survival (A,C) and tumor free survival (B,D). Sirt3−/−; p53−/− (red lines), and p53−/− (black lines) mice (A,B), Sirt3−/−; p53+/− (red lines), and p53+/− (black lines) mice (C,D) were included in the analysis. Mice were either fed a high fat diet (HFD) or fed ad libitum control diet. Solid lines represent mice in the HFD groups, whereas control diet groups are represented in dotted lines. The red p-values on the top of each curve represent the statistical difference in survival and tumor incidence between HFD Sirt3−/− mice, and HFD Sirt3+/+ mice with similar p53 genotypes. All p-values are calculated using the log rank test.
Figure 6
Figure 6
Spectrum of tumors developed in the Sirt2 and Sirt3-deficient mice. (A) Percentages of different tumor types refer to proportion of all tumors reported, with sarcoma and lymphoma being the most prominent tumors reported. (B) Relative frequencies of the different types of tumors detected in Sirt2wt/Sirt3wt, Sirt2−/−, and Sirt3−/− mice, regardless of the dietary group, are displayed by pie charts. (C) 26 mice with splenomegaly were found in this study. Majority of cases (~54%) were reported in Sirt3 knockout mice. (D,E) Representative pictures of a mouse with normal spleen size (D) and a mouse with splenomegaly (E) are shown.
Figure 7
Figure 7
Different roles for SIRT2 and SIRT3 in tumorigenesis upon CR and HFD. Sirt2 is indispensable for the protective effect of CR against tumorigenesis supporting a cancer-preventive role for SIRT2 activation. On the other hand, Sirt3 loss renders mice resistant to HFD-induced tumorigenesis which supports the beneficial effect of SIRT3 inhibition in this context.

References

    1. Colman RJ, Beasley TM, Kemnitz JW, Johnson SC, Weindruch R, Anderson RM. Caloric restriction reduces age-related and all-cause mortality in rhesus monkeys. Nat Commun. (2014) 5:3557. 10.1038/ncomms4557 - DOI - PMC - PubMed
    1. Comfort A. The retardation of aging and disease by dietary restriction - weindruch, R, Walford, Rl. Nature. (1989) 338:469 10.1038/338469a0 - DOI
    1. Holehan AM, Merry BJ. The experimental manipulation of ageing by diet. Biol Rev Camb Philos Soc. (1986) 61:329–68. 10.1111/j.1469-185X.1986.tb00658.x - DOI - PubMed
    1. Lawler DF, Larson BT, Ballam JM, Smith GK, Biery DN, Evans RH, et al. . Diet restriction and ageing in the dog: major observations over two decades. Br J Nutr. (2008) 99:793–805. 10.1017/S0007114507871686 - DOI - PubMed
    1. Mattison JA, Roth GS, Beasley TM, Tilmont EM, Handy AM, Herbert RL, et al. . Impact of caloric restriction on health and survival in rhesus monkeys from the NIA study. Nature. (2012) 489:318–21. 10.1038/nature11432 - DOI - PMC - PubMed

LinkOut - more resources