. 2020 Apr 6;48(6):3257-3276.
doi: 10.1093/nar/gkaa010.

Genome-wide analysis reveals a switch in the translational program upon oocyte meiotic resumption

Affiliations

Genome-wide analysis reveals a switch in the translational program upon oocyte meiotic resumption

Xuan G Luong et al. Nucleic Acids Res. .

Abstract

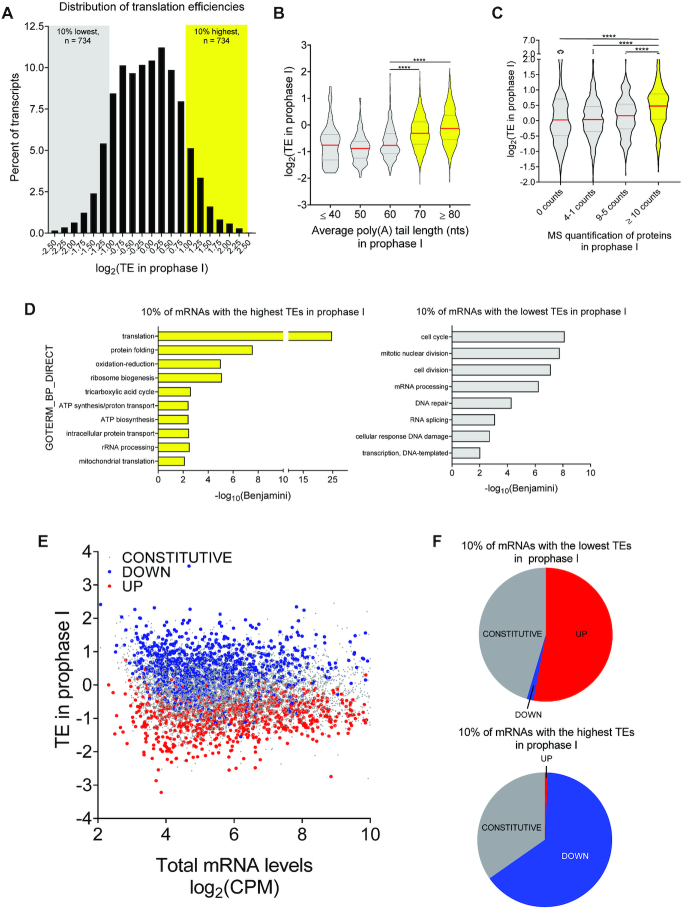
During oocyte maturation, changes in gene expression depend exclusively on translation and degradation of maternal mRNAs rather than transcription. Execution of this translation program is essential for assembling the molecular machinery required for meiotic progression, fertilization, and embryo development. With the present study, we used a RiboTag/RNA-Seq approach to explore the timing of maternal mRNA translation in quiescent oocytes as well as in oocytes progressing through the first meiotic division. This genome-wide analysis reveals a global switch in maternal mRNA translation coinciding with oocyte re-entry into the meiotic cell cycle. Messenger RNAs whose translation is highly active in quiescent oocytes invariably become repressed during meiotic re-entry, whereas transcripts repressed in quiescent oocytes become activated. Experimentally, we have defined the exact timing of the switch and the repressive function of CPE elements, and identified a novel role for CPEB1 in maintaining constitutive translation of a large group of maternal mRNAs during maturation.


Figures

Figure 1.
Figure 1.
The translational program during oocyte meiotic cell cycle involves both translational repression and activation. (A) Spindle and chromatin conformation in the oocyte during meiosis. Oocytes were matured in vitro and fixed at 0, 2, 4, 6 and 8 h post-meiotic resumption. Immunofluorescence staining for tubulin (green), kinetochores (red) and chromatin (blue) was performed. Maturing oocytes either presented chromosome condensation, but no spindle assembly (2 h, early pro-metaphase I), visible initial spindle formation (4 h, mid pro-metaphase I), progressive spindle formation with kinetochore attachment (6 h, late pro-metaphase I), or a fully attached, Met I-bipolar spindle (8 h, Met I). (B) Total mRNA levels and differential ribosome loading during meiotic progression as compared to Pro I. Oocytes were matured in vitro and collected at 0, 2, 4, 6 and 8 h post-meiotic resumption. Total RNA samples were collected prior to RiboTag-IP for each time point. cDNA libraries were prepared from total and ribosome-bound RNA samples, RNA-Seq was performed, and the data processed and analyzed as described in ‘Materials and Methods.’ The data are presented as volcano plots with log2(fold change) (LFC) CPM at each time point compared to 0 h and plotted against false discovery rate (FDR). Statistically significant increased (red) and decreased (blue) (FDR ≤ 0.05) genes are reported as well as non-significant changes (gray). –1 ≥ LFC ≥ 1 are considered biologically significant and are marked by dashed lines. Two biological replicates of 200 oocytes per time point were used for this experiment. (C) Changes in the transcriptome and translatome during meiosis. Met I data are derived from the experiment described in (B), Met II translation data are from a deposited dataset generated from oocytes matured in vivo followed by polysome fractionation/microarray (polysome array) (49,65), and Pro I-to-Met II total mRNA data were from a deposited dataset (66). The data are reported as scatterplots with LFC in total mRNA CPM at either Met I or Met II compared to Pro I versus the LFC of ribosome-bound mRNA CPM at the same time points. We identified four groups of messages: transcripts that showed significant changes only in translation (purple), significant changes only in total message levels (orange), no significant changes in translation nor in total transcript levels (gray), and significant changes in both translation and total transcript levels (black); significant changes are defined as FDR ≤ 0.05. Two biological replicates of 200 oocytes per time point were used to generate the RNA-Seq data, while six biological replicates of 500 oocytes per time point were used to generate the polysome array data. (D) Overlap of translatome changes between Met I and Met II. Both DOWN (blue) and UP (red) genes were analyzed. The data were collected as described in (C). –1 ≥ LFC ≥ 1 with FDR ≤ 0.05 are considered statistically significant.
Figure 2.
Figure 2.
Cell cycle components are regulated via translation in meiosis, but via transcription in mitosis (A) Gene ontology analysis of DOWN and UP genes. DOWN (blue) and UP (red) mRNAs significantly changed from 0 h (Pro I) to 8 h (Met I) post-meiotic resumption were used (–1 ≥ LFC ≥ 1 and FDR ≤ 0.05). Only terms with FDR ≤ 0.05 were considered. (B) Pairwise comparison of translation during meiosis and transcription during mitosis. FCs in translational efficiency (TE) from 0 h (Pro I) to 8 h (Met I) in our RNA-Seq dataset are plotted against FCs in RNA levels from S-phase to M-phase of a deposited dataset (50). (C) Heat maps comparing fold changes in translation of cell cycle components during meiosis in oocytes and fold changes in transcription or translation during the mitotic cell cycle. The data were collected as described in (B). Genes involved in the cell cycle are defined under GO:0007049.
Figure 3.
Figure 3.
Genome-wide analysis of translation reveals a switch in the translation program at the quiescence-to-meiotic cell cycle re-entry transition (A) Histogram of translational efficiencies in Pro I-arrested oocytes. Translation efficiency (TE) for individual mRNAs was calculated as the ratio between ribosome-associated and total mRNA CPMs. Plotted is the distribution of maternal mRNA TEs during Pro I. The 10% of mRNAs with the lowest TEs are designated as low-TE mRNAs (n = 734, gray box) and the 10% of mRNAs with the highest TEs as high-TE mRNAs (n = 734, yellow box); this definition is used for all subsequent comparisons. (B) Genome-wide relationship between TE and poly(A) tail length in Pro I-arrested oocytes. TE was calculated for individual mRNAs as described in (A). Deposited TAIL-Seq data on poly(A) tail length of maternal mRNAs during Pro I (52) were associated with TEs during this time. Median values are represented by red lines and the 25% and 75% quartiles are represented by black, dashed lines. Statistical significance was evaluated by unpaired, two-tailed t-tests. ****P < 0.0001. (C) Genome-wide relationship between TE and protein levels in Pro I-arrested oocytes. TE was calculated for individual mRNAs as described in (A). Deposited data on protein levels in Pro I-arrested oocytes as quantified by mass spectrometry (53) were compared to the TEs of maternal mRNAs. Median values are represented by red lines and the 25% and 75% quartiles are represented by black, dashed lines. Statistical significance was evaluated by unpaired, two-tailed t-test; ****P < 0.0001. (D) Gene ontology analysis of low- and high-TE maternal mRNAs in Pro I-arrested oocytes. Only terms with a Benjamini coefficient ≤0.05 were considered. (E) Genome-wide relationship between TE in Pro I and translation pattern during meiotic resumption of oocyte maternal mRNAs. TE was calculated for individual mRNAs as described in (A). The data are presented as a scatterplot of total mRNA CPMs compared to TE values in Pro I-arrested oocytes. Transcripts were then categorized as CONSTITUTIVE (gray), DOWN (blue) or UP (red) according to their translation pattern during maturation to Met I (–1 ≥ LFC ≥ 1 and FDR ≤ 0.05). (F) Detailed analysis of the relationship between TE in Pro I and translation pattern during meiotic resumption of low- and high-TE mRNAs. Pie charts report the percentage of low- or high-TE mRNAs in Pro I-arrested oocytes that are UP, DOWN or CONSTITUTIVE during meiotic maturation. Ninety-nine percent of low-TE mRNAs are either UP (53%) or CONSTITUTIVE (46%) and all the high-TE mRNAs are either DOWN (65%) or CONSTITUTIVE (35%).
Figure 4.
Figure 4.
Features associated with maternal mRNAs translated with high or low efficiency in prophase I-arrested oocytes (A) Genome-wide correlation between mRNA features with TE in Pro I-arrested oocytes. PAS density in the 3′UTR, GC content in the 3′ and 5′UTRs, ATG density in the 5′UTR, DAZL and CPEB cis-acting element densities in the 3′UTR, and 3′UTR and 5′UTR lengths were calculated as detailed in the ‘Methods and Materials.’ These data were then correlated with TEs during Pro I and Spearman correlation coefficients were calculated for every comparison; P < 0.0001 for all pairs. In mRNAs with higher TEs, the reduced number of 3′UTR cis-acting elements is not due to shorter 3′UTR length, as element number was normalized for 3′UTR length when calculating densities. (B) Detailed analysis of the relationship between TE in Pro I and presence of CPEs in the 3′UTR of low- and high-TE mRNAs. Pie charts report the percentage of low- or high-TE mRNAs in Pro I-arrested oocytes where a CPE could be identified. Scanning for CPE in the 3′ UTRs was performed as detailed in the ‘Materials and Methods.’ (C) Genome-wide relationship between TE and number of CPEs found within 100 nts of the PAS in Pro I-arrested oocytes. Median values are represented by red lines and the 25% and 75% quartiles are represented by black, dashed lines. Statistical significance was evaluated by unpaired, two-tailed t-tests; *P = 0.0313; ****P < 0.0001. (D) Detailed analysis of the relationship between TE in Pro I and the distance of the closest CPE to the PAS. Median values are represented by red lines and the 25% and 75% quartiles are represented by black, dashed lines. (E) Enrichment of low-TE mRNAs bound to CPEB1 in Pro I-arrested oocytes. Pro I-arrested oocytes were collected and RNA-IP followed by RT-qPCR was performed as described in the ‘Materials and Methods.’ Nlrp5 was used as a reference gene as it is known to not bind to CPEB1. Three biological replicates of 200 oocytes per time point were used and RT-qPCR reactions were run in triplicate. Data are presented as fold difference in mRNA levels in CPEB1-IP as compared to the IgG-IP. The bars represent the mean ± SEM of three experiments. TE and the number of putative CPEs for each gene are reported. *The Mos 3′UTR has a single embryonic CPE (67).
Figure 5.
Figure 5.
The presence of CPEs in the 3′UTR is associated with translational repression in prophase I-arrested oocytes. (A) TE values of members of the Oosp cluster during meiosis. The average and range of TEs are reported. (B) Polyadenylation state of members of the Oosp cluster in Pro I-arrested oocytes. Data were from a published TAIL-Seq study (52). (C) Accumulation of YPet reporters for Oosp1 and Oosp2 3′UTRs during meiotic maturation. Pro I-arrested oocytes were collected and microinjected with oligoadenylated YPet-Oosp1 (red) or YPet-Oosp2 (blue) mRNA along with polyadenylated mCherry mRNA. Oocytes were allowed to recover for 16 h after microinjection, released from cilostamide, and imaged for 16 h with a sampling frequency of 15 min. Each point is the mean ± SEM of individual oocyte traces obtained in three separate experiments. The total number of oocytes analyzed is in parentheses. (D) YPet reporters for Oosp1 and Oosp2 3′UTRs. 3′UTRs expressed in the oocytes were cloned downstream of the YPet ORF (yellow box). CPEs (gray ovals) and PASes (green hexagons) are shown along with nucleotide positions relative to the start of the 3′UTR. (E) Accumulation of Oosp1 and Oosp2 3′UTR YPet reporters in Pro I-arrested oocytes. Pro I-arrested oocytes were collected and microinjected with oligoadenylated YPet-Oosp1 (red) or YPet-Oosp2 (blue) mRNA along with polyadenylated mCherry mRNA. Oocytes were allowed to recover for 2.5 hrs after microinjection, maintained in Pro I, and imaged for 9 h with a sampling frequency of 15 min. Each point is the mean ± SEM of individual oocyte traces obtained in three separate experiments. The total number of oocytes analyzed is in parentheses. (F) Translation rates of the Oosp1 and Oosp2 YPet reporters in Pro I-arrested oocytes. The translation rate for each oocyte was calculated by linear regression of the reporter data (E) between 6 and 9 h. Mean ± SEM is reported. Statistical significance was evaluated by Mann–Whitney test; ****P < 0.0001. (G) Translation rates of oligoadenylated and polyadenylated Oosp1 YPet reporters in Pro I-arrested oocytes. Experimental conditions were as described in (E). The data were collected from two independent experiments (Supplementary Figure S5C) and the total number of oocytes analyzed and mean ± SEM are reported. Statistical significance was evaluated by Kruskal?–Wallis test; ****P < 0.0001 and ns: not significant. (H) Translation rates of oligoadenylated or polyadenylated Oosp2 3′UTR YPet reporter in Pro I-arrested oocytes. Pro I-arrested oocytes were collected and microinjected with either YPet-Oosp2-oligo(A) or YPet-Oosp2-poly(A) mRNA along with polyadenylated mCherry mRNA. Experimental conditions were as described in (E). The translation rate for each oocyte was calculated by linear regression of the reporter data (Supplementary Figure S5D) between 0 and 3 h or 6 and 9 h. The data were collected from two independent experiments and the total number of oocytes analyzed and mean ± SEM are reported. Statistical significance was evaluated by Kruskal–Wallis test; ****P < 0.0001 and ns: not significant. (I) Mutations of CPE(s) in the Oosp1 YPet reporter. The proximal site is designated as CPE1 and the distal as CPE2. CPE1 (TTTTAAATaaa) was mutated to ‘CGACAAATaaa,’, preserving the downstream, overlapping PAS, while CPE2 (TTTTAAT) was mutated to ‘CGACTCC’ as previously described (36). (J) Accumulation of wild type Oosp1, wild type Oosp2, and mutant Oosp1 reporters in Pro I-arrested oocytes. Pro I-arrested oocytes were collected and microinjected with oligoadenylated YPet-Oosp1 (red circle), YPet-Oosp2 (blue circle), YPet-Oosp1(ΔCPE1) (red square), YPet-Oosp1(ΔCPE2) (red triangle) or YPet-Oosp1(ΔCPE1+2) (red diamond) mRNA along with polyadenylated mCherry mRNA. Experimental conditions were as described in (E). Each point is the mean ± SEM of individual oocyte traces obtained in two separate experiments. The total number of oocytes analyzed is in parentheses. (K) Translation rates of wild type Oosp1, wild type Oosp2 and mutant Oosp1 reporters in Pro I-arrested oocytes. The translation rate for each oocyte was calculated by linear regression of the reporter data (J) between 6 and 9 h. Mean ± SEM is reported. Statistical significance was evaluated by Kruskal–Wallis test; ****P < 0.0001 and ns: not significant. (L) Accumulation of YPet-Oosp1 in Pro I-arrested CPEB1+/+, CPEB1+/− and CPEB1−/− oocytes. Oocytes were collected from hormone-primed wild type, Zp3-CreTCpeb1F/+, and Zp3-CreTCpeb1F/F mice. Experimental conditions were as described in (E). Each point is the mean ± SEM of individual oocyte traces obtained in two separate experiments. The total number of oocytes analyzed is in parentheses. (M) Translation rates of YPet-Oosp1 in Pro I-arrested CPEB1+/+, CPEB1+/− and CPEB1−/− oocytes. The translation rate for each oocyte was calculated by linear regression of the reporter data (L) between 6 and 9 h. Mean ± SEM is reported. Statistical significance was evaluated by Kruskal–Wallis test; **P = 0.0043 and ns: not significant.
Figure 6.
Figure 6.
Translational repression during oocyte re-entry into the cell cycle is dissociated from destabilization and requires deadenylation. (A) Time course of ribosome loading onto repressed candidate mRNAs (DOWN) during meiotic maturation. Values are from our RiboTag/RNA-Seq dataset and the mean and range of duplicate biological replicates are plotted. (B) Translational repression of endogenous mRNAs is dissociated from destabilization. Oocytes were matured in vitro up to Met II and samples were collected at different times during maturation. RNA was extracted from the oocytes, reverse transcribed, and used for RT-qPCR. Bcl2l10 was used as a reference gene as its levels are known to be stable during this time. Data are represented as fold changes in mRNA levels as compared to 0 hrs. Three biological replicates of 30 oocytes per time point were used and RT-qPCR reactions were run in triplicate. The bars represent the mean ± SEM of three experiments. Statistical significance was evaluated by Friedman tests; *P < 0.05. (C) Translational repression of endogenous Smc4 and Zp2 is associated with message deadenylation. Oocytes were either maintained in Pro I (0 h) or allowed to mature for 2 or 8 h. At the end of the incubation, RNA was extracted and used for PAT assays with anchored oligo-dT primers. A representative experiment of the three performed is reported.
Figure 7.
Figure 7.
Translational repression during meiotic maturation is recapitulated by the 3′UTR of DOWN mRNAs, requires CDK1 activation, and is prevented by the presence of a CPE in close proximity of the PAS. (A) The 3′UTR of Zp2 (high-TE in Pro I and DOWN transcript) recapitulates the rapid translation repression post-GVBD. Oocytes were injected with an oligoadenylated YPet-Zp2 mRNA together with a polyadenylated mCherry mRNA. Oocytes were then either maintained in Pro I with cilostamide treatment (empty circles) or allowed to mature (solid circles) and imaged for 10 h with a sampling frequency of 30 min. Data are reported as the fold change of the YPet/mCherry ratios as compared to 0 h. Each point is the mean ± SEM of individual oocyte traces obtained in two separate experiments. The total number of oocytes analyzed is in parentheses. (B) Translation rates of the YPet-Zp2 reporter in Pro I-arrested or maturing oocytes. The translation rate for each oocyte was calculated by linear regression of the reporter data (A) between 3 and 6 h. Mean ± SEM are reported. Statistical significance was evaluated by unpaired, two-tailed t-test; ****P < 0.0001. (C) Translation repression of the YPet-Zp2 reporter during meiosis resumption requires GVBD and CDK1 activation but not PKA activity. After microinjection of the YPet-Zp2 reporter, oocytes were released in cilostamide-free medium and incubated with a CDK1 inhibitor (5 μM dinaciclib) or a combination of CDK1 and PKA inhibitors (Rp-cAMPS) from the time of release (0 h). The translation rate for each oocyte was calculated by linear regression of the reporter data between 3 and 6 h. In another group, dinaciclib was added after GVBD at 2 h into incubation. Statistical significance was evaluated by unpaired, two-tailed t-tests; ns: not significant; **P = 0.0053. (D) Deletion mutagenesis of the Ccnb2 3′UTR. Pro I-arrested oocytes were collected, microinjected with oligoadenylated YPet-CcnB2 short or reporters fused to Ccnb2 3′UTRs with progressive deletions along with a polyadenylated mCherry reporter. Sixteen hours after microinjection, oocytes were either maintained in Pro I with cilostamide (empty circles) or allowed to mature (solid circles) and imaged for 6 hrs with a sampling frequency of 15 min. Data are reported as the fold change of the YPet/mCherry ratios as compared to 0 h. Each point is the mean ± SEM of individual oocyte traces obtained in two separate experiments. The total number of oocytes analyzed is in parentheses. (E) Insertion of a CPE in the 3′ UTR of Zp2 (DOWN), prevents repression during meiotic maturation. Pro I-arrested oocytes were collected, microinjected with oligoadenylated YPet-Zp2 +CPE mRNA together with a polyadenylated mCherry mRNA. Experimental conditions were as described in (A). Data are reported as the fold change of the YPet/mCherry ratios as compared to 0 h. Each point is the mean ± SEM of individual oocyte traces obtained in two separate experiments. The total number of oocytes analyzed is in parentheses. (F) Insertion of a CPE in close proximity of the PAS in the Oosp2 3′UTR prevents translational repression during meiotic maturation. Pro I-arrested oocytes were collected, microinjected with oligoadenylated YPet-Oosp2 or a reporter with a CPE inserted in the Oosp2 3′UTR along with a polyadenylated mCherry reporter. Oocytes were incubated for 16 hrs after microinjection, allowed to mature, and imaged for 16 h with a sampling frequency of 15 min. Data are reported as the fold change of the YPet/mCherry ratios as compared to 0 h. Each point is the mean ± SEM of individual oocyte traces obtained in three separate experiments. The total number of oocytes analyzed is in parentheses. (G) Detailed analysis of the relationship between translation patterns during meiotic resumption and the presence of CPEs in the 3′UTR. Pie charts report the percentage of CONSTITUTIVE or DOWN mRNAs in Pro I-arrested oocytes that have or lack CPEs in the 3′UTR.
Figure 8.
Figure 8.
CPEB binding to mRNAs activated during maturation is necessary, but not sufficient, for full translational activation (A) Pattern of ribosome loading onto UP mRNAs during meiotic maturation. mRNAs whose translation increased by at least 3-fold from Pro I to Met I in our RiboTag/RNA-Seq dataset are shown. Traces of the 149 mRNAs with the highest activation are in grey and transcripts recovered in the pellet of RNA-IP/RT-qPCR with CPEB1 antibody are in black. * denotes transcripts that are also immunoprecipitated by DAZL antibodies (data under review). (B) RiboTag-IP/RT-qPCR validation of ribosome loading for selected UP candidates. Zp3-CreTRiboTagF/F mice were hormone primed and the oocytes isolated. Oocytes were either maintained in Pro I or matured in vitro for 8 h and collected for downstream RiboTag-IP/RT-qPCR analysis. We quantified several candidates with some of the greatest fold changes in ribosome loading from Pro I to Met I. Dppa3 was used as a reference gene as it is known to be constitutively translated during this time. Data are represented as fold changes in message levels as compared to 0 h. Three biological replicates of 200 oocytes per time point were used and RT-qPCR reactions were run in triplicate. The bars represent the mean ± SEM of three experiments. Statistical significance was evaluated by unpaired, two-tailed t-tests; ****P < 0.0001. (C) The effect of CDK1 inhibition on the translation of Ccnb1 mRNA (UP). Pro I-arrested oocytes were collected and microinjected with oligoadenylated YPet-Ccnb1 3′UTR mRNA along with polyadenylated mCherry mRNA. Oocytes were incubated for 16 h then two groups of oocytes were maintained in Pro I with either cilostamide (empty, black circle) or dinaciclib without cilostamide (blue circle). Another two groups of oocytes were either matured without (solid, black circle) or with dinaciclib added at 2 h after release (red circle). Imaging started 2 h after cilostamide release and lasted for 10 h with a sampling frequency of 15 min. Each point is the mean ± SEM of individual oocyte traces obtained in three separate experiments. The total number of oocytes analyzed is in parentheses. (D) Translation rates of YPet-CcnB1 and YPet-Ewsr1 are affected by CDK1 inhibition during meiotic maturation. The translation rate for each oocyte was calculated by linear regression of the reporter data (C and Supplementary Figure S14C and D) between 8 and 12 h. Mean ± SEM is reported. Statistical significance was evaluated by Kruskal–Wallis test; ns: not significant; ****P < 0.0001. (E) Detailed analysis of the relationship between mRNAs that are translationally activated during meiotic resumption and the presence of CPEs in the 3′UTR. Pie charts report the percentage of UP mRNAs in Pro I-arrested oocytes that have or lack CPEs in the 3′UTR. (F) CPEB1 is required for efficient translational activation of CcnB1. CPEB1+/+ (black), CPEB1+/− (light red) and CPEB1−/− (red) oocytes were collected, maintained in Pro I, and microinjected with oligoadenylated YPet-CcnB1 mRNA along with polyadenylated mCherry mRNA. After 2.5 h incubation, oocytes were matured and imaged for 10 h with a sampling frequency of 15 min. Each point is the mean ± SEM of individual oocyte traces obtained in two separate experiments. The total number of oocytes analyzed is in parentheses. (G) Translation rates of the YPet-CcnB1 reporter during oocyte maturation in CPEB1+/+, CPEB1+/− and CPEB1−/− oocytes. The translation rate for each oocyte was calculated by linear regression of the reporter data (F) between 0 and 2 h or 6 and 10 h. Mean ± SEM is reported. Statistical significance was evaluated by Kruskal–Wallis test; ns: not significant; ****P < 0.0001. (H) Accumulation of wild type Oosp1 and mutant Oosp1 YPet reporters during meiotic maturation. Pro I-arrested oocytes were collected and microinjected with oligoadenylated YPet-Oosp1 (circle), YPet-Oosp1(ΔCPE1) (square), YPet-Oosp1(ΔCPE2) (triangle) or YPet-Oosp1(ΔCPE1+2) (diamond) mRNA along with polyadenylated mCherry mRNA. After 16 h of recovery after microinjection, oocytes were allowed to mature, and imaged for 10 h with a sampling frequency of 15 min. Each point is the mean ± SEM of individual oocyte traces obtained in two separate experiments. The total number of oocytes analyzed is in parentheses. (I) Translation rates of wild type Oosp1 and mutant Oosp1 YPet reporters during meiotic maturation. The translation rate for each oocyte was calculated by linear regression of the reporter data (H) between 0 and 2 h or 6 and 10 h (post-GVBD). Mean ± SEM is reported. Statistical significance was evaluated by Kruskal–Wallis test; ns: not significant; ****P < 0.0001.

References

    1. Chen T.P., Dent S.Y.R.. Chromatin modifiers and remodellers: regulators of cellular differentiation. Nat. Rev. Genet. 2014; 15:93–106. - PMC - PubMed
    1. Klemm S.L., Shipony Z., Greenleaf W.J.. Chromatin accessibility and the regulatory epigenome. Nat. Rev. Genet. 2019; 20:207–220. - PubMed
    1. Rissland O.S. The organization and regulation of mRNA-protein complexes. Wiley Interdiscipl. Rev.-RNA. 2017; 8:doi:10.1002/wrna.1369. - PMC - PubMed
    1. Rissland O.S., Subtelny A.O., Wang M., Lugowski A., Nicholson B., Laver J.D., Sidhu S.S., Smibert C.A., Lipshitz H.D., Bartel D.P.. The influence of microRNAs and poly(A) tail length on endogenous mRNA-protein complexes. Genome Biol. 2017; 18:211. - PMC - PubMed
    1. Wu X.Y., Brewer G.. The regulation of mRNA stability in mammalian cells: 2.0. Gene. 2012; 500:10–21. - PMC - PubMed

Publication types

MeSH terms