. 2020 Dec;76(4):1273-1284.
doi: 10.1111/biom.13220. Epub 2020 Feb 3.

Nonnegative decomposition of functional count data

Affiliations

Nonnegative decomposition of functional count data

Daniel Backenroth et al. Biometrics. 2020 Dec.

Abstract

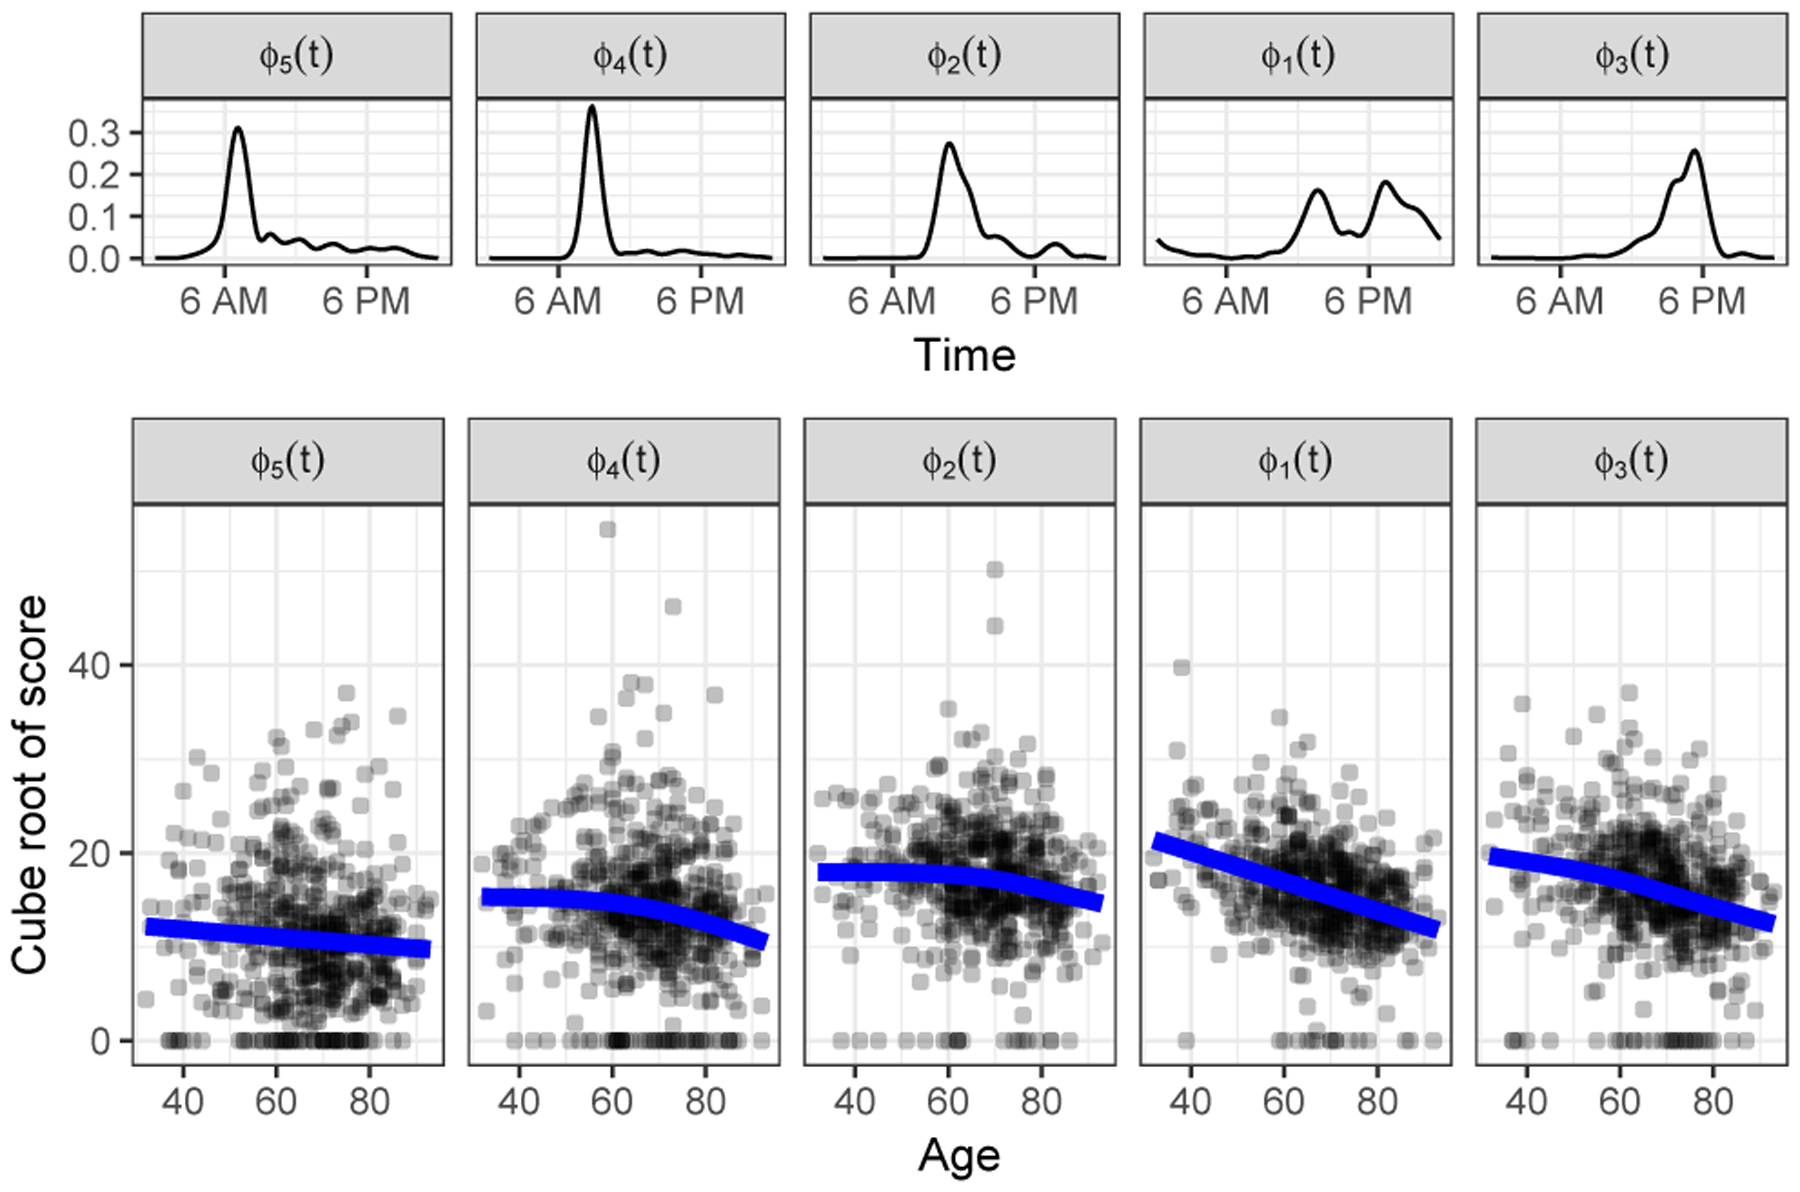
We present a novel decomposition of nonnegative functional count data that draws on concepts from nonnegative matrix factorization. Our decomposition, which we refer to as NARFD (nonnegative and regularized function decomposition), enables the study of patterns in variation across subjects in a highly interpretable manner. Prototypic modes of variation are estimated directly on the observed scale of the data, are local, and are transparently added together to reconstruct observed functions. This contrasts with generalized functional principal component analysis, an alternative approach that estimates functional principal components on a transformed scale, produces components that typically vary across the entire functional domain, and reconstructs observations using complex patterns of cancellation and multiplication of functional principal components. NARFD is implemented using an alternating minimization algorithm, and we evaluate our approach in simulations. We apply NARFD to an accelerometer dataset comprising observations of physical activity for healthy older Americans.

Keywords: accelerometers; functional data; nonnegative matrix factorization.


Figures

Figure 1.
Figure 1.
On the left is the raw data for one subject, showing activity summed over 5 days, binned in 10 minute intervals. A smooth, fit via a generalized additive model with Poisson responses and a logarithmic link function with 15 basis functions, is also included. On the right are smooth estimates for 50 subjects, including the subject shown on the left.
Figure 2.
Figure 2.
Simulated FPCs and NARFD estimates for data generated using the NARFD model, for different numbers of curves per simulation replicate. Each simulation was replicated 100 times. A color version of this figure can be found in the electronic version of this article.
Figure 3.
Figure 3.
Negative Poisson log-likelihood for data generated using the NARFD model and fitted using NARFD and GFPCA (left) and of data generated using the GFPCA model and fitted using NARFD and GFPCA (right), where I = 50 and K = 25. A color version of this figure can be found in the electronic version of this article.
Figure 4.
Figure 4.
First five estimated functional prototypes/FPCs for BLSA data. GFPCA FPCs are shown on the scale on which they are estimated (prior to exponentiation).
Figure 5.
Figure 5.
Reconstruction of a subject’s data using 5 functional prototypes/FPCs, obtained using NARFD and GFPCA. Activity counts are shown in light dots, and cumulative contributions of the mean and the functional prototypes/FPCs are shown as lines. Only the GFPCA reconstructions include a mean. A color version of this figure can be found in the electronic version of this article.
Figure 6.
Figure 6.
The cube root of NARFD scores for 592 subjects for each of 5 functional prototypes as a function of age (bottom). Functional prototypes (top) are ordered by the location of their peak, from early morning to evening. The lines show predictions from a generalized additive multivariate model fit to the cube root of the scores. A color version of this figure can be found in the electronic version of this article.
Figure 7.
Figure 7.
Negative Poisson log-likelihood for held-out curves from BLSA data for NARFD and GFPCA, decomposed using 1 through 12 functional prototypes/FPCs estimated using 50 curves from the BLSA data. A color version of this figure can be found in the electronic version of this article.

References

    1. Agniel D, Xie W, Essex M, Cai T, et al. (2018). Functional principal variance component testing for a genetic association study of HIV progression. The Annals of Applied Statistics 12, 1871–1893. - PMC - PubMed
    1. Bai J, He B, Shou H, Zipunnikov V, Glass TA, and Crainiceanu CM (2014). Normalization and extraction of interpretable metrics from raw accelerometry data. Biostatistics 15, 102–116. - PMC - PubMed
    1. Bertsekas DP (2012). Incremental gradient, subgradient, and proximal methods for convex optimization: A survey In Sra S, Nowozin S, and Wright SJ, editors, Optimization for Machine Learning, chapter 4, pages 85–120. The MIT Press, Cambridge, Massachusetts.
    1. Box GEP and Cox DR (1964). An analysis of transformations (with discussion). Journal of the Royal Statistical Society B 26, 211–252.
    1. Brage S, Brage N, Ekelund U, Luan J, Franks PW, Froberg K, and Wareham NJ (2006). Effect of combined movement and heart rate monitor placement on physical activity estimates during treadmill locomotion and free-living. European Journal of Applied Physiology 96, 517–524. - PubMed

Publication types

LinkOut - more resources