. 2020 Mar;34(3):4329-4347.
doi: 10.1096/fj.201902847R. Epub 2020 Jan 23.

Regulatory role of SphK1 in TLR7/9-dependent type I interferon response and autoimmunity

Affiliations

Regulatory role of SphK1 in TLR7/9-dependent type I interferon response and autoimmunity

Sabira Mohammed et al. FASEB J. 2020 Mar.

Abstract

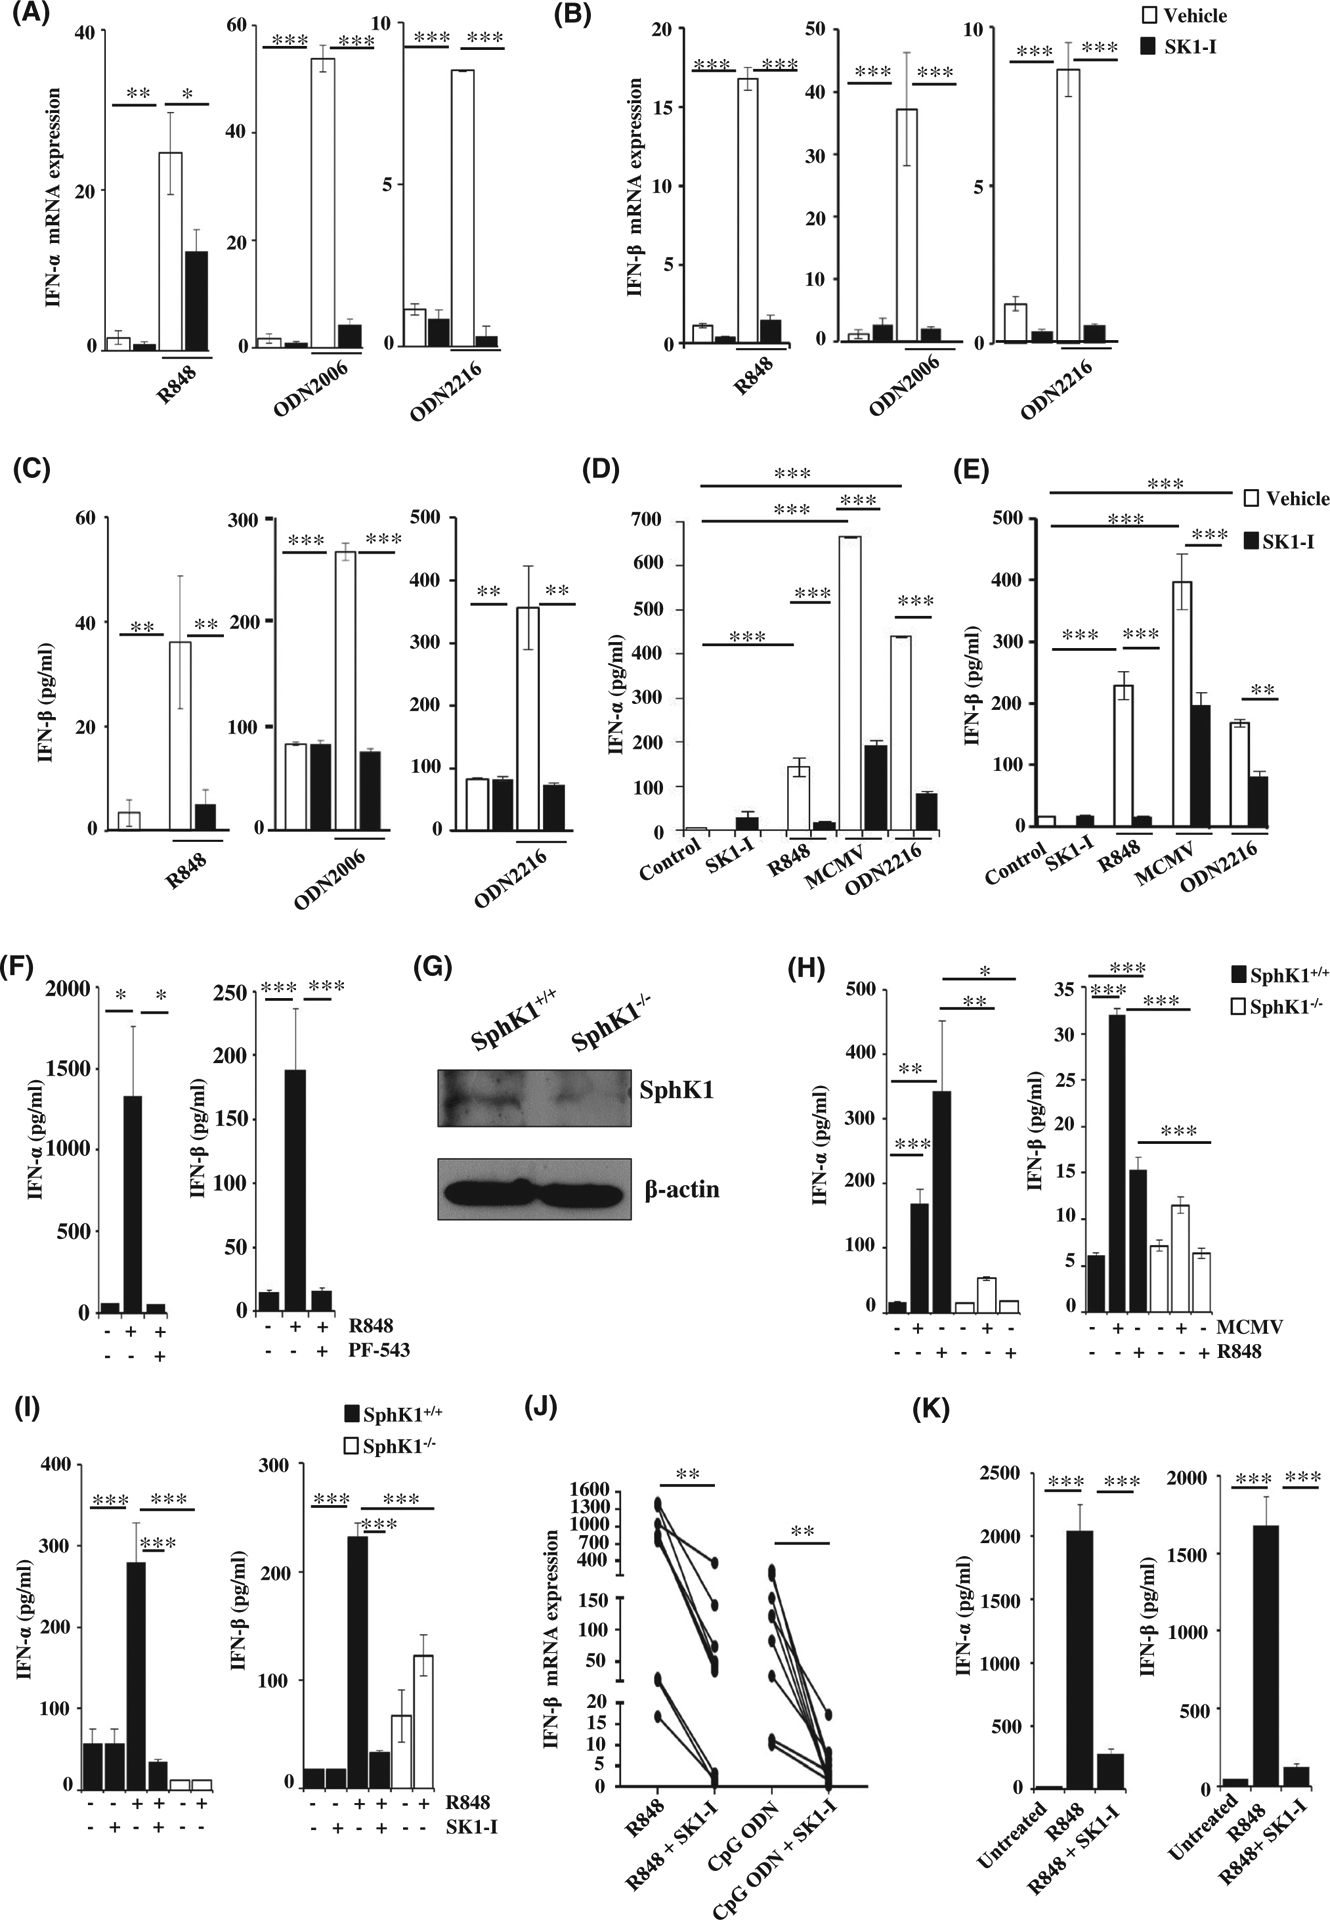
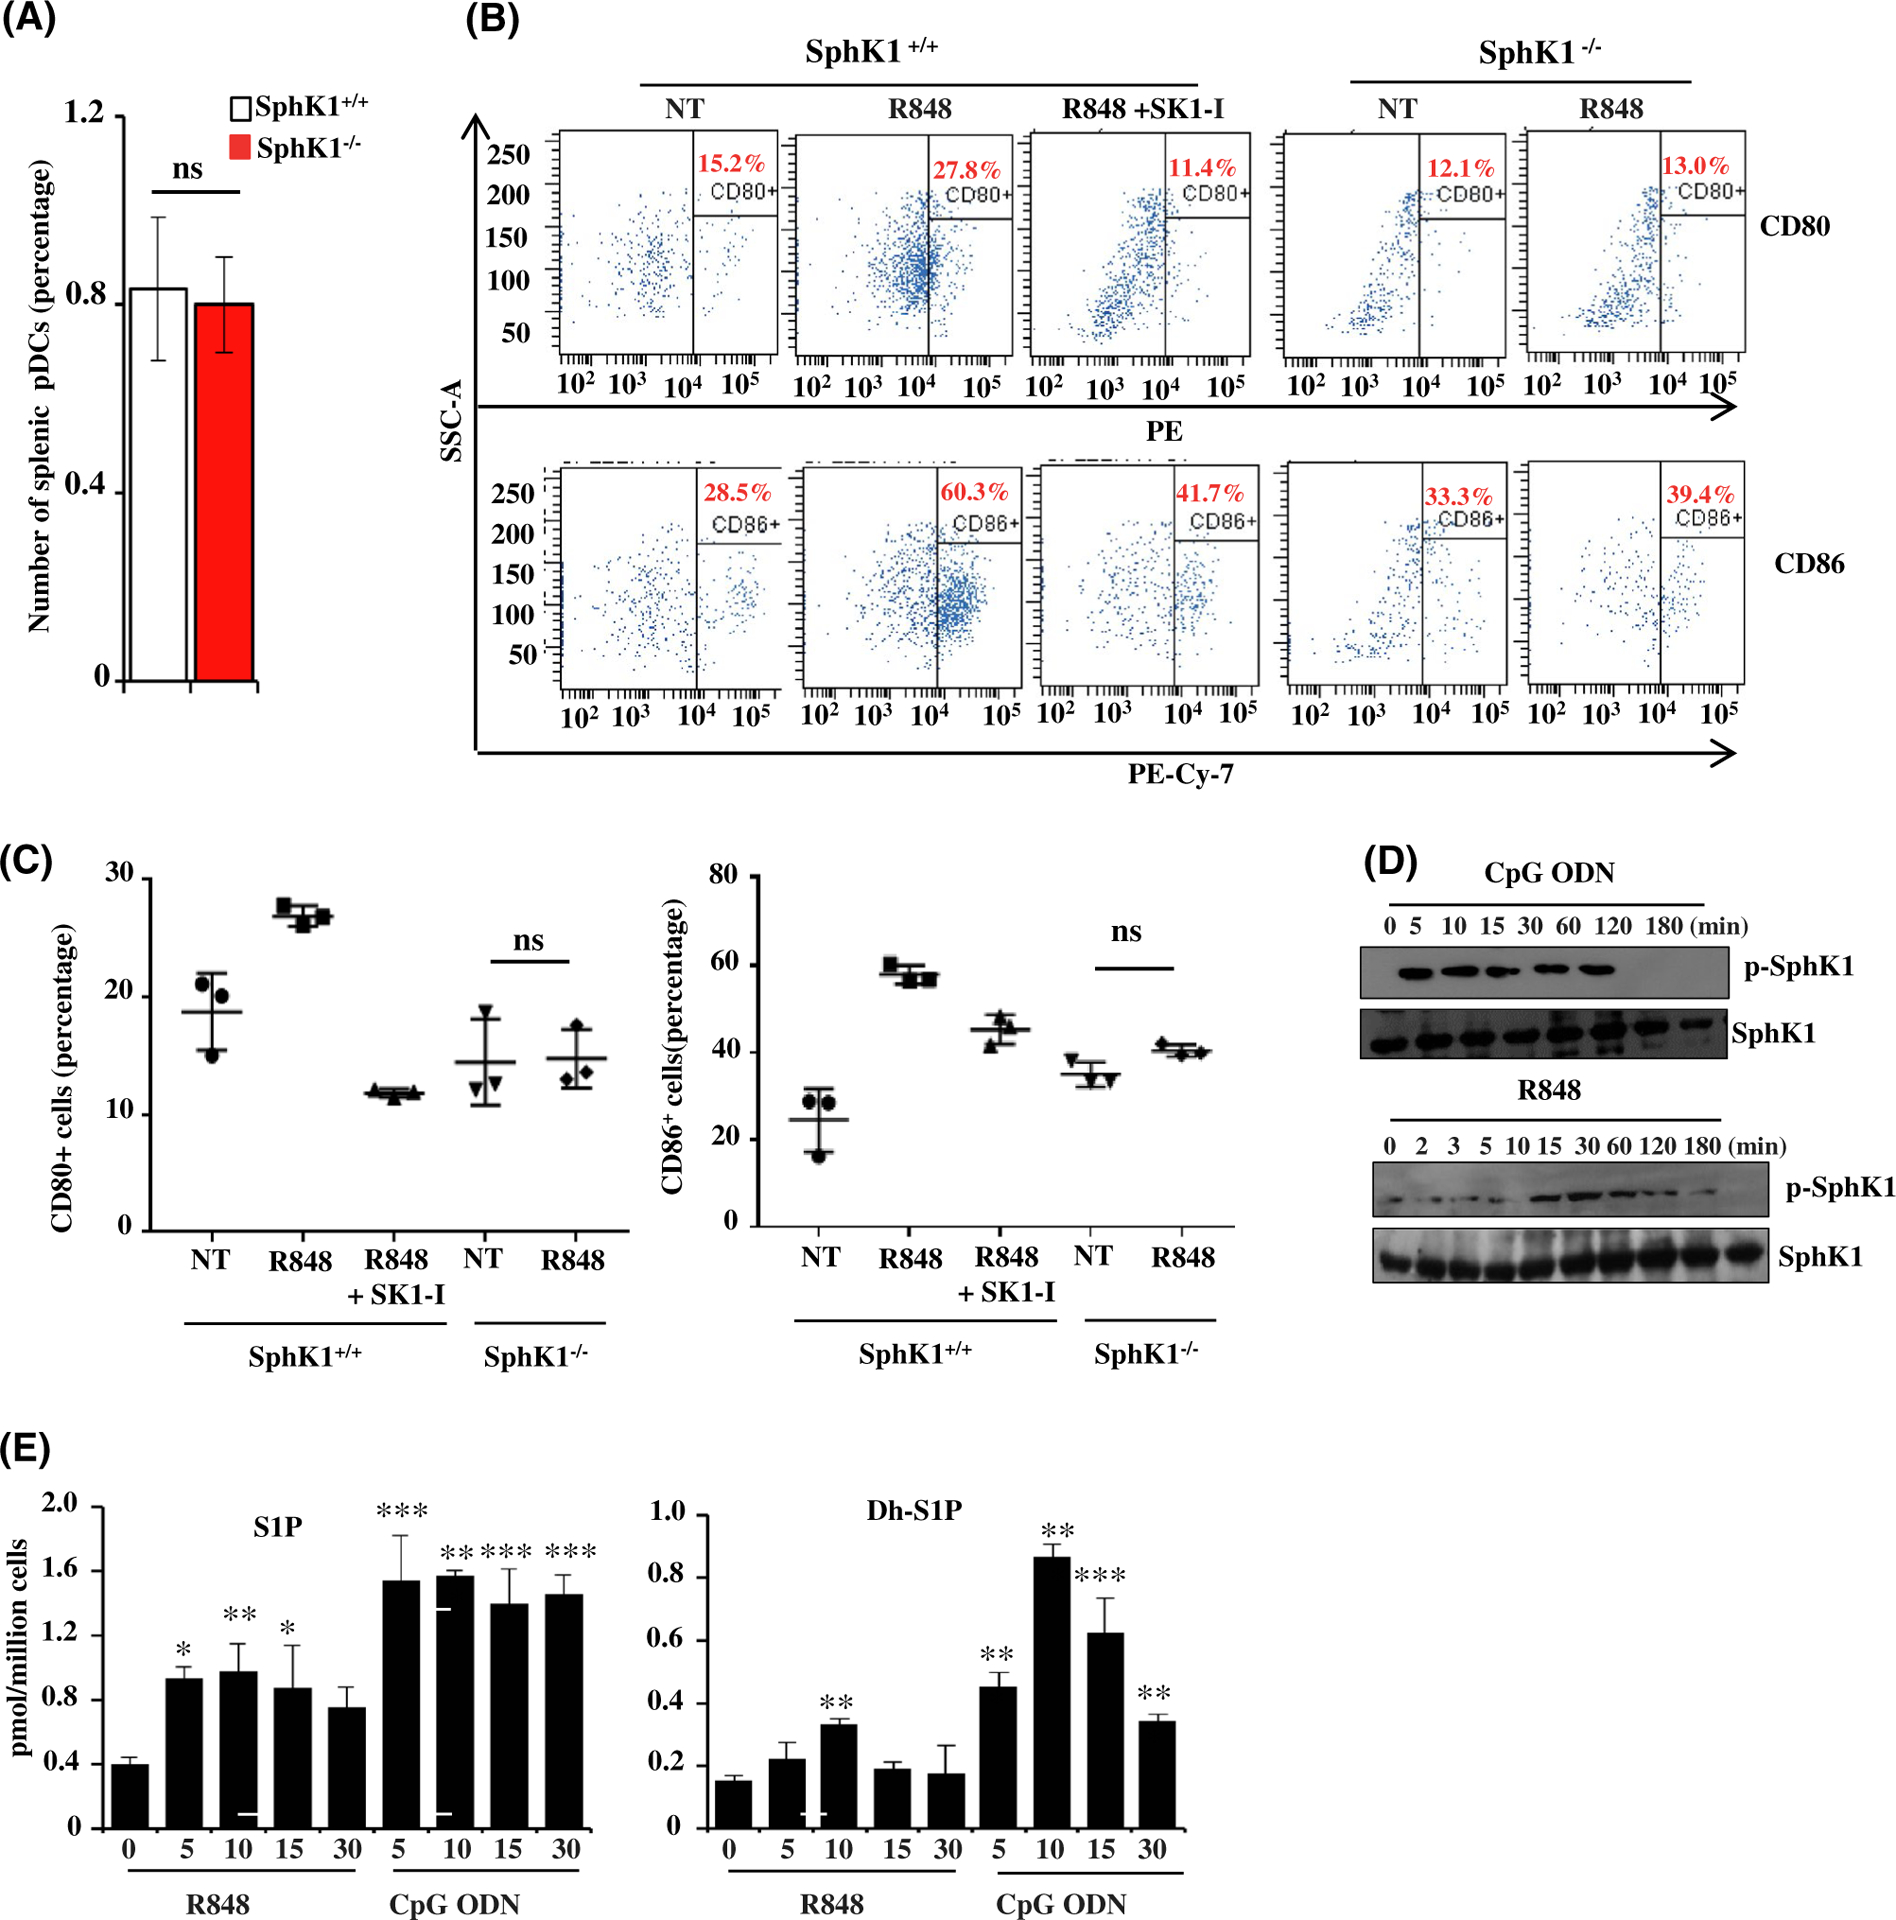
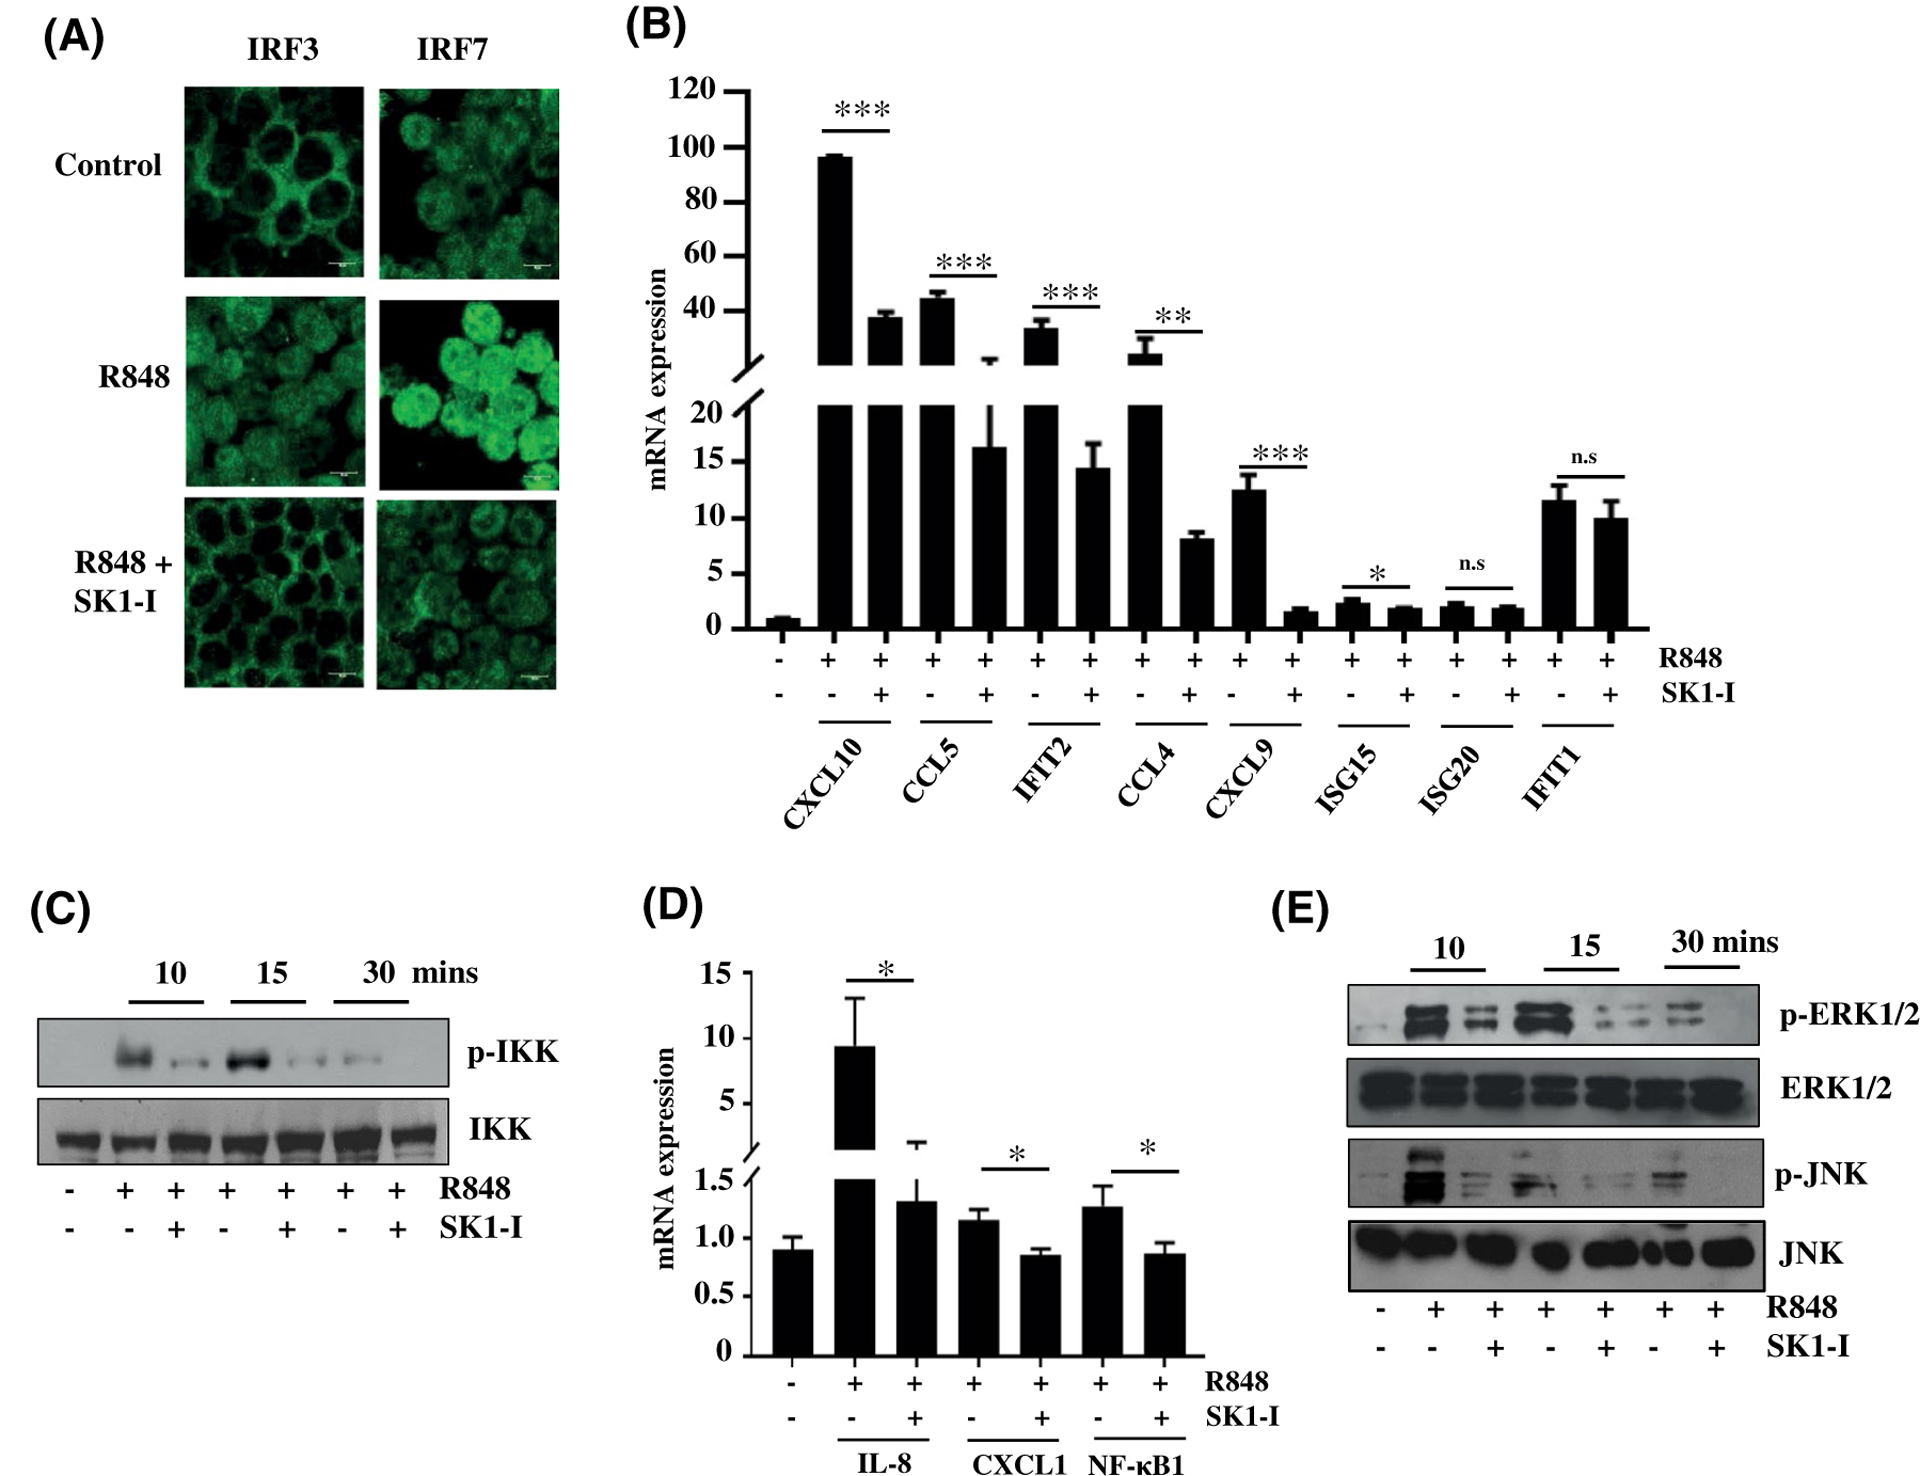
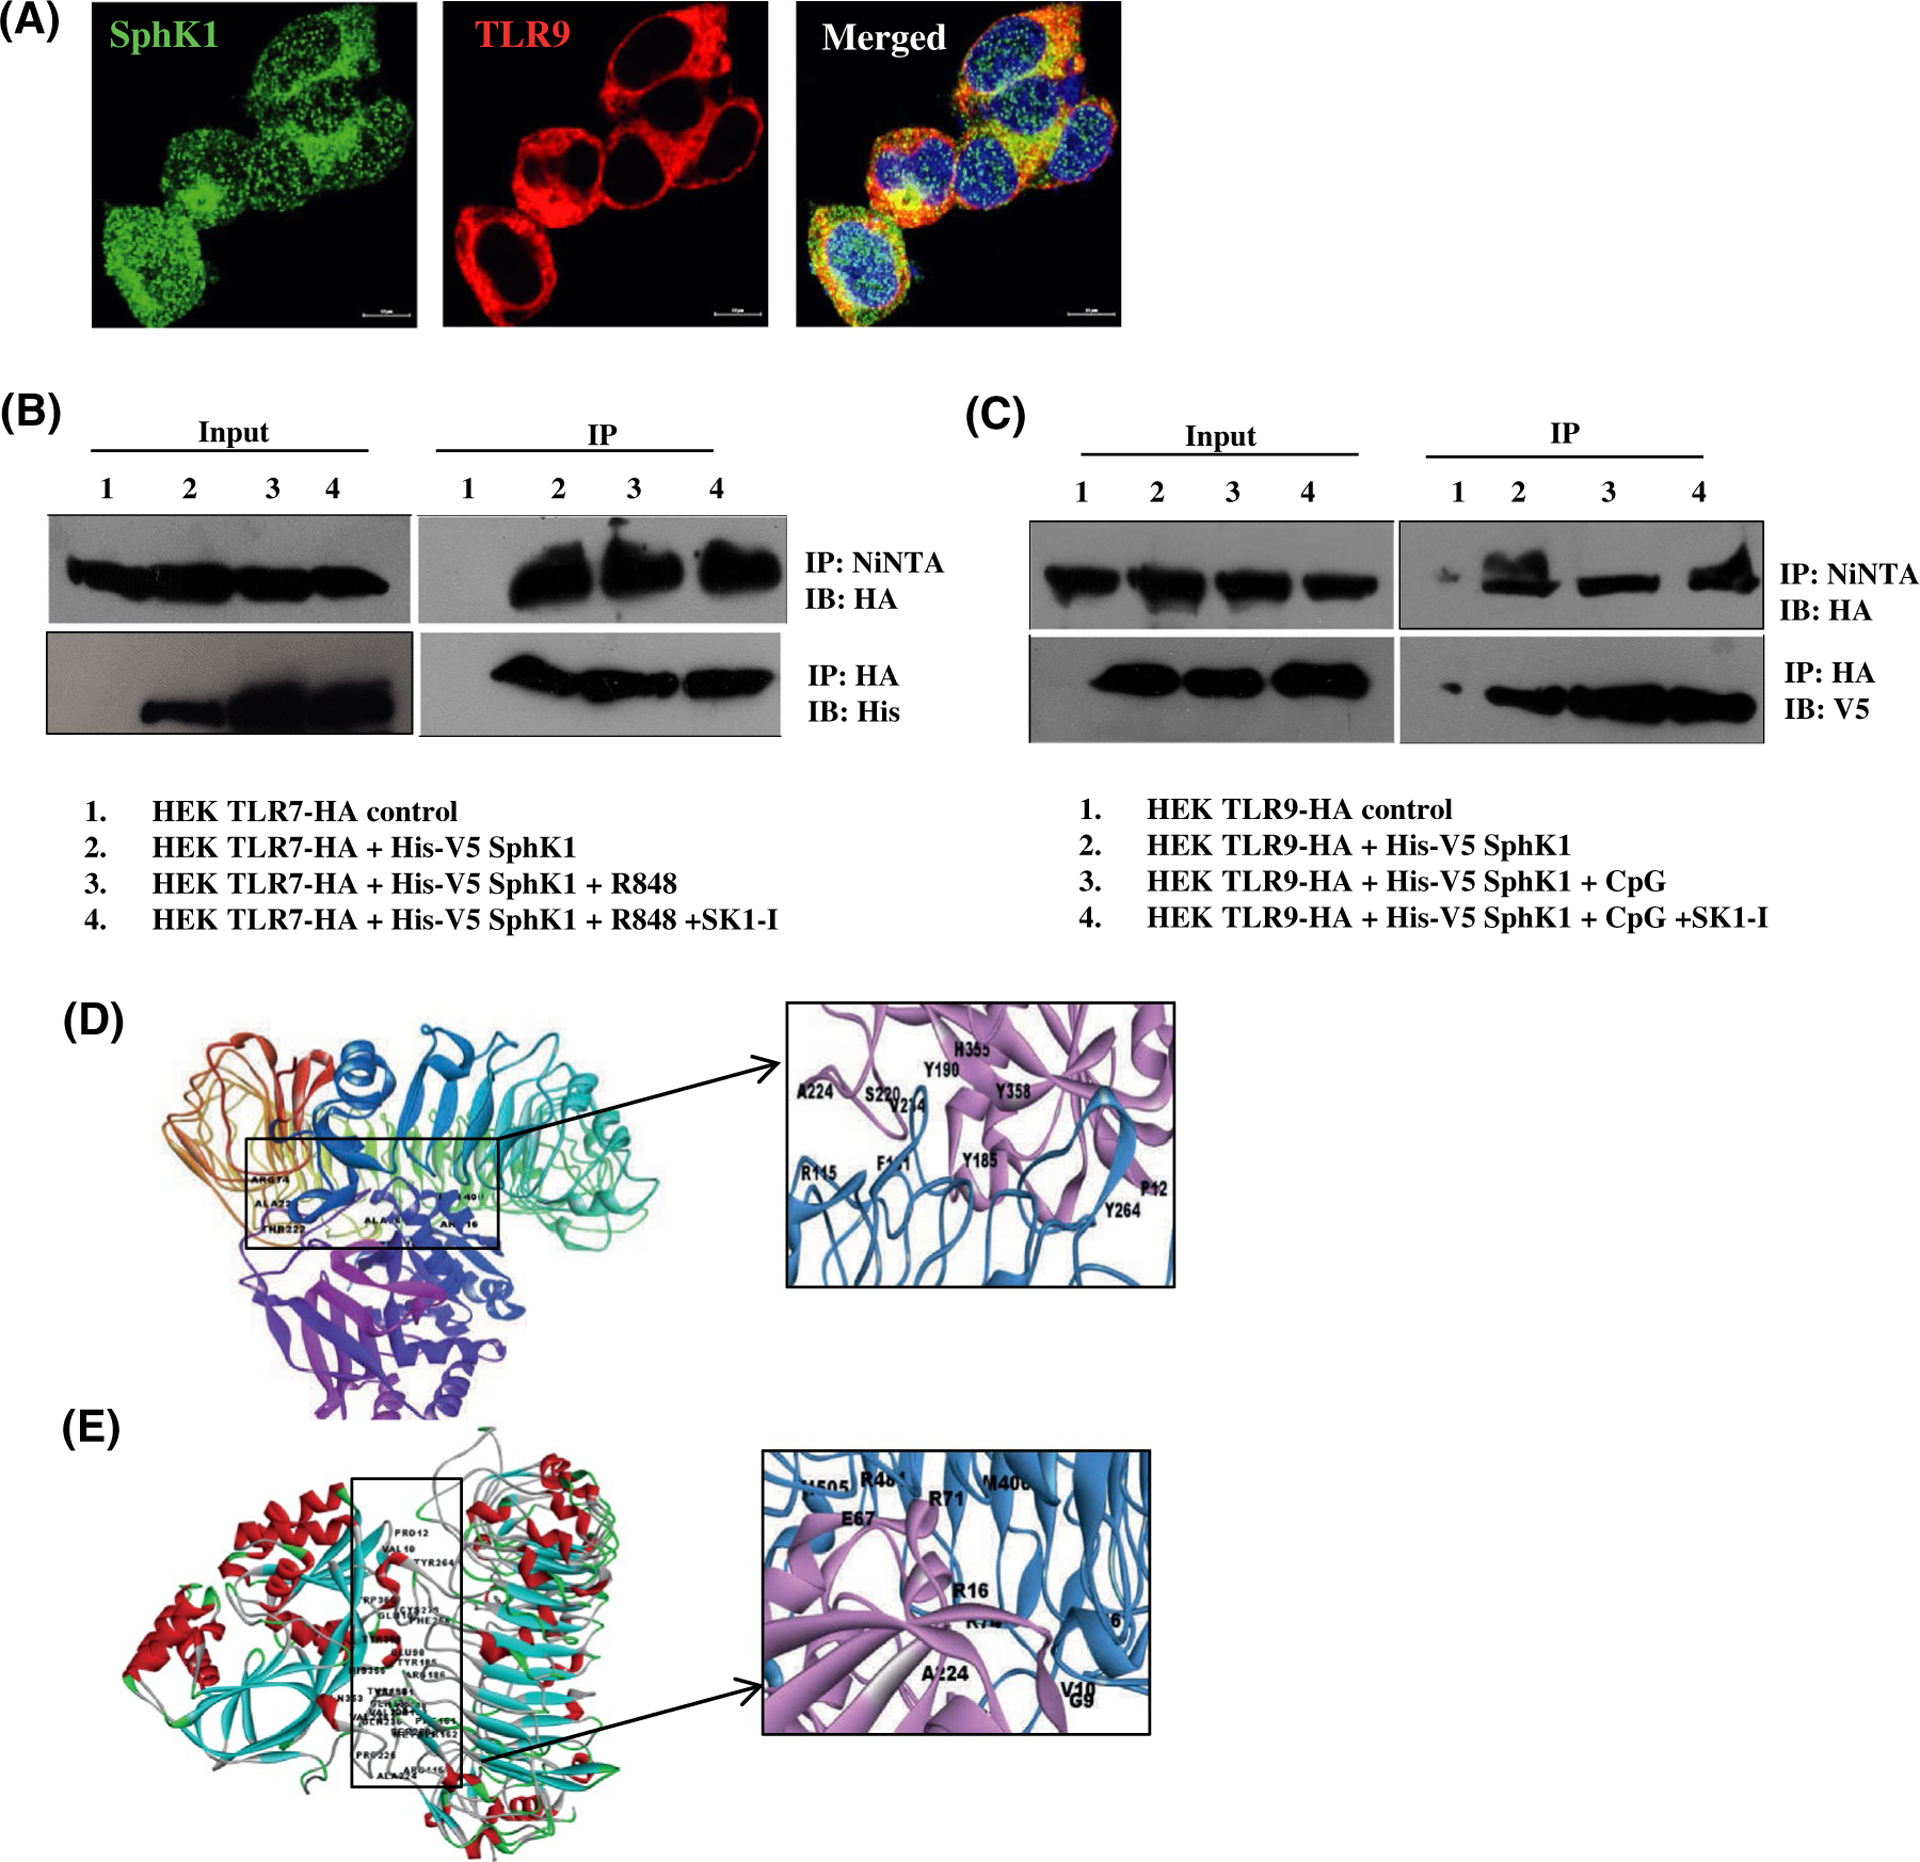
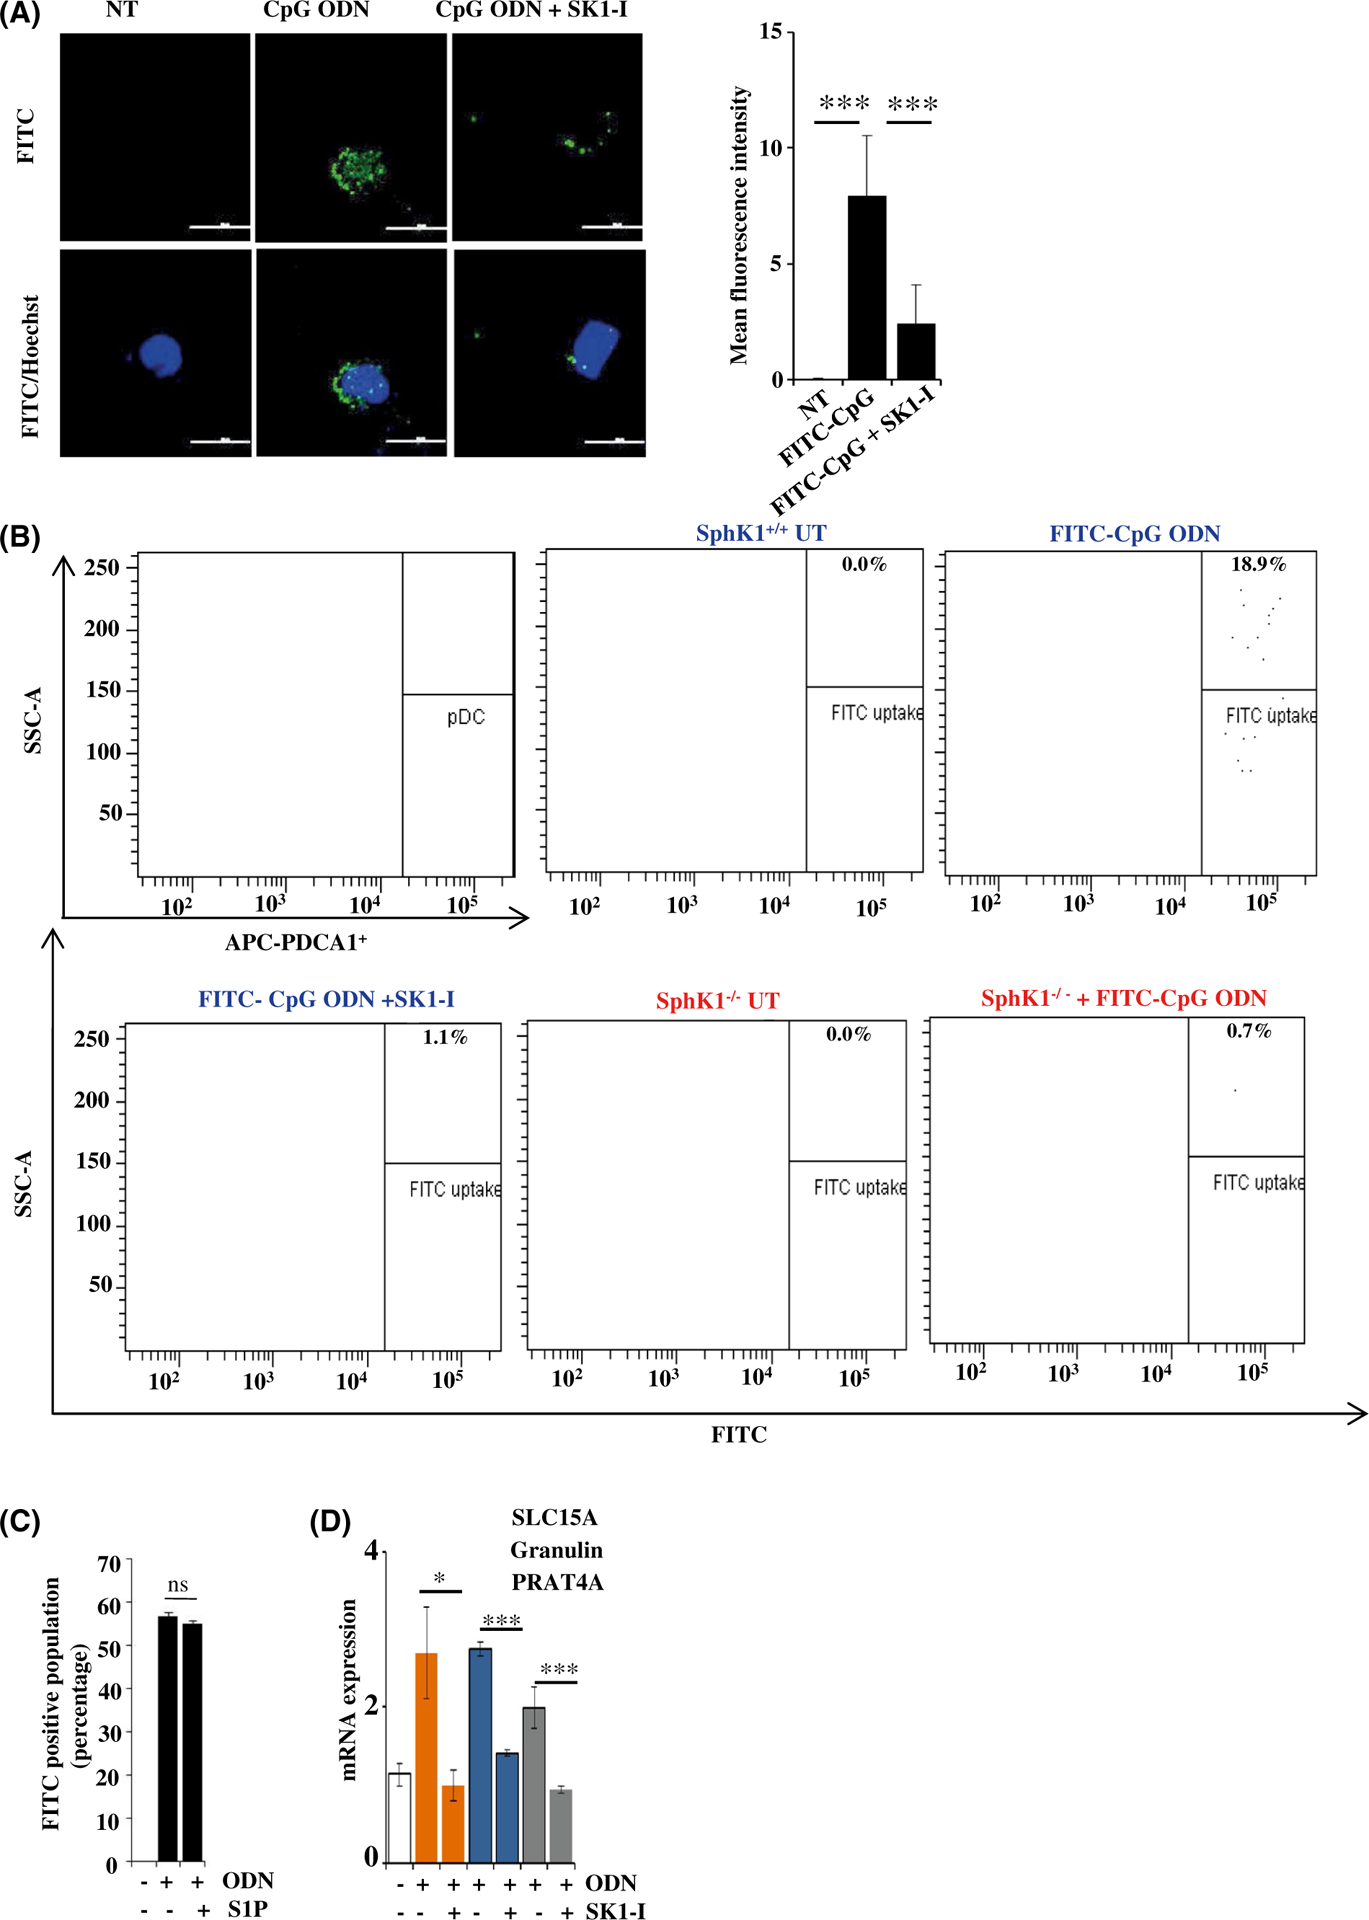
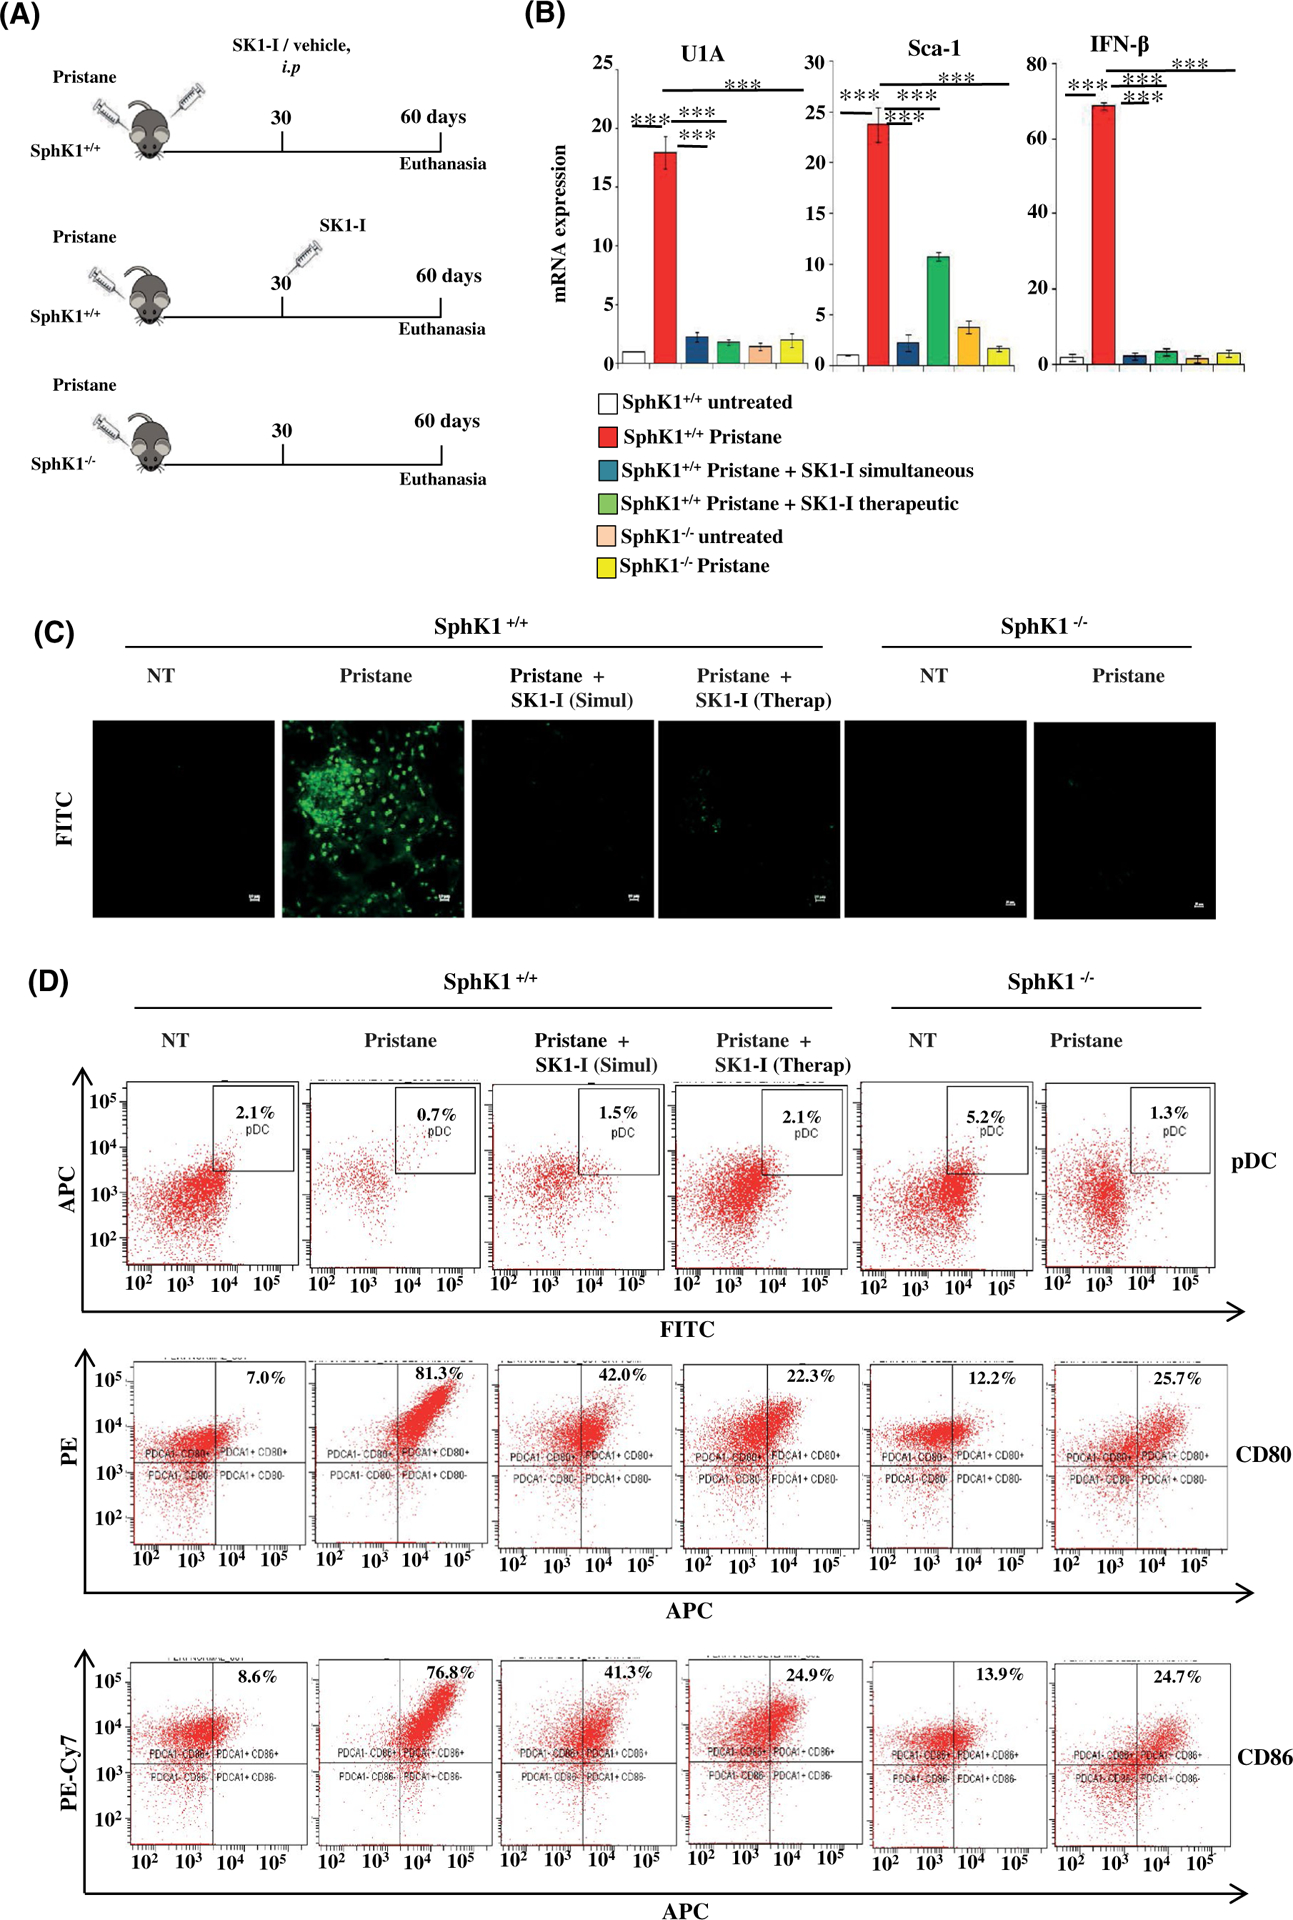
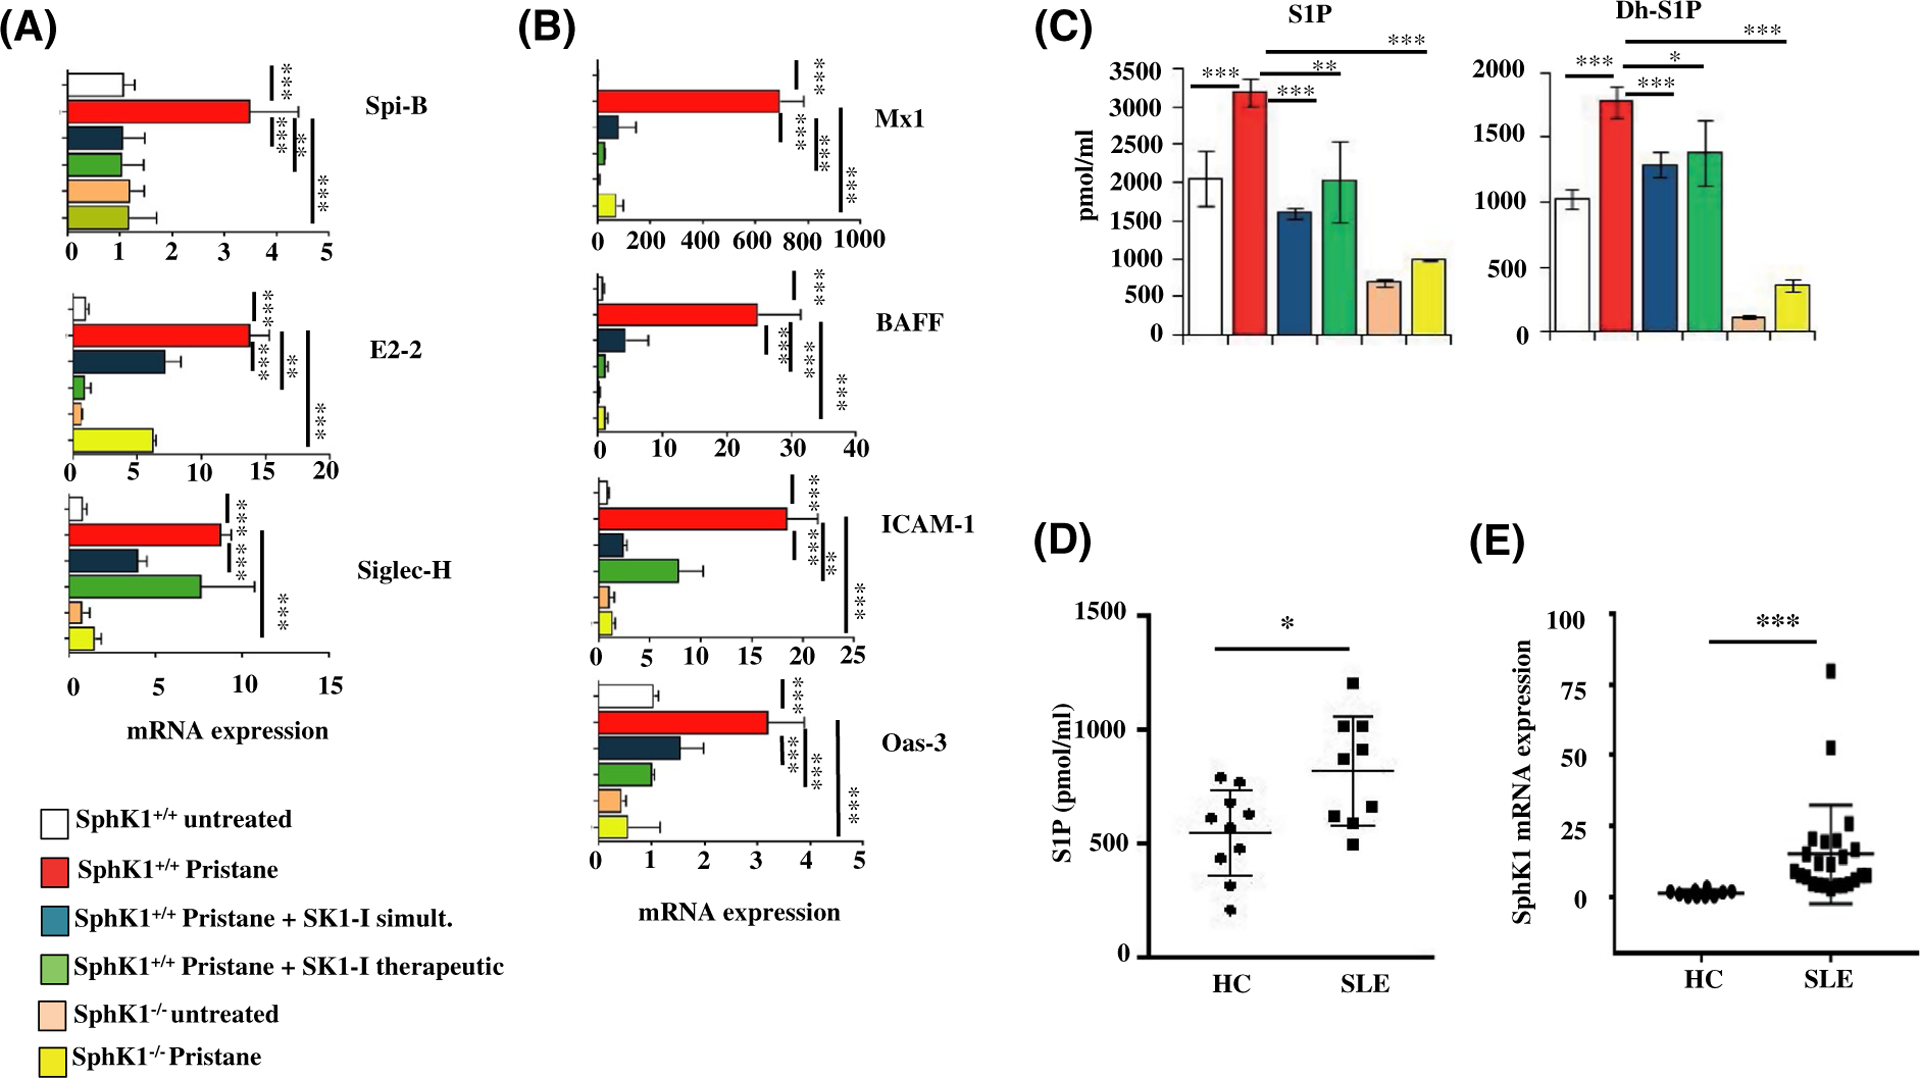
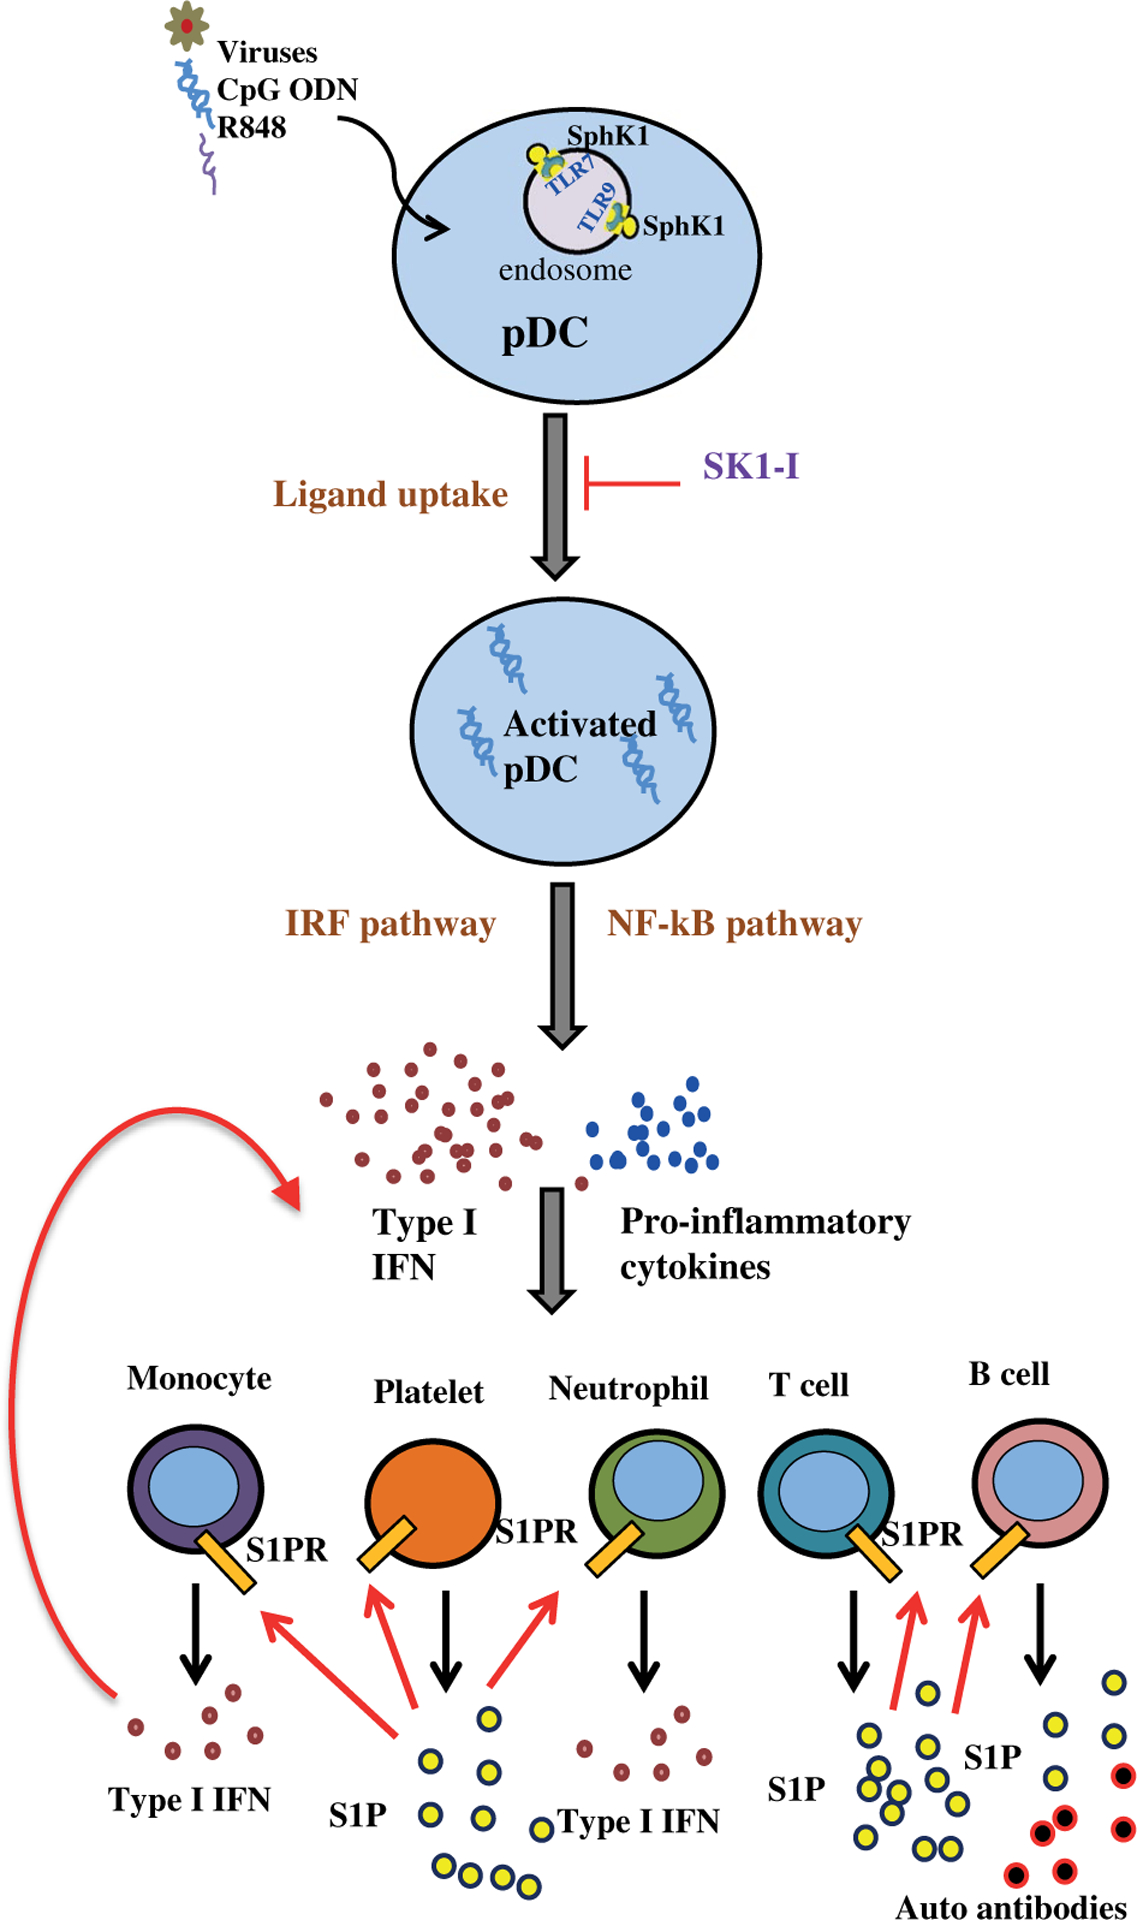
Plasmacytoid dendritic cells (pDCs) express Toll like receptors (TLRs) that modulate the immune response by production of type I interferons. Here, we report that sphingosine kinase 1 (SphK1) which produces the bioactive sphingolipid metabolite, sphingosine 1-phosphate (S1P), plays a critical role in the pDC functions and interferon production. Although dispensable for the pDC development, SphK1 is essential for the pDC activation and production of type I IFN and pro-inflammatory cytokines stimulated by TLR7/9 ligands. SphK1 interacts with TLRs and specific inhibition or deletion of SphK1 in pDCs mitigates uptake of CpG oligonucleotide ligands by TLR9 ligand. In the pristane-induced murine lupus model, pharmacological inhibition of SphK1 or its genetic deletion markedly decreased the IFN signature, pDC activation, and glomerulonephritis. Moreover, increases in the SphK1 expression and S1P levels were observed in human lupus patients. Taken together, our results indicate a pivotal regulatory role for the SphK1/S1P axis in maintaining the balance between immunosurveillance and immunopathology and suggest that specific SphK1 inhibitors might be a new therapeutic avenue for the treatment of type I IFN-linked autoimmune disorders.

Keywords: auto-immunity; interferon; plasmacytoid dendritic cells; sphingosine 1-Phosphate; sphingosine kinase; systemic lupus erythematosus.


Conflict of interest statement

CONFLICT OF INTEREST

Dr Spiegel is a co-inventor on patent number US 8,372,888 B2 titled Sphingosine kinase type 1 inhibitors, compositions, and processes for using same. The other authors declare no competing interests.

Figures

FIGURE 1
FIGURE 1
SphK1 is essential for TLR7/9-mediated type I interferon response. A-C, CAL-1 cells pre-treated with SK1-I (10 μM) or vehicle followed by stimulation with R848 (10 μg/mL), CpG-ODN 2006 (1 μM), CpG-ODN 2216 (3 μM) for 3 h (A, B) or 18 h (C) as indicated. IFN-α (A) and IFN-β mRNA (B) measured by qPCR and the mRNA levels normalized to β-actin. IFN-β easured by ELISA (C). Data are mean ± SD of three independent experiments. D-E, Flt3L-derived mouse pDCs pre-treated with SK1-I or vehicle and then stimulated with the indicated ligands. Levels of IFN-α (D) and IFN-β (E) measured by ELISA. Data are representative of four independent experiments. F, Flt3L-derived mouse pDCs treated with PF543 (10 μM), followed by R848 for 18 h. Levels of IFN-α and β in cell supernatant determined by ELISA. G, Expression of SphK1 determined in Flt3L-pDCs derived from SphK1+/+ and SphK1−/− mice by immunoblotting (H) Flt3L-derived mouse pDCs isolated from SphK1+/+ and SphK1−/− mice and treated with R848 (10 μg/mL) and MCMV (MOI = 1) and levels of IFN-α and IFN-β measured by ELISA. Data are mean ± S.D from four independent experiments. I, SphK1+/+ and SphK1−/− mice (n = 4/group) intraperitoneally injected with R848 (2 μg). One group of SphK1+/+ mice (n = 4) pre-treated with SK1-I (10 mg/kg) for 1 h before challenging with R848. IFN-α and IFN-β in serum measured by ELISA. J, PBMCs isolated from healthy human subjects (n = 10) stimulated with R848 (10 μg/mL) and CpG-ODN (1 μM) in the presence and absence of SK1-I IFN-β mRNA measured by qPCR and normalized to β-actin. K, Human pDCs isolated from peripheral blood of healthy human subjects treated with R848 either with or without SK1-I pretreatment. ELISA analyses of IFN-α and β in cell supernatants after 18 h of ligand treatment. Statistical significance was determined by ANOVA followed by post hoc Tukey test. (A-F, H, I, K), Wilcoxon paired t test (J). *P < .05, **P < .005, ***P < .001
FIGURE 2
FIGURE 2
Involvement of SphK1 in pDC activation. A, Numbers of splenic pDCs isolated from wild-type and SphK1−/− mice determined by flow cytometry. Data are mean ± SD of four independent experiments. B, Activation status (CD80-PE/CD86-PECy7) of splenic pDCs from SphK1+/+ and SphK1−/− mice determined by flow cytometry after TLR7 stimulation. Where indicated, cells were pretreated for 30 min with SK1-I prior to R848 treatment. C, Quantification of flow cytometry data in Figure 2B. D, CAL-1 cells treated with CpG-ODN (1 μM) or R848 (10 μg/mL) for the indicated times. Proteins separated by SDS-PAGE and immunoblotted with the indicated antibodies. Blots are representative of three independent experiments. E, CAL-1 cells treated with R848 (10 μg/mL) or CpG-ODN (1 μM) for the indicated times (in min) and the level of S1P and dihydro-S1P (DH-S1P) in the cell culture supernatant determined by LC-ESI-MS/MS. Statistical significance was determined by Student’s t test (A) or ANOVA followed by post hoc Tukey test (C, E). n.s—P > .05, *P < .05, **P < .005, ***P < .001
FIGURE 3
FIGURE 3
SphK1 regulates nuclear import of IRF3, IRF7, and NF-κB and downstream MAPK signaling. A-F, CAL-1 cells treated with R848 (10 μg/mL) in the presence or absence of SK1-I and (A) nuclear import of IRF3 and IRF7 was analyzed by immunofluorescence microscopy after staining with antibody against IRF3 and IRF7. Images are representative of five independent experiments. Scale bar: 10 μm. B, IRF3-dependent gene expression determined by qPCR. mRNA levels of the indicated genes after normalization to β-actin. Data are mean ± SD from three independent experiments. C, Proteins separated and immunoblotted with the indicated antibodies after treating the cells with TLR ligand for the indicated time points following SK1-I pretreatment. Similar results were obtained in two independent experiments. D, NF-κB-dependent gene expression was determined by qPCR. mRNA levels of the indicated genes normalized with β-actin. E, Proteins were separated and immunoblotted with the indicated antibodies after treating cells as in Figure 3C. Similar results were obtained in three independent experiments. Statistical significance for difference between two groups for each indicated gene was determined by Student’s t-test (B, D), *P < .05, **P < .005, ***P < .001
FIGURE 4
FIGURE 4
SphK1 interacts with TLR7 and TLR9. A, HEK293 cells stably expressing HA-TLR9 transiently transfected with His-V5-SphK1. Representative images of immunofluorescence microscopy after staining with antibodies against TLR9 and SphK1. Images are representative of three independent experiments. Scale bar: 10 μm (B, C) HEK293 cells stably expressing HA-TLR7 (B) or HA-TLR9 (C) transiently transfected with His-V5-SphK1 and treated with R848, CpG-ODN or SK1-I as indicated. SphK1, TLR7, and TLR9 pulled down with Ni-NTA or HA affinity purification beads, separated by SDS-PAGE, and immunoblotted as indicated. Input exposed differently (D-E) Docked complexes of TLR9 and SphK1 (D) and TLR7 and SphK1 (E) obtained from ZDOCK server. The H-bond forming residues are marked in the inset (TLR9, TLR7- blue, SphK1- pink)
FIGURE 5
FIGURE 5
SphK1 regulates uptake of CpG-ODN by dendritic cells. A, CAL-1 cells pretreated with SK1-I (10 μM) for 30 min followed by stimulation without or with FITC-CpG-ODN (50 nM) for 20 min. CpG uptake was analyzed by immunofluorescence microscopy. Nuclei counter stained with Hoechst 33342.Images representative of five independent experiments. Scale bar: 20 μm. Graphical representation of FITC-CpG ODN uptake by Image J software. B, Splenocytes isolated from SphK1+/+ and SphK1−/−mice (n = 4/group) and gated for splenic pDCs by staining with APC-PDCA1. Cells were treated as in Figure 5A. CpG uptake by splenic pDCs was analyzed by flow cytometry as indicated by FITC fluorescence. C, Uptake of FITC-CpG-ODN analyzed by flow cytometry and data expressed as percentage of FITC-positive cells. Data are mean ± SD from three independent experiments. D, CAL-1 cells were treated with CpG-ODN as in Figure 1A. mRNA levels of SLC15A, Granulin, PRAT4A determined by qPCR and normalized to β-actin. Data are mean ± SD of five independent experiments. Statistical significance was determined by Student’s t test to compare between two experimental groups (D) and ANOVA (A,C), post hoc Tukey test, *P < .05, **P < .005, ***P < .001
FIGURE 6
FIGURE 6
Inhibition or deletion of SphK1 reduces disease parameters in pDC-dependent murine SLE. A, Schematic experimental diagram for pristane-induced SLE model. Wild-type or SphK1−/− mice were injected with pristane (500 μL/mouse, intraperitoneal). Where indicated, mice were treated with SK1-I (10 mg/kg, i.p) twice a week starting at day 0 (simultaneous) or after 30 days (therapeutic). Mice were euthanized after 60 days (n = 5/group). B, mRNA levels of the indicated genes in blood samples from mice were measured by qPCR and normalized with GAPDH. Data are mean ± SD (n = 5/group). C, Immunofluorescence microscopy of mouse kidney cryosections stained with FITC-labeled anti-IgG antibody to analyze glomerulonephritis. Representative images from three independent experiments. Scale bar: 10 μm. D, Peritoneal cells isolated from the indicated mice groups, pDC percentage (FITC-CD11C+/APC-PDCA-1+) and activation status (PE-CD80, PE-Cy7-CD86) determined by flow cytometric analysis. Statistical significance determined by ANOVA with post hoc Tukey test, *P < .05, **P < .005, ***P < .001
FIGURE 7
FIGURE 7
Inhibition or deletion of SphK1 mitigates IFN gene signature in a mouse model of lupus, and SphK1 is elevated in human lupus patients. A-D, Mice were treated as described in Figure 6A. A, mRNA levels of Spi-B, E2–2, and Siglec-H in blood determined by qPCR and normalized to GAPDH. Data are mean ± SD of three independent experiments. B, mRNA levels of genes induced by interferon in blood determined by qPCR and normalized to GAPDH. Data are mean ± SD of three independent experiments. C, Levels of S1P and dihydro-S1P in serum of experimental mice measured by LC-ESI-MS/MS. D, Levels of S1P in serum from healthy human controls (HC) (n = 10) and lupus patients (SLE) (n = 9) determined by LC-ESI-MS/MS. E, PBMCs isolated from healthy controls (n = 10) and lupus patients (n = 22). SphK1 mRNA levels were determined by qPCR and normalized to β-actin. Whisker plots show mean ± SD Statistical significance determined by ANOVA, post hoc Tukey test (A-C), Student’s t test (D) or Welch’s t test (E).*P < .05, **P < .005, ***P < .001
FIGURE 8
FIGURE 8
A model illustrating the role of SphK1 in type I interferon-dependent innate and autoimmune activation. In systemic lupus erythematosus, activation of pDCs by TLR7/9 ligands leads to massive IFN production and also activation of sphingosine kinase 1. Intracellular SphK1 is important for efficient uptake of TLR7/9 ligands and trafficking to endosomes. pDCs are involved in the initial stages of the lupus and as disease advances, IFN and production of pro-inflammatory cytokines and chemokines lead to further recruitment and activation of other immune cells, such as monocytes, neutrophills, T and B cells, as well as platelets. These cells secrete S1P into the circulation, which further amplifies their immune functions by binding to its receptors on these cells but not on pDCs. Thus, our work suggests that SphK1 is at the crossroads of immunosurveillance and immuno pathology and upregulation of the SphK1/S1P axis results in a state of autoimmunity with an exacerbated production of interferon

References

    1. Swiecki M, Colonna M. The multifaceted biology of plasmacytoid dendritic cells. Nat Rev Immunol. 2015;15:471–485. - PMC - PubMed
    1. Alculumbre S, Raieli S, Hoffmann C, Chelbi R, Danlos FX, Soumelis V. Plasmacytoid pre-dendritic cells (pDC): from molecular pathways to function and disease association. Semin Cell Dev Biol. 2019;86:24–35. - PubMed
    1. Siegal FP, Kadowaki N, Shodell M, et al. The nature of the principal type 1 interferon-producing cells in human blood. Science. 1999;284:1835–1837. - PubMed
    1. Asselin-Paturel C, Boonstra A, Dalod M, et al. Mouse type I IFN-producing cells are immature APCs with plasmacytoid morphology. Nat Immunol. 2001;2:1144–1150. - PubMed
    1. Kawai T, Akira S. Toll-like receptors and their crosstalk with other innate receptors in infection and immunity. Immunity. 2011;34:637–650. - PubMed

Publication types

MeSH terms

LinkOut - more resources