Low Flow Voltage Free Interface for Capillary Electrophoresis and Mass Spectrometry Driven by Vibrating Sharp-Edge Spray Ionization
- PMID: 31971372
- PMCID: PMC7295075
- DOI: 10.1021/acs.analchem.9b03994
Low Flow Voltage Free Interface for Capillary Electrophoresis and Mass Spectrometry Driven by Vibrating Sharp-Edge Spray Ionization
Abstract
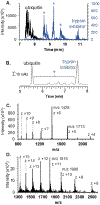
Capillary electrophoresis-mass spectrometry is a powerful technique for high-throughput and high efficiency separations combined with structural identification. Electrospray ionization is the primary interface used to couple capillary electrophoresis to mass analyzers; however, improved designs continue to be reported. A new interfacing method based on vibrating sharp-edge spray ionization is presented in this work to overcome the challenges of decoupling applied voltages and to enhance the compatibility with separations performed at near-neutral pH. The versatility and ease of use of this ionization source is demonstrated using β-blockers, peptides, and proteins. The cationic β-blocker pindolol was injected electrokinetically, and detected at concentrations ranging from 10 nM to 5 μM, with an estimated detection limit of 2 nM. The vibrating sharp-edge spray ionization functions with flow rates from 70 to 200 nL/min and did not perturb the capillary electrophoresis separation electroosmotic flow as evidenced by the observation that most migration times differed less than 7% (n = 3) across a lab-built system interfaced to mass spectrometry and a commercial system that utilizes absorbance detection. For cationic beta-blockers the theoretical plates achieved in the capillary electrophoresis-mass spectrometry setup were 80%-95% of that observed with a commercial capillary electrophoresis-UV absorbance detection system.
Figures


Similar articles
-
Nanoflow Sheath Voltage-Free Interfacing of Capillary Electrophoresis and Mass Spectrometry for the Detection of Small Molecules.Anal Chem. 2022 Aug 16;94(32):11329-11336. doi: 10.1021/acs.analchem.2c02074. Epub 2022 Aug 1. Anal Chem. 2022. PMID: 35913997 Free PMC article.
-
Protein analysis using capillary electrophoresis coupled to mass spectrometry through vibrating sharp-edge spray ionization.Electrophoresis. 2024 Sep;45(17-18):1597-1605. doi: 10.1002/elps.202300298. Epub 2024 Apr 5. Electrophoresis. 2024. PMID: 38577828 Free PMC article.
-
A Small Footprint and Robust Interface for Solid Phase Microextraction and Mass Spectrometry Based on Vibrating Sharp-Edge Spray Ionization.J Am Soc Mass Spectrom. 2022 Feb 2;33(2):304-314. doi: 10.1021/jasms.1c00305. Epub 2022 Jan 18. J Am Soc Mass Spectrom. 2022. PMID: 35040644 Free PMC article.
-
On-line analysis by capillary separations interfaced to an ion trap storage/reflectron time-of-flight mass spectrometer.J Chromatogr A. 1998 Jan 23;794(1-2):377-89. doi: 10.1016/s0021-9673(97)00934-5. J Chromatogr A. 1998. PMID: 9491563 Review.
-
Capillary electrophoresis-electrospray ionization-mass spectrometry interfaces: fundamental concepts and technical developments.J Chromatogr A. 2012 Dec 7;1267:17-31. doi: 10.1016/j.chroma.2012.07.019. Epub 2012 Jul 16. J Chromatogr A. 2012. PMID: 22846629 Review.
Cited by
-
Nanoflow Sheath Voltage-Free Interfacing of Capillary Electrophoresis and Mass Spectrometry for the Detection of Small Molecules.Anal Chem. 2022 Aug 16;94(32):11329-11336. doi: 10.1021/acs.analchem.2c02074. Epub 2022 Aug 1. Anal Chem. 2022. PMID: 35913997 Free PMC article.
-
[Annual review of capillary electrophoresis technology in 2020].Se Pu. 2021 Jun;39(6):559-566. doi: 10.3724/SP.J.1123.2021.03024. Se Pu. 2021. PMID: 34227316 Free PMC article. Chinese.
-
Recent advances (2019-2021) of capillary electrophoresis-mass spectrometry for multilevel proteomics.Mass Spectrom Rev. 2023 Mar;42(2):617-642. doi: 10.1002/mas.21714. Epub 2021 Jun 15. Mass Spectrom Rev. 2023. PMID: 34128246 Free PMC article. Review.
-
Protein analysis using capillary electrophoresis coupled to mass spectrometry through vibrating sharp-edge spray ionization.Electrophoresis. 2024 Sep;45(17-18):1597-1605. doi: 10.1002/elps.202300298. Epub 2024 Apr 5. Electrophoresis. 2024. PMID: 38577828 Free PMC article.
-
Comparative study of the vibrating capillary nebulizer (VCN) and commercially available interfaces for on-line coupling of capillary electrophoresis with ICP-MS.Anal Bioanal Chem. 2024 Mar;416(7):1613-1621. doi: 10.1007/s00216-024-05162-7. Epub 2024 Jan 29. Anal Bioanal Chem. 2024. PMID: 38285228
References
-
- Stolz A; Jooß K; Höcker O; Römer J; Schlecht J; Neusüß C Electrophoresis 2019, 40, 79–112. - PubMed
Publication types
MeSH terms
Substances
Grants and funding
LinkOut - more resources
Full Text Sources
Other Literature Sources
Miscellaneous

