

High-Fidelity Single Molecule Quantification in a Flow Cytometer Using Multiparametric Optical Analysis
- PMID: 31971776
- PMCID: PMC7295608
- DOI: 10.1021/acsnano.9b09498
High-Fidelity Single Molecule Quantification in a Flow Cytometer Using Multiparametric Optical Analysis
Abstract
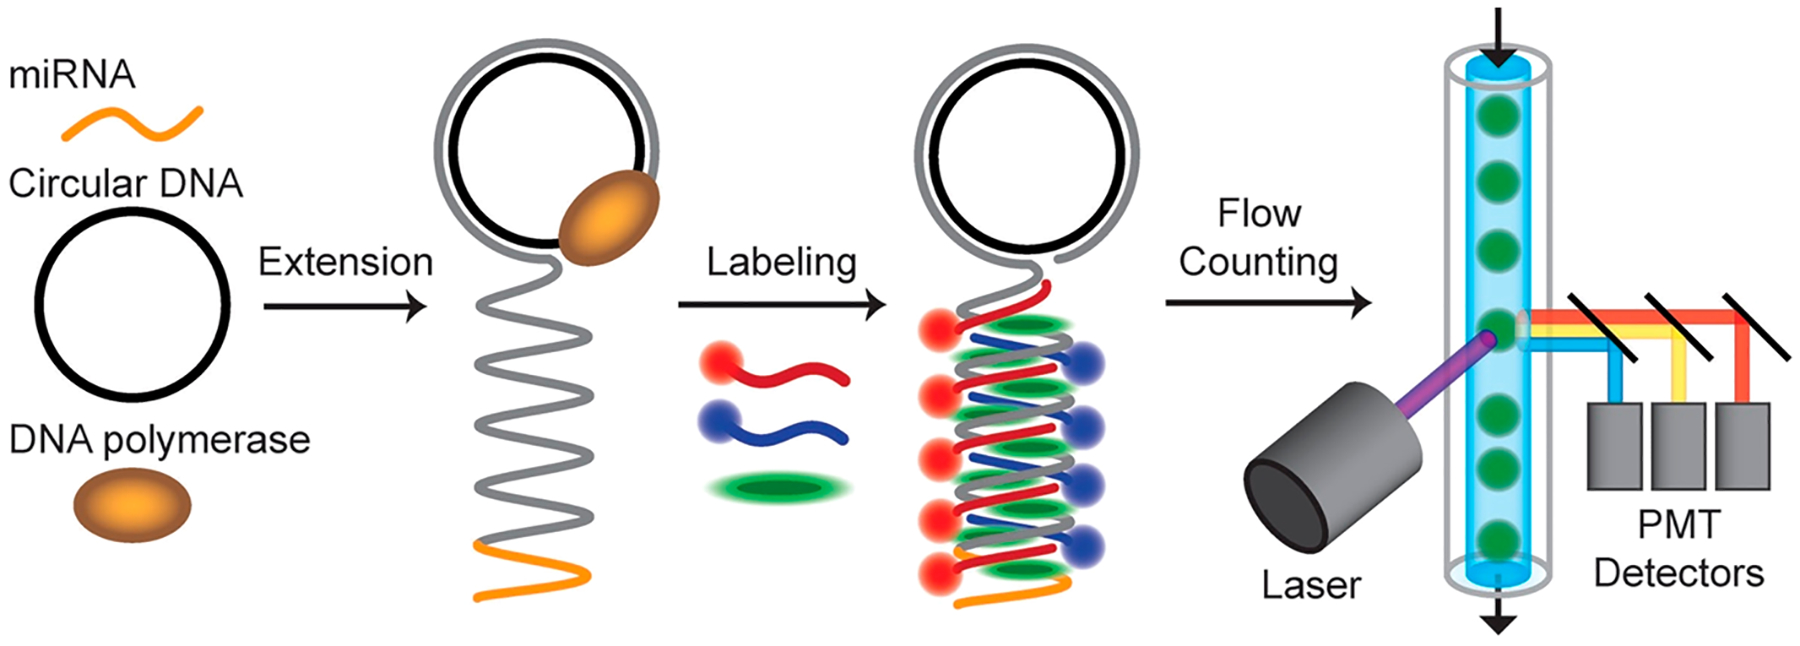
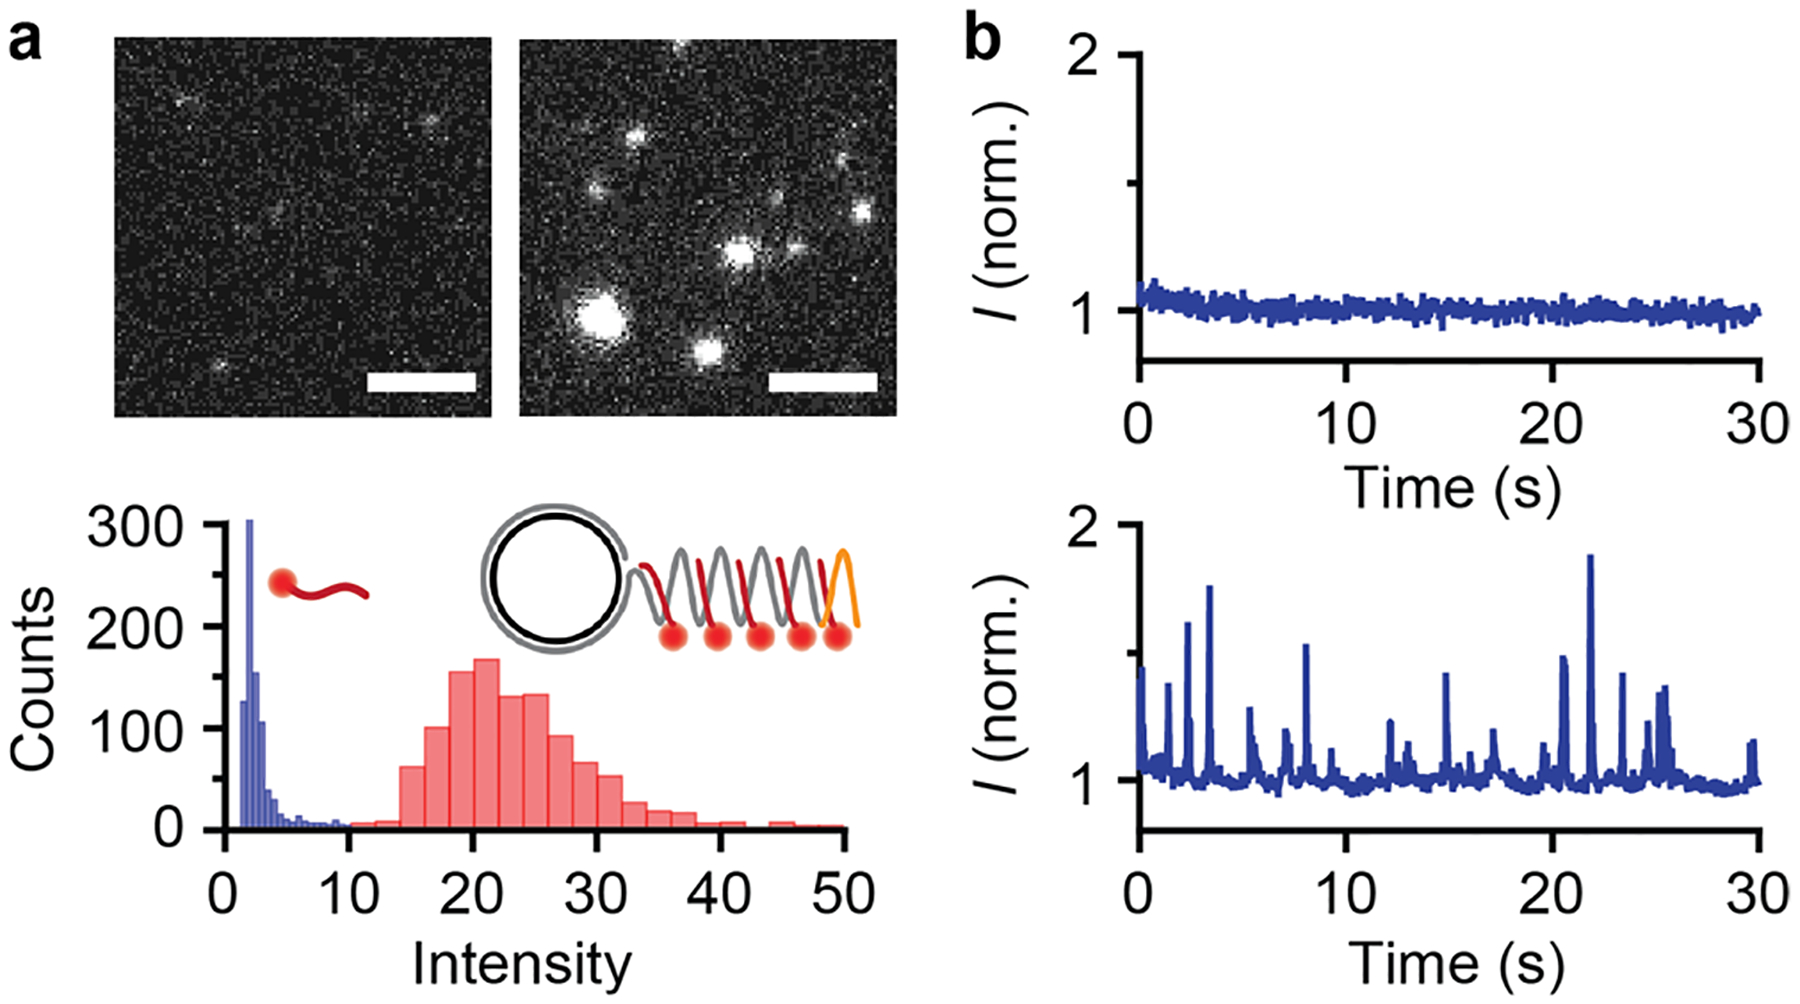
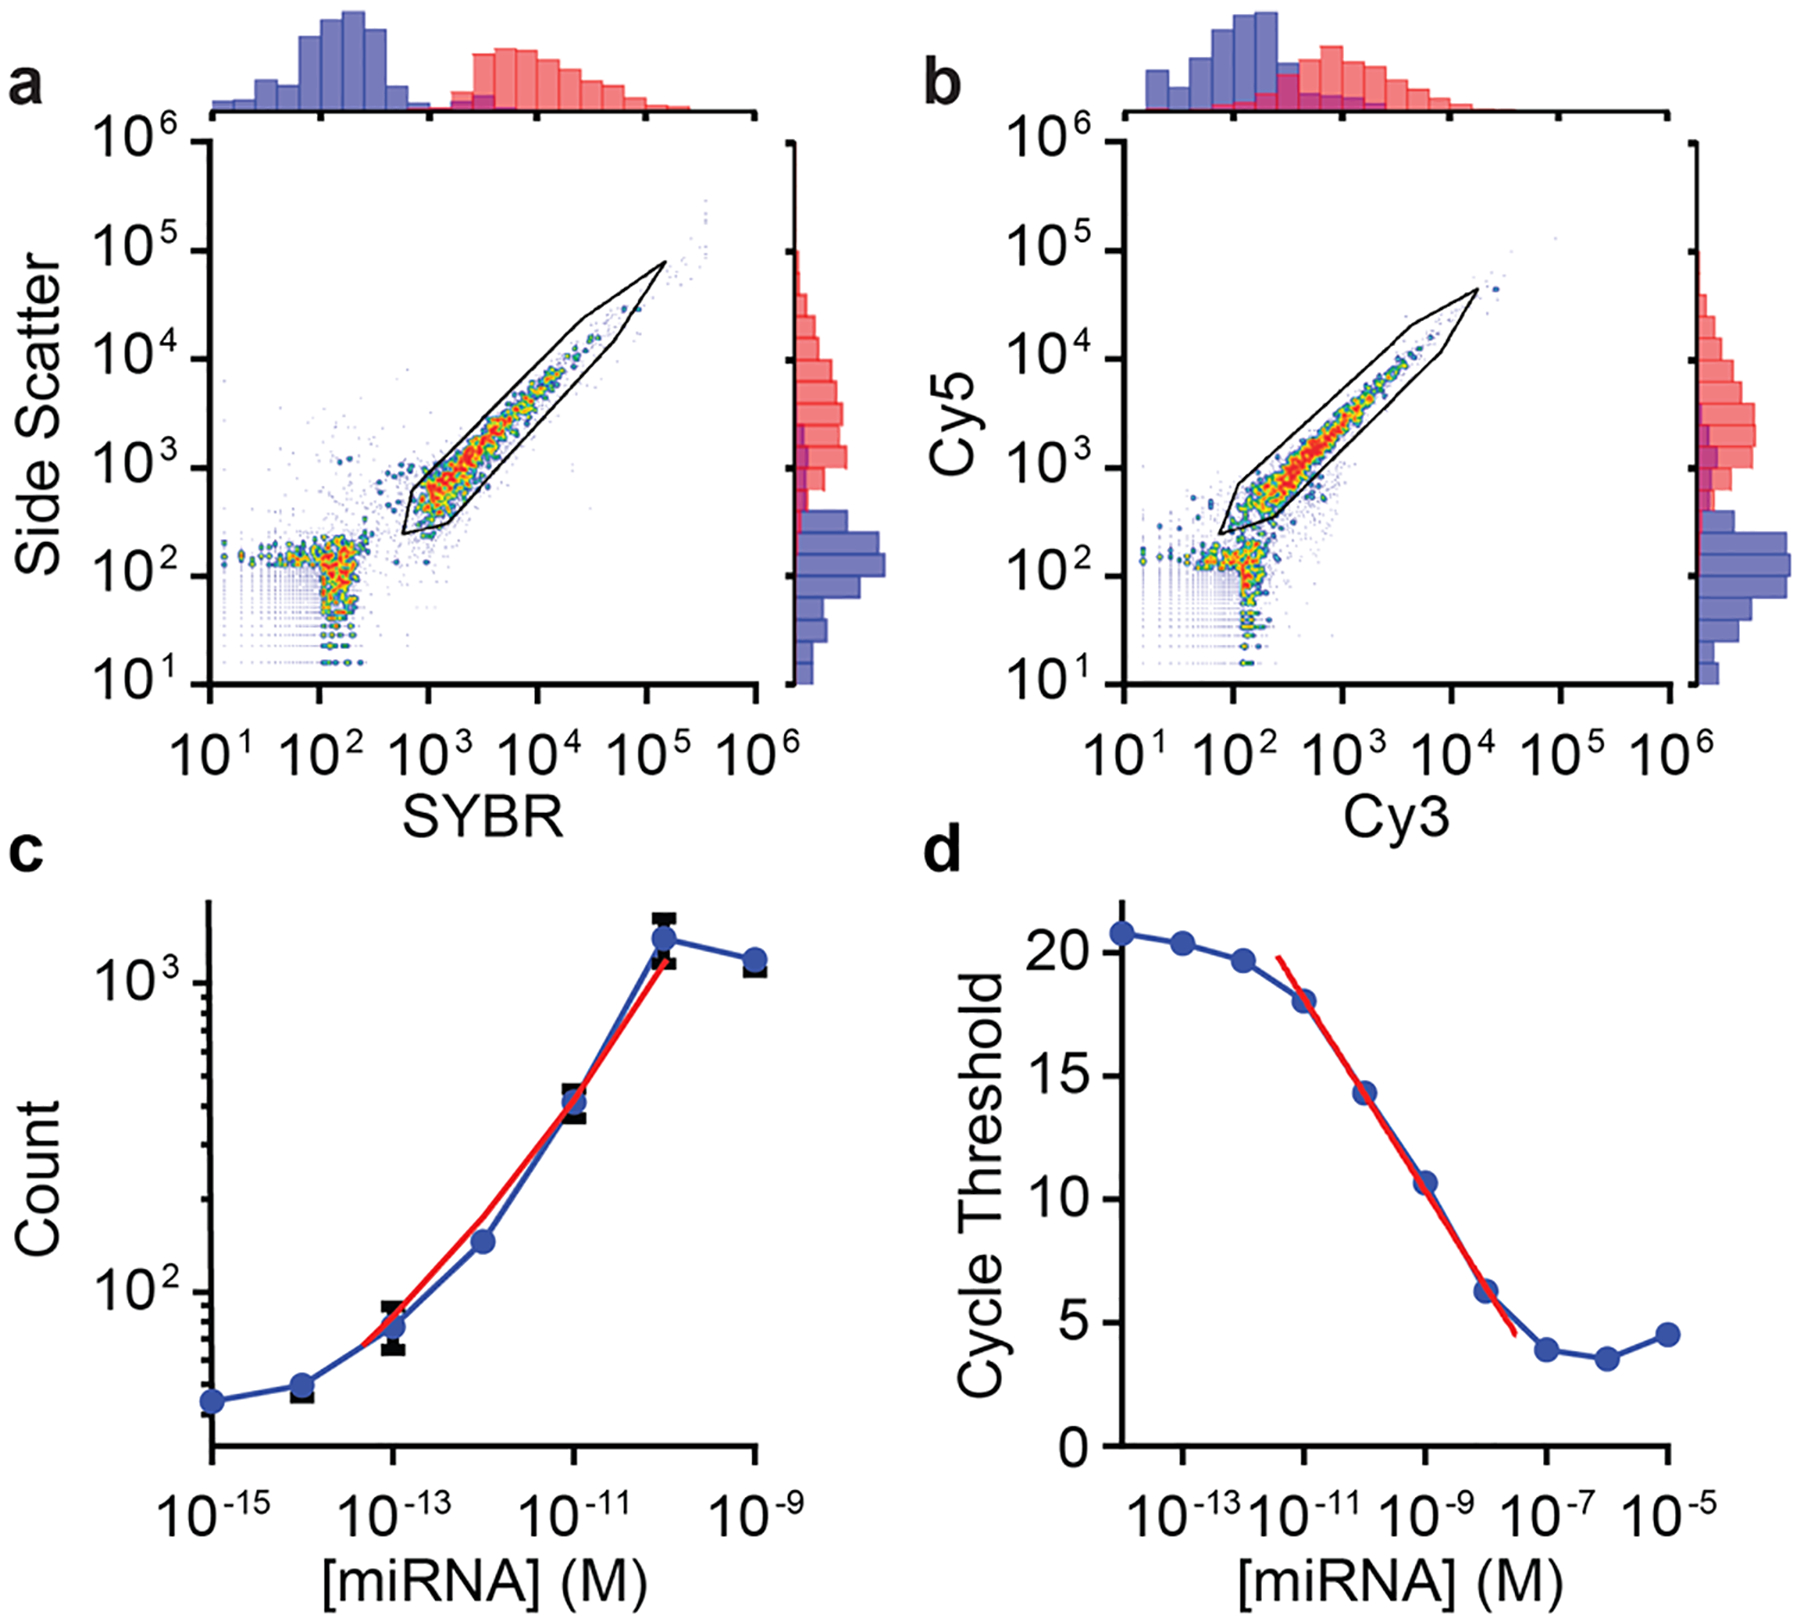
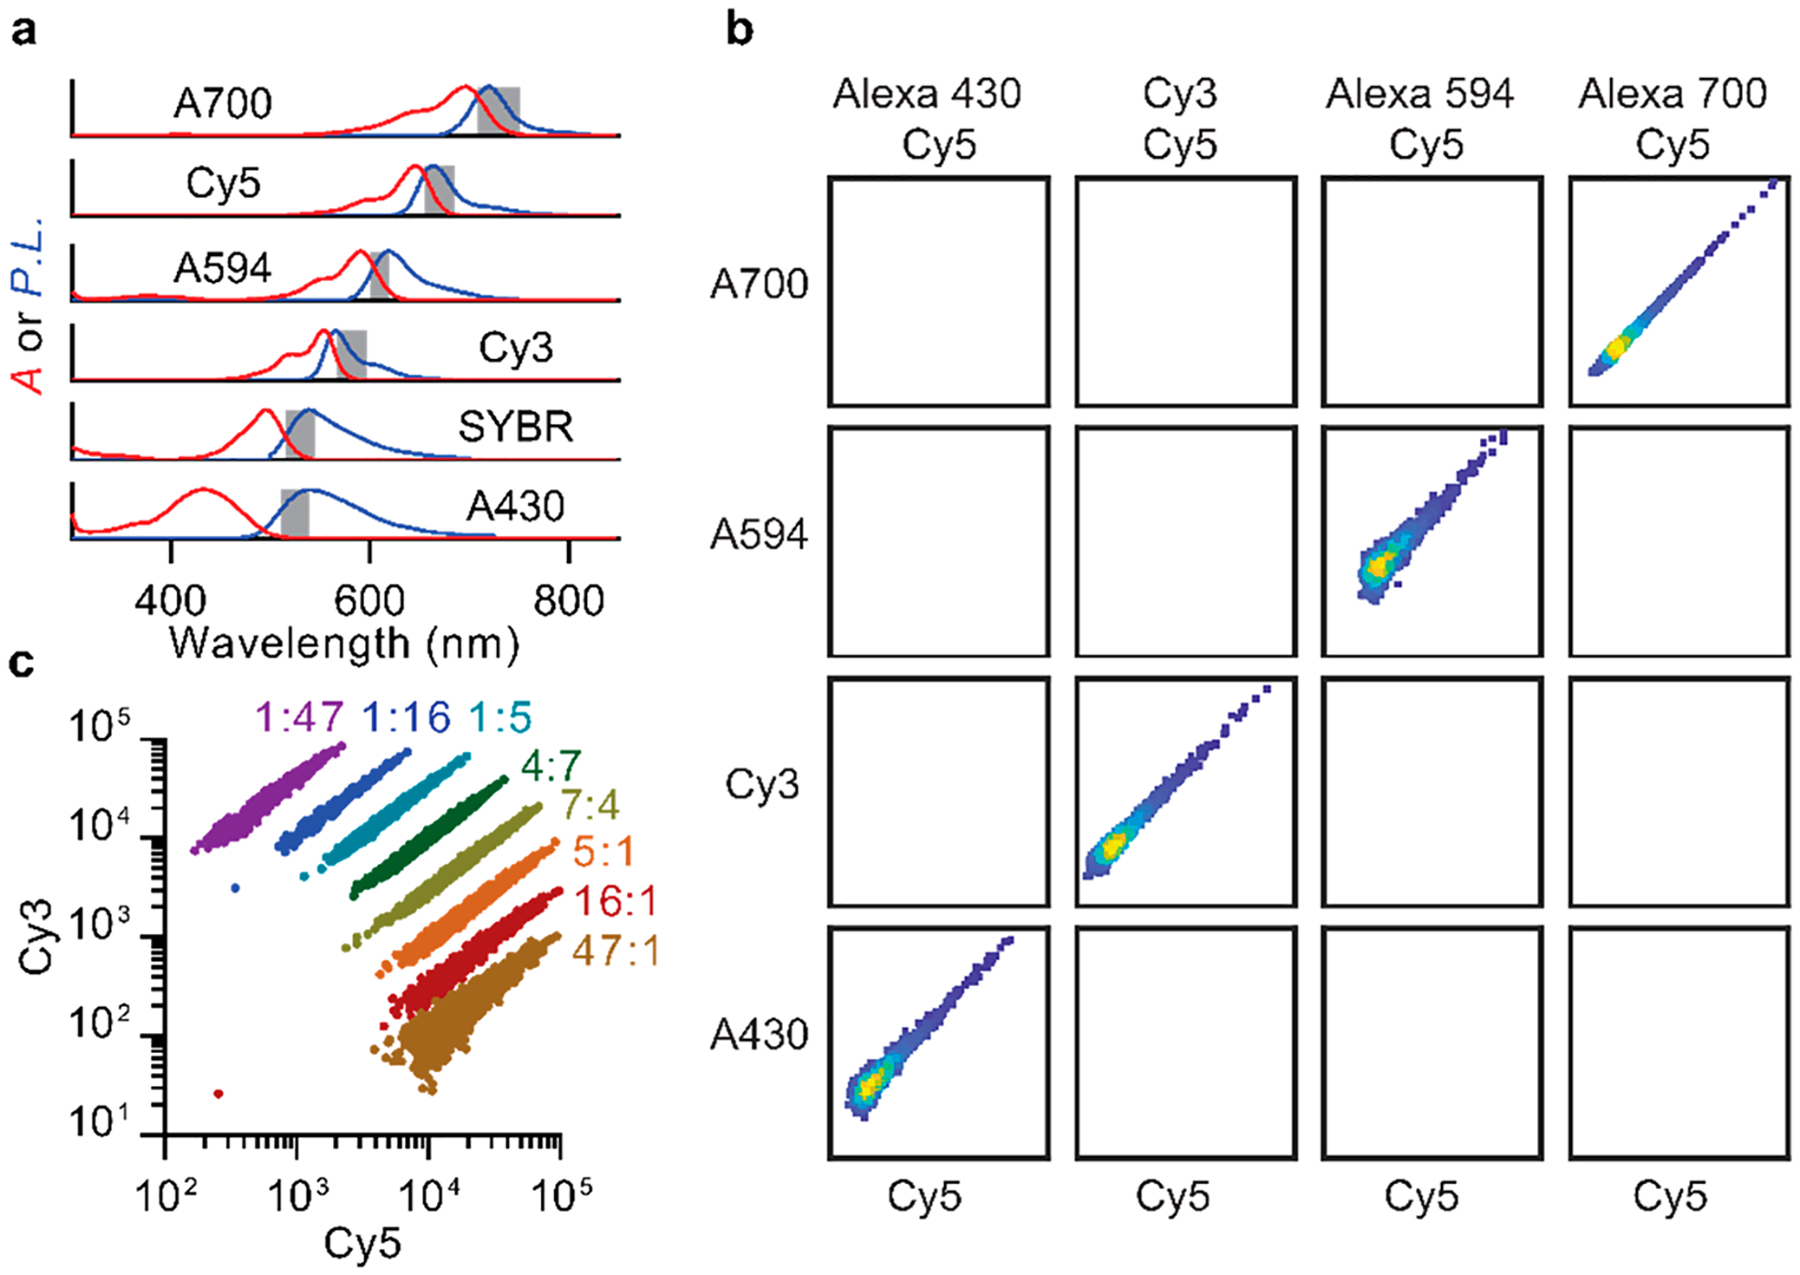
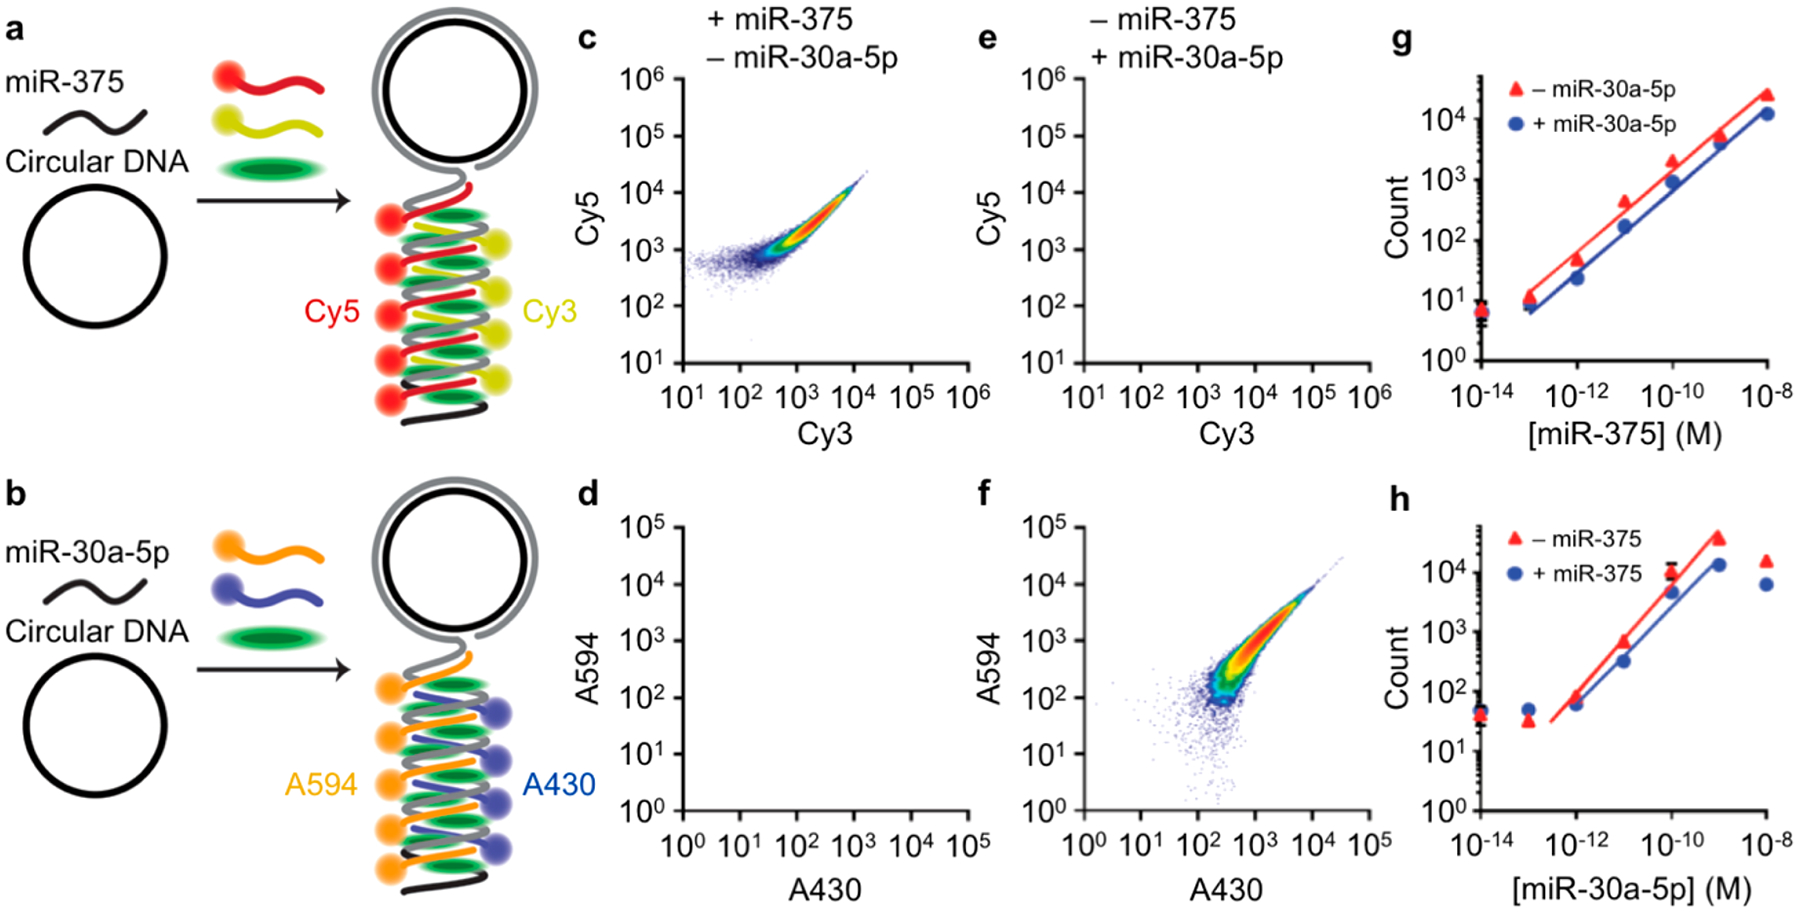
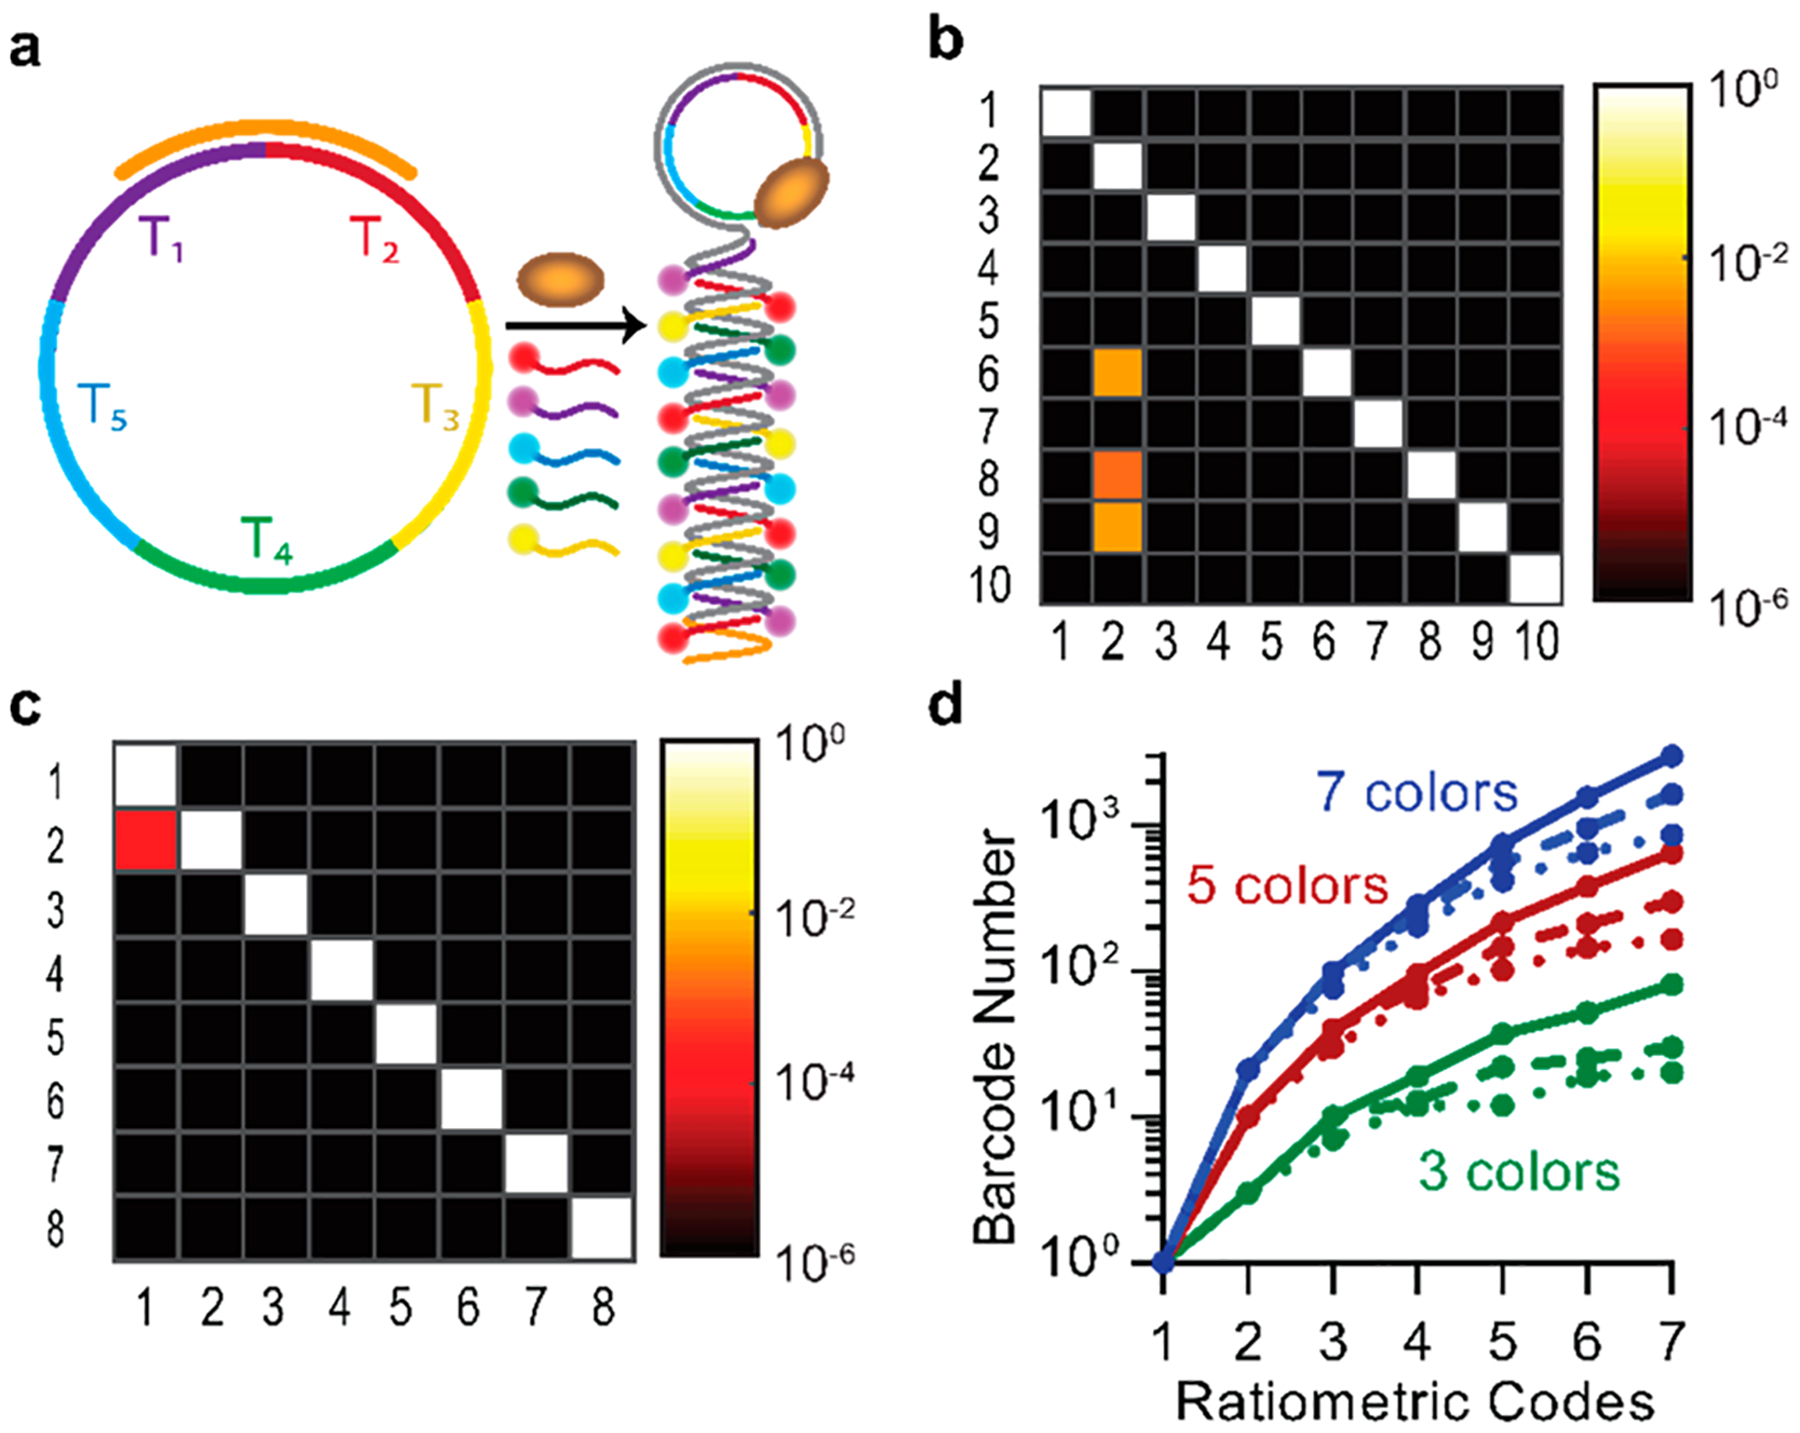
Microfluidic techniques are widely used for high-throughput quantification and discrete analysis of micron-scale objects but are difficult to apply to molecular-scale targets. Instead, single-molecule methods primarily rely on low-throughput microscopic imaging of immobilized molecules. Here we report that commercial-grade flow cytometers can detect single nucleic acid targets following enzymatic extension and dense labeling with multiple distinct fluorophores. We focus on microRNAs, short nucleic acids that can be extended by rolling circle amplification (RCA). We labeled RCA-extended microRNAs with multicolor fluorophores to generate repetitive nucleic acid products with submicron sizes and tunable multispectral profiles. By cross-correlating the multiparametric optical features, signal-to-background ratios were amplified 1600-fold to allow single-molecule detection across 4 orders of magnitude of concentration. The limit of detection was measured to be 47 fM, which is 100-fold better than gold-standard methods based on polymerase chain reaction. Furthermore, multiparametric analysis allowed discrimination of different microRNA sequences in the same solution using distinguishable optical barcodes. Barcodes can apply both ratiometric and colorimetric signatures, which could facilitate high-dimensional multiplexing. Because of the wide availability of flow cytometers, we anticipate that this technology can provide immediate access to high-throughput multiparametric single-molecule measurements and can further be adapted to the diverse range of molecular amplification methods that are continually emerging.
Keywords: RCA; amplification; biomarker; diagnostics; miRNA; microRNA; multiplexing.
Conflict of interest statement
The authors declare no competing financial interest.
Figures
Similar articles
-
Signal amplification by rolling circle amplification on DNA microarrays.Nucleic Acids Res. 2001 Dec 1;29(23):E118. doi: 10.1093/nar/29.23.e118. Nucleic Acids Res. 2001. PMID: 11726701 Free PMC article.
-
A sensitive colorimetric assay system for nucleic acid detection based on isothermal signal amplification technology.Anal Bioanal Chem. 2017 Aug;409(20):4819-4825. doi: 10.1007/s00216-017-0425-4. Epub 2017 Jul 8. Anal Bioanal Chem. 2017. PMID: 28689323
-
Ultrasensitive detection of miRNA via one-step rolling circle-quantitative PCR (RC-qPCR).Anal Chim Acta. 2019 Oct 24;1077:208-215. doi: 10.1016/j.aca.2019.05.028. Epub 2019 May 16. Anal Chim Acta. 2019. PMID: 31307711
-
A guide to accelerated direct digital counting of single nucleic acid molecules by FRET-based intramolecular kinetic fingerprinting.Methods. 2022 Jan;197:63-73. doi: 10.1016/j.ymeth.2021.06.014. Epub 2021 Jun 25. Methods. 2022. PMID: 34182140 Free PMC article. Review.
-
Rolling Circle Amplification in Integrated Microsystems: An Uncut Gem toward Massively Multiplexed Pathogen Diagnostics and Genotyping.Acc Chem Res. 2021 Nov 2;54(21):3979-3990. doi: 10.1021/acs.accounts.1c00438. Epub 2021 Oct 12. Acc Chem Res. 2021. PMID: 34637281 Free PMC article. Review.
Cited by
-
A multiplexed circulating tumor DNA detection platform engineered from 3D-coded interlocked DNA rings.Bioact Mater. 2021 Sep 11;10:68-78. doi: 10.1016/j.bioactmat.2021.09.007. eCollection 2022 Apr. Bioact Mater. 2021. PMID: 34901530 Free PMC article.
-
Perspectives on the Role of Histone Modification in Breast Cancer Progression and the Advanced Technological Tools to Study Epigenetic Determinants of Metastasis.Front Genet. 2020 Oct 29;11:603552. doi: 10.3389/fgene.2020.603552. eCollection 2020. Front Genet. 2020. PMID: 33193750 Free PMC article. Review.
-
Digital and Absolute Assays for Low Abundance Molecular Biomarkers.Acc Chem Res. 2023 May 2;56(9):1031-1042. doi: 10.1021/acs.accounts.3c00030. Epub 2023 Apr 17. Acc Chem Res. 2023. PMID: 37068158 Free PMC article.
-
A Universal Strategy for Enhancing the Circulating miRNAs' Detection Performance of Rolling Circle Amplification by Using a Dual-Terminal Stem-Loop Padlock.ACS Nano. 2024 Jan 9;18(1):436-450. doi: 10.1021/acsnano.3c07721. Epub 2023 Dec 27. ACS Nano. 2024. PMID: 38149638 Free PMC article.
-
High-Throughput, High-Multiplex Digital Protein Detection with Attomolar Sensitivity.ACS Nano. 2022 Jan 25;16(1):1025-1035. doi: 10.1021/acsnano.1c08675. Epub 2022 Jan 14. ACS Nano. 2022. PMID: 35029381 Free PMC article.
References
-
- Eid J; Fehr A; Gray J; Luong K; Lyle J; Otto G; Peluso P; Rank D; Baybayan P; Bettman B; Bibillo A; Bjornson K; Chaudhuri B; Christians F; Cicero R; Clark S; Dalal R; Dewinter A; Dixon J; Foquet M; et al. Real-Time DNA Sequencing from Single Polymerase Molecules. Science 2009, 323, 133–138. - PubMed
-
- Xie XS; Trautman JK Optical Studies of Single Molecules at Room Temperature. Annu. Rev. Phys. Chem 1998, 49, 441–480. - PubMed
-
- Geiss GK; Bumgarner RE; Birditt B; Dahl T; Dowidar N; Dunaway DL; Fell HP; Ferree S; George RD; Grogan T; James JJ; Maysuria M; Mitton JD; Oliveri P; Osborn JL; Peng T; Ratcliffe AL; Webster PJ; Davidson EH; Hood L; et al. Direct Multiplexed Measurement of Gene Expression with Color-Coded Probe Pairs. Nat. Biotechnol 2008, 26, 317–325. - PubMed
-
- Clarke J; Wu H-C; Jayasinghe L; Patel A; Reid S; Bayley H Continuous Base Identification for Single-Molecule Nanopore DNA Sequencing. Nat. Nanotechnol 2009, 4, 265–270. - PubMed
Publication types
MeSH terms
Substances
Grants and funding
LinkOut - more resources
Full Text Sources
Other Literature Sources
