. 2020 Feb 11;16(2):1319-1332.
doi: 10.1021/acs.jctc.9b01146. Epub 2020 Jan 30.

Confinement and Crowding Effects on Folding of a Multidomain Y-Family DNA Polymerase

Affiliations

Confinement and Crowding Effects on Folding of a Multidomain Y-Family DNA Polymerase

Xiakun Chu et al. J Chem Theory Comput. .

Abstract

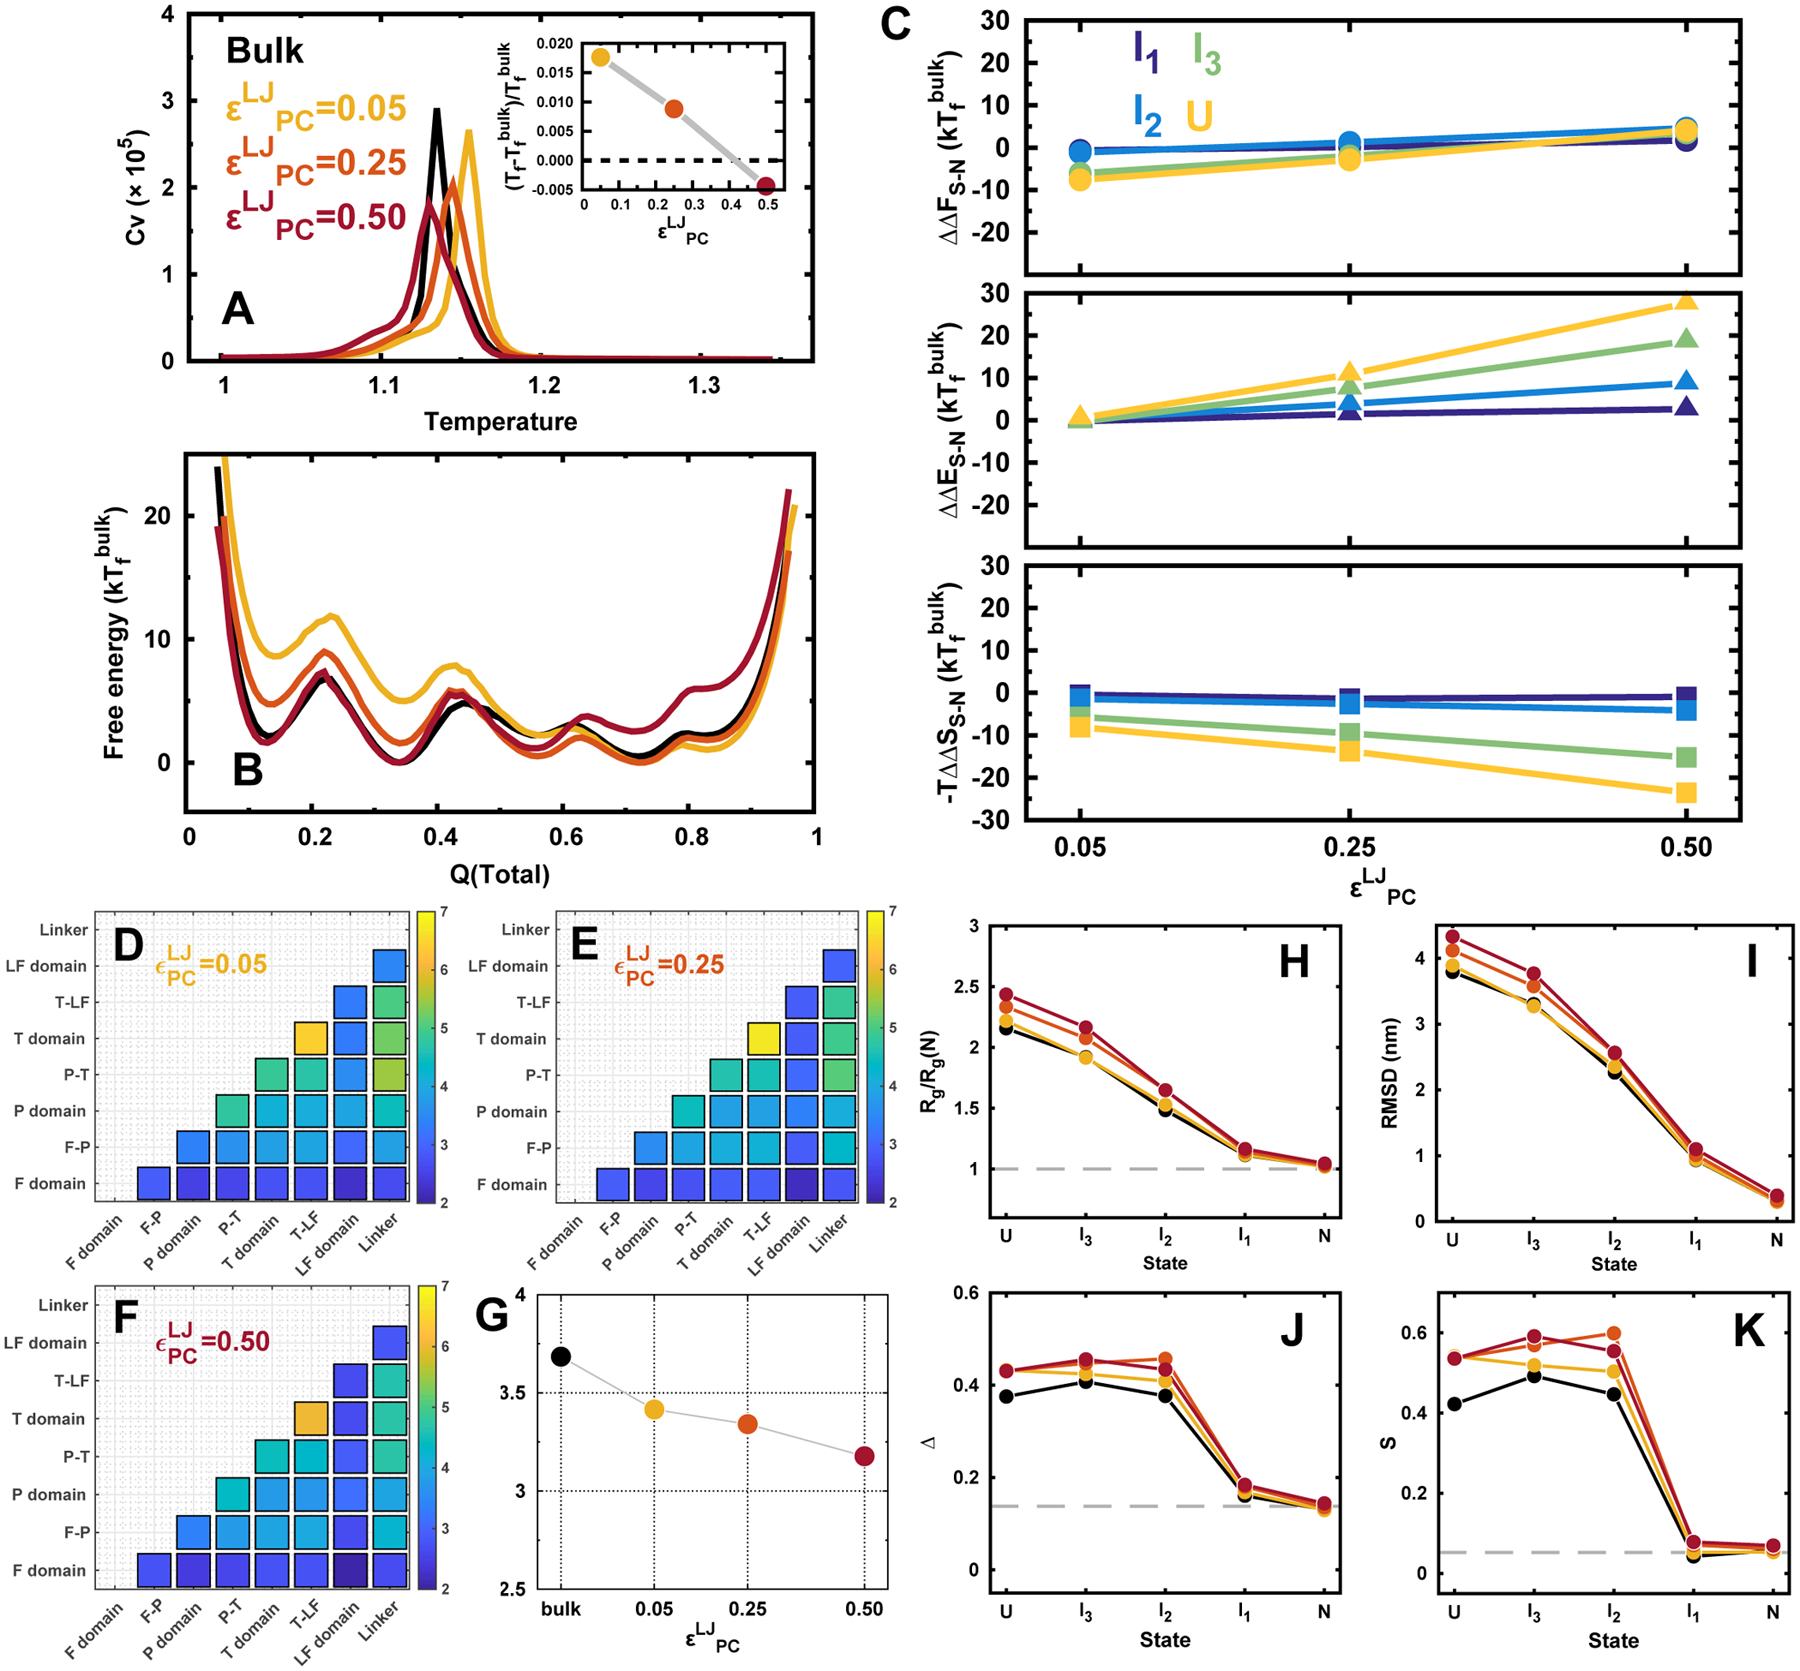
Proteins in vivo endure highly various interactions from the luxuriant surrounding macromolecular cosolutes. Confinement and macromolecular crowding are the two major effects that should be considered while comparing the results of protein dynamics from in vitro to in vivo. However, efforts have been largely focused on single domain protein folding up to now, and the quantifications of the in vivo effects in terms of confinements and crowders on modulating the structure and dynamics as well as the physical understanding of the underlying mechanisms on multidomain protein folding are still challenging. Here we developed a topology-based model to investigate folding of a multidomain Y-family DNA polymerase (DPO4) within spherical confined space and in the presence of repulsive and attractive crowders. We uncovered that the entropic component of the thermodynamic driving force led by confinements and repulsive crowders increases the stability of folded states relative to the folding intermediates and unfolded states, while the enthalpic component of the thermodynamic driving force led by attractive crowders gives rise to the opposite effects with less stability. We found that the shapes of DPO4 conformations influenced by the confinements and the crowders are quite different even when only the entropic component of the thermodynamic driving force is considered. We uncovered that under all in vivo conditions, the folding cooperativity of DPO4 decreases compared to that in bulk. We showed that the loss of folding cooperativity can promote the sequential domain-wise folding, which was widely found in cotranslational multidomain protein folding, and effectively prohibit the backtracking led by topological frustrations during multidomain protein folding processes.


Conflict of interest statement

The authors declare no competing financial interest.

Figures

Figure 1.
Figure 1.
Crystal structure and native contact map of DPO4 (PDB: 2RDI). (A) Different domains of DPO4 are colored with different schemes: F domain (blue, residues 11–77), P domain (red, residues 1–10 and 78–166), T domain (green, residues 167–229), LF domain (magenta, residues 245–341), and flexible linker (gray, residues 230–244). (B) The dotted points represent the native contacts generated by CSU. At the bottom right, the intradomain native contacts are plotted with the color schemes used in (A) and the interfacial contacts between domains are colored cyan (F–P, between F and P domain), orange (P–T, between P and T domain), and purple (T–LF, between T and LF domain). The contacts related to the flexible linker are colored gray. Apparently, there are more intradomain contacts (population is 84.35%) than interdomain contacts (population is 9.86%), which are mostly formed by the sequential neighbor domains, in DPO4’s native structure. Flexible linker extensively forms contacts to each domain with a population of 5.79%. The details of contact formation can be found in Table S1.
Figure 2.
Figure 2.
DPO4 folding in bulk and under confinements. (A) Heat capacity curves of DPO4 folding. Inset shows the folding temperature Tf changes with different confinements. Folding temperature is defined as the most prominent peak position from the heat capacity curve. RC is the radius of spherical confinement, so a small value of RC corresponds to a strong confinement. RC is in the unit of nm. (B) 1D free energy landscapes along Q(total) under different confinements at the folding temperature of the bulk condition (Tfbulk). Q(total) is the fraction of total native contacts of DPO4. There are multiple states formed during the folding process indicated as “U, I3, I2, I1, N”, corresponding to the unfolded states, three intermediate states, and native folded states, respectively. (C) The relative change of the differences in free energy (top), energy (middle), and entropy (bottom) for different folding states of DPO4 to that in bulk along with the different strengths of confinement. The free energy difference between the proceeding state “S” and “N”, where “S” can be any intermediate or unfolded states, is expressed as ΔFSN = FNFS. The change of the free energy led by confinement is then expressed as ΔΔFSN = ΔFSN(RC) – ΔFSN(bulk). Similar calculations were applied to the changes of difference in energy ΔΔESN and entropy ΔΔSSN from simulation with confinement to that in bulk. (D–F) Folding cooperativity quantity TCI for DPO4 folding in bulk and under confinements. (G) MTCI along with RC. (H–K) Structural characterizations of the folding states during DPO4 folding process under different confinements. (H) Radius of gyration Rg of each state in DPO4 folding under different confinements. Rg(N) is the Rg of PDB structure. (I) RMSD to PDB structure of each state during DPO4 folding under different confinements. (J) Asphericity Δ and (K) shape S parameters of each state during DPO4 folding under different confinements. The dashed lines indicate the values at native PDB structure.
Figure 3.
Figure 3.
Backtracking in DPO4 folding. (A) The evolutions of native contact formation of DPO4 during folding under different confinements. Q(intra) (dashed lines) and Q(inter) (solid lines) are the fractions of intra- and interdomain contacts, respectively. (B) 2D free energy landscape projected onto Q(total) and Q(inter). Two parallel pathways are identified by proceeding through two different transition states (TS1 and TS2). (C) Evolutions of the native contact map in the two parallel folding pathways. Within the bottom-right triangle of each contact map panel, one representative DPO4 structure for the corresponding state is shown.
Figure 4.
Figure 4.
DPO4 folding in bulk and with repulsive crowders. (A) Heat capacity curves of DPO4. Inset shows the folding temperature Tf changes with different concentrations of repulsive crowders ΦC. (B) 1D free energy landscapes along Q(total) under with different concentrations of repulsive crowders at the folding temperature of bulk condition (Tfbulk). (C) The relative change of the differences in free energy (top), energy (middle), and entropy (bottom) for different folding states of DPO4 to that in bulk along with the different concentrations of repulsive crowders. (D–G) TCI for DPO4 folding with different concentrations of repulsive crowders. (H–K) Structural characterizations of the folding states during DPO4 folding process with different concentrations of repulsive crowders.
Figure 5.
Figure 5.
DPO4 folding with different strengths of attractive protein-crowder interaction. (A) Heat capacity curves of DPO4. Inset shows the folding temperature Tf changes with different strengths of attractive protein-crowder interaction ϵPCLJ. (B) 1D free energy landscapes along Q(total) under with different strengths of attractive protein-crowder interaction at the folding temperature of bulk condition (Tfbulk). (C) The relative change of the differences in free energy (top), energy (middle), and entropy (bottom) for different folding states of DPO4 to that in bulk along with different strengths of attractive protein–crowder interaction. (D–G) TCI for DPO4 folding with different strengths of attractive protein-crowder interaction. (H–K) Structural characterizations of the folding states during the DPO4 folding process with different strengths of attractive protein–crowder interaction. The concentration of the crowder is fixed at ΦC = 0.20 with different strengths of protein–crowder interaction.

Similar articles

Cited by

References

    1. Fulton AB How crowded is the cytoplasm? Cell 1982, 30, 345–347. - PubMed
    1. Ellis RJ; Minton AP Cell biology: join the crowd. Nature 2003, 425, 27. - PubMed
    1. Elcock AH Models of macromolecular crowding effects and the need for quantitative comparisons with experiment. Curr. Opin. Struct. Biol 2010, 20, 196–206. - PMC - PubMed
    1. Rivas G; Minton AP Macromolecular crowding in vitro, in vivo, and in between. Trends Biochem. Sci 2016, 41, 970–981. - PMC - PubMed
    1. Zimmerman SB; Minton AP Macromolecular crowding: biochemical, biophysical, and physiological consequences. Annu. Rev. Biophys. Biomol. Struct 1993, 22, 27–65. - PubMed

Substances

LinkOut - more resources