. 2020 Feb 26;10(2):169-182.e5.
doi: 10.1016/j.cels.2019.12.004. Epub 2020 Jan 22.

Gene Regulatory Strategies that Decode the Duration of NFκB Dynamics Contribute to LPS- versus TNF-Specific Gene Expression

Affiliations

Gene Regulatory Strategies that Decode the Duration of NFκB Dynamics Contribute to LPS- versus TNF-Specific Gene Expression

Supriya Sen et al. Cell Syst. .

Abstract

Pathogen-derived lipopolysaccharide (LPS) and cytokine tumor necrosis factor (TNF) activate NFκB with distinct duration dynamics, but how immune response genes decode NFκB duration to produce stimulus-specific expression remains unclear. Here, detailed transcriptomic profiling of combinatorial and temporal control mutants identified 81 genes that depend on stimulus-specific NFκB duration for their stimulus-specificity. Combining quantitative experimentation with mathematical modeling, we found that for some genes a long mRNA half-life allowed effective decoding, but for many genes this was insufficient to account for the data; instead, we found that chromatin mechanisms, such as a slow transition rate between inactive and RelA-bound enhancer states, could also decode NFκB dynamics. Chromatin-mediated decoding is favored by genes acting as immune effectors (e.g., tissue remodelers and T cell recruiters) rather than immune regulators (e.g., signaling proteins and monocyte recruiters). Overall, our results delineate two gene regulatory strategies that decode stimulus-specific NFκB dynamics and determine distinct biological functions.

Keywords: NF-kappa B; chromatin regulation; duration decoding; mRNA half-life; stimulus-specificity.


Conflict of interest statement

Declaration of Interests The authors declare no competing interests.

Figures

Figure 1
Figure 1. Identifying LPS-specific genes that do not depend on interferon signaling.
(A) Schematic of the signaling pathways for TNF, LPS and IL1 that activate downstream gene expression through transcriptional factors AP1, NFκB and IRF3/ISGF3. The percentage of LPS-induced genes that are targets of each transcription factor, as identified in Cheng et al (Cheng et al., 2017), is indicated. (B) EMSA showing NFκB activity in Ifnar−/− MEFs following treatment with LPS (100 ng/ml), TNF (1 ng/ml), or IL1 (1 ng/ml). (C) Scatter plots of maximum gene expression between LPS and TNF, LPS and IL1, TNF and IL1. (D) Scatter plot showing that LPS vs TNF specificity correlates well to LPS vs IL1 specificity. The pair-wise specificity (L vs. T or L vs. I) for each gene is defined by log2 of the fold ratio between maximum expression in LPS treatment vs. TNF or IL1 treatment respectively. (E) Pie chart showing TNF-specific, LPS-specific or non-specific genes, using a L vs. T specificity threshold value of ≥ 0.5 or ≤−0.5. (F) Heat-map of polyA+ RNA expression profiles (normalized to max) of the 177 induced genes in Ifnar−/− MEFs by LPS (100 ng/ml), TNF (1 ng/ml) or IL1 (1 ng/ml) at each of the indicated time-points. The three groups of genes defined in (E) are shown in distinct expression clusters. Specificity metrics (Lvs.T, Lvs.I, T vs.I) are shown on left. Results from two independent biological replicates are shown (see also Table S1).
Figure 2
Figure 2. Determining the NFκB duration dependency of LPS-specific gene expression.
(A) Dynamics of nuclear NFκB activity measured by EMSA in control (Ifnar−/−) and mutant (Ifnar−/−Nfκbia−/−) in response to 30 min pulse of 100 ng/ml LPS or 1ng/ml TNF. Error bars are standard deviations (SD) from 3–5 independent experiments. p value was calculated by multiple t-test using Graph-pad Prizm. P value >0.05 considered significant (B) Pie charts showing TNF-specific, LPS-specific, or nonspecific genes using the specificity threshold of 0.5 in control vs mutant (same definition as in Figure 1D). (C) 177 differentially induced genes are categorized into 3 groups based on the loss of specificity in the mutant. Group I. not LPS-specific: if Lvs.T in control as well as mutant is less than 0.5; group II. NFκB dynamics independent and LPS-specific: if Lvs.T in control is higher than 0.5 and L vs. T in mutant is not reduced by 2^0.5 fold (i.e. above line y=0.71x); group III. NFκB dynamics dependent and LPS-specific: if Lvs.T in control is higher than 0.5 and Lvs.T in mutant is reduced by 2^0.5 fold (i.e. below line y=0.71x). The expression trajectories for example genes in each category are shown on the right. (D) Heat-map of polyA+ RNA-seq gene expression profiles (normalized to max) for control and mutant cells for indicated time-points (See also Table S2). (E) Known TF binding motifs (κB, AP1 and IRE) and (F) Gene Ontology (GO) terms enrichment level is shown as the p-value in -log10, using genes in each category and remaining genes as background. If p-value >0.05, it is shown as ‘–‘.)
Figure 3
Figure 3. Long-mRNA half-lives are correlated with LPS specificity.
(A-B) Heat-map of simulated gene expression profiles with different mRNA half-lives (from 1 min to 1000 mins) using a simple ordinary differential equation (ODE) model. NFκB activity profiles in response to LPS (left) or TNF (right) are used as input, in control (A) or in mutant (B). ODE is shown in the top panel: mRNA abundance is determined by NFκB-dependent synthesis using a Hill-equation (with a basal synthesis) and a first-order degradation term. The yellow color-bar on the right sight of the heat-map shows the peak expression ratio (P.R.) between LPS and TNF input given the same mRNA half-life. Example trajectories of different half-lives are shown on the right for LPS input (red line) and TNF input (green). Grey dashed lines indicate a half-life of 30 mins and 100 mins. (C) Line-graph showing that the predicted Lvs.T specificity from simulation results in (A) and (B) is correlated with mRNA half-life. (D) Gene expression profiles (log2 ratio with respect to unstimulated timepoint) for the 177 inducible genes after Actinomycin D treatment (ActD-seq) in control cells at indicated time points for two independent biological replicates are shown. The right-side annotation color-bars indicate the derived mRNA half-life using an adapted linear regression method on log2 expression of actinomycin-D time-course data (See also Table S3). (E) Four example genes are shown on the right. Dots are the values from ActD-seq data with two different colors to indicate replicates. The dots with an open circle are the data points selected for linear regression. If the initial reads are not enough (less than 32), the half-life is not determined (e.g. Mmp1b). (F) Scatter of derived half-life between the two replicates with density distribution shown on the top and right. (G) Box-plots showing that the measured Lvs.T specificity from the RNA-seq in Fig. 2D is correlated with the derived mRNA half-life from Act-D-seq.
Figure 4
Figure 4. Model-aided analysis to determine sufficiency of mRNA half-life as the decoding mechanism.
(A) Diagram of model v1 showing NFκB activity and mRNA half-life (range) as inputs to output mRNA expression profiles. By comparing the predicted trajectory with the experimental measurement from RNA-seq, we can test for each gene in category II in Figure 2D, whether a parameter set can be found that allows the model to fit the data. (B) Comparing gene expression profiles between data and best-fit model simulation in response to indicated stimulus. The expression levels are normalized to the maximum in control or mutant individually. The yellow and black color bar indicates whether the best fit model is acceptable (normalized RMSD <0.13) or not (See also Table S4) (C) Line graphs for seven genes are shown to represent how well the best fit model matches the experimental data. (D) Testing whether NFκB dynamics-dependent LPS-specificity is dependent on the mRNA half-life for the fitted genes. Predicted Lvs.T specificity in best-fit model for control (black closed circle) and mutant (black open circle) for the genes with nRMSD < 0.13 in 4B is shown. The length of the line connecting control and mutant indicates the degree to which specificity is dependent on NFκB dynamics. The blue lines and dots are the in-silico perturbation results obtained by only changing the mRNA half-life in the best-fit model to 15 mins. (E) Expression trajectories for six genes with estimated half-life and fixed short half-life (15 mins) are shown. (F) Graph showing the comparison of Lvs.T specificity of model fitted (yellow) and non-fitted (black dots) genes in control vs mutant. Lvs.T specificity of model fitted (yellow) genes is significantly higher compared to non-fitted (black dots) genes in mutant, but not in control. P-values are generated by one-tailed Student’s T-test.
Figure 5
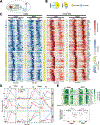
Figure 5. Stimulus-specific NFκB dynamics may be decoded at the level of transcriptional initiation.
(A) Cartoon showing the synthesis of nascent, chromatin-associated RNA (caRNA) in the nucleus and transport of mature RNA (mRNA) to cytoplasm after post-transcriptional processing. (B) Pie charts showing LPS specific or nonspecific genes using a threshold of 20.5 in control vs mutant at the caRNA level. (C) Heat-maps comparing gene expression (normalized to max) at PolyA+ RNA (mature-mRNA) and caRNA (pre-mRNA) levels for control and mutant cells for indicated time-points (See also Table S5) (D) Relative expression levels are shown by line graphs. (E) Heatmap of RelA ChIP-seq in control and mutant cells for genes in cluster 3 (top panel). Grayed out rows were genes for which no peaks were mapped to it. Boxplots show maximum peak intensity for each gene in the heatmap (normalized individually for control and mutant cells) (bottom panel) with p values indicated (two-sided t-test).
Figure 6
Figure 6. Model-aided analysis to quantify chromatin-associated decoding of stimulus-specific NFκB dynamics.
(A) Model diagram and ODEs of two-step model v2. NFκB (red dimer) serves to both open chromatin and activate transcription. Chromatin transitions between closed, open, and active states. Transcription can only occur from the active state. Parameters in parentheses correspond to the parameters in the model. The details of the model can be found in the Method section. (B) Experimental data and model simulation of three example genes with nRMSD for each gene shown. (C) Simulation heatmap for caRNA and polyA+ RNA in control and mutant MEFs stimulated with LPS or TNF. (nRMSD <0.13 defined as good fit for v2, marked with Yellow; For v1, same as Fig. 4B, see also Table S6) (See also Fig.S3 for side-by-side comparison of data and simulation.)
Figure 7
Figure 7. Distinct regulatory strategies that decode NFκB duration-dependent gene expression.
(A) Diagram illustrating two broad regulatory mechanisms that may decode stimulus-specific duration of NFκB dynamics to contribute to LPS vs.TNF-specific gene expression. (B) Stacked bar graphs showing the relative contribution of mRNA half-life (T1/2) and chromatin-regulation to the decoding of stimulus-specific gene expression. The grey portion of each bar denotes stimulus-specificity that is not mitigated by the NFκB dynamic mutant. Genes are ordered by whether they are controlled by a predominantly chromatin-associated mechanism, mixed mechanisms, or a predominantly mRNA T1/2 mechanism. (C) Scatterplot of chromatin contribution versus half-life contribution for all genes. Four selected genes from Fig. 7B that are controlled by either predominantly a chromatin-associated mechanism or an mRNA half-life mechanism are indicated. (D) Example ATAC-seq track view of a predominantly chromatin-controlled gene. (E) Boxplots of read counts for ATAC-seq data indicates that chromatin-regulated genes are more likely to have closed chromatin at promoter regions (peaks found within −1000 to 100 basepairs of the TSS). Genes are grouped by the categories shown in Fig. 7B. Two-sided Wilcoxon-Mann-Whitney U test p values are shown. (F) Boxplots of the difference in read counts of Control and Mutant cells after 2hrs treated with TNF pulse, compared to the 0 hr basal counts. Genes are grouped by the categories shown in Fig. 7B. Shown are one-sided Wilcoxon-Mann-Whitney U test p values that chromatin-controlled genes shown greater differences from baseline. Lines inside boxplots represent the 25th, 50th, and 75th quantiles. Whiskers extend up to 1.5 the interquartile range, with genes outside this represented as outlier points.

References

    1. Amit I, Garber M, Chevrier N, Leite AP, Donner Y, Eisenhaure T, Guttman M, Grenier JK, Li W, Zuk O, et al. (2009). Unbiased Reconstruction of a Mammalian Transcriptional Network Mediating Pathogen Responses. Science 326, 257–263. - PMC - PubMed
    1. Ashall L, Horton CA, Nelson DE, Paszek P, Harper CV, Sillitoe K, Ryan S, Spiller DG, Unitt JF, Broomhead DS, et al. (2009). Pulsatile stimulation determines timing and specificity of NF-kappaB-dependent transcription. Science 324, 242–246. - PMC - PubMed
    1. Barish GD, Yu RT, Karunasiri M, Ocampo CB, Dixon J, Benner C, Dent AL, Tangirala RK, and Evans RM (2010). Bcl-6 and NF- B cistromes mediate opposing regulation of the innate immune response. Genes & Development 24, 2760–2765. - PMC - PubMed
    1. Basak S, Behar M, and Hoffmann A (2012). Lessons from mathematically modeling the NF-κB pathway: Mathematical modeling the NF-κB pathway. Immunological Reviews 246, 221–238. - PMC - PubMed
    1. Batchelor E, Loewer A, Mock C, and Lahav G (2014). Stimulus-dependent dynamics of p53 in single cells. Molecular Systems Biology 7, 488–488. - PMC - PubMed

Publication types

MeSH terms