Spatial and biochemical interactions between bone marrow adipose tissue and hematopoietic stem and progenitor cells in rhesus macaques
- PMID: 31972314
- PMCID: PMC7085416
- DOI: 10.1016/j.bone.2020.115248
Spatial and biochemical interactions between bone marrow adipose tissue and hematopoietic stem and progenitor cells in rhesus macaques
Abstract
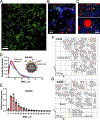
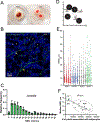
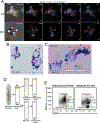
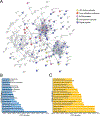
Recent developments in in situ microscopy have enabled unparalleled resolution of the architecture of the bone marrow (BM) niche for murine hematopoietic stem and progenitor cells (HSPCs). However, the extent to which these observations can be extrapolated to human BM remains unknown. In humans, adipose tissue occupies a significant portion of the BM medullary cavity, making quantitative immunofluorescent analysis difficult due to lipid-mediated light scattering. In this study, we employed optical clearing, confocal microscopy and nearest neighbor analysis to determine the spatial distribution of CD34+ HSPCs in the BM in a translationally relevant rhesus macaque model. Immunofluorescent analysis revealed that femoral BM adipocytes are associated with the branches of vascular sinusoids, with half of HSPCs localizing in close proximity of the nearest BM adipocyte. Immunofluorescent microscopy and flow cytometric analysis demonstrate that BM adipose tissue exists as a multicellular niche consisted of adipocytes, endothelial cells, granulocytes, and macrophages. Analysis of BM adipose tissue conditioned media using liquid chromatography-tandem mass spectrometry revealed the presence of multiple bioactive proteins involved in regulation of hematopoiesis, inflammation, and bone development, with many predicted to reside inside microvesicles. Pretreatment of purified HSPCs with BM adipose tissue conditioned media, comprising soluble and exosomal/microvesicle-derived factors, led to enhanced proliferation and an increase in granulocyte-monocyte differentiation potential ex vivo. Our work extends extensive studies in murine models, indicating that BM adipose tissue is a central paracrine regulator of hematopoiesis in nonhuman primates and possibly in humans.
Keywords: Bone marrow adipose tissue; Bone marrow niche; Hematopoietic stem and progenitor cells; Microscopy; Nonhuman primates.
Copyright © 2020 Elsevier Inc. All rights reserved.
Conflict of interest statement
Declaration of competing interest The authors have no conflicts of interest to declare.
Figures


Similar articles
-
Daily Ethanol Drinking Followed by an Abstinence Period Impairs Bone Marrow Niche and Mitochondrial Function of Hematopoietic Stem/Progenitor Cells in Rhesus Macaques.Alcohol Clin Exp Res. 2020 May;44(5):1088-1098. doi: 10.1111/acer.14328. Epub 2020 Apr 21. Alcohol Clin Exp Res. 2020. PMID: 32220015 Free PMC article.
-
Endothelial Cells Promote Expansion of Long-Term Engrafting Marrow Hematopoietic Stem and Progenitor Cells in Primates.Stem Cells Transl Med. 2017 Mar;6(3):864-876. doi: 10.5966/sctm.2016-0240. Epub 2016 Oct 14. Stem Cells Transl Med. 2017. PMID: 28297579 Free PMC article.
-
Flow Cytometry Analysis of Murine Bone Marrow Hematopoietic Stem and Progenitor Cells and Stromal Niche Cells.J Vis Exp. 2022 Sep 28;(187). doi: 10.3791/64248. J Vis Exp. 2022. PMID: 36279539
-
Bone marrow adiposity and the hematopoietic niche: A historical perspective of reciprocity, heterogeneity, and lineage commitment.Best Pract Res Clin Endocrinol Metab. 2021 Jul;35(4):101564. doi: 10.1016/j.beem.2021.101564. Epub 2021 Aug 10. Best Pract Res Clin Endocrinol Metab. 2021. PMID: 34417114 Review.
-
Bone Marrow Adipose Tissue: Regulation of Osteoblastic Niche, Hematopoiesis and Hematological Malignancies.Stem Cell Rev Rep. 2023 Jul;19(5):1135-1151. doi: 10.1007/s12015-023-10531-3. Epub 2023 Mar 17. Stem Cell Rev Rep. 2023. PMID: 36930385 Review.
Cited by
-
Bone Marrow Adipocytes: A Critical Player in the Bone Marrow Microenvironment.Front Cell Dev Biol. 2021 Nov 29;9:770705. doi: 10.3389/fcell.2021.770705. eCollection 2021. Front Cell Dev Biol. 2021. PMID: 34912805 Free PMC article. Review.
-
Extracellular Vesicles as Communicators of Senescence in Musculoskeletal Aging.JBMR Plus. 2022 Oct 13;6(11):e10686. doi: 10.1002/jbm4.10686. eCollection 2022 Nov. JBMR Plus. 2022. PMID: 36398109 Free PMC article. Review.
-
Maternal diet alters long-term innate immune cell memory in fetal and juvenile hematopoietic stem and progenitor cells in nonhuman primate offspring.Cell Rep. 2023 Apr 25;42(4):112393. doi: 10.1016/j.celrep.2023.112393. Epub 2023 Apr 13. Cell Rep. 2023. PMID: 37058409 Free PMC article.
-
Emerging insights into epigenetics and hematopoietic stem cell trafficking in age-related hematological malignancies.Stem Cell Res Ther. 2024 Nov 6;15(1):401. doi: 10.1186/s13287-024-04008-4. Stem Cell Res Ther. 2024. PMID: 39506818 Free PMC article. Review.
-
Experimental analysis of bone marrow adipose tissue and bone marrow adipocytes: An update from the bone marrow adiposity society (BMAS).Bone Rep. 2025 Jul 28;26:101861. doi: 10.1016/j.bonr.2025.101861. eCollection 2025 Sep. Bone Rep. 2025. PMID: 40837072 Free PMC article. Review.
References
-
- Crane GM, Jeffery E, Morrison SJ, Adult haematopoietic stem cell niches, Nat Rev Immunol 17(9) (2017) 573–590. - PubMed
-
- Wilson A, Laurenti E, Oser G, van der Wath RC, Blanco-Bose W, Jaworski M, Offner S, Dunant CF, Eshkind L, Bockamp E, Lio P, Macdonald HR, Trumpp A, Hematopoietic stem cells reversibly switch from dormancy to self-renewal during homeostasis and repair, Cell 135(6) (2008) 1118–29. - PubMed
-
- Essers MA, Offner S, Blanco-Bose WE, Waibler Z, Kalinke U, Duchosal MA, Trumpp A, IFNalpha activates dormant haematopoietic stem cells in vivo, Nature 458(7240) (2009) 904–8. - PubMed
Publication types
MeSH terms
Grants and funding
LinkOut - more resources
Full Text Sources

