. 2020 Feb:30:101431.
doi: 10.1016/j.redox.2020.101431. Epub 2020 Jan 12.

Excessive oxidative stress in cumulus granulosa cells induced cell senescence contributes to endometriosis-associated infertility

Affiliations

Excessive oxidative stress in cumulus granulosa cells induced cell senescence contributes to endometriosis-associated infertility

Xiang Lin et al. Redox Biol. 2020 Feb.

Abstract

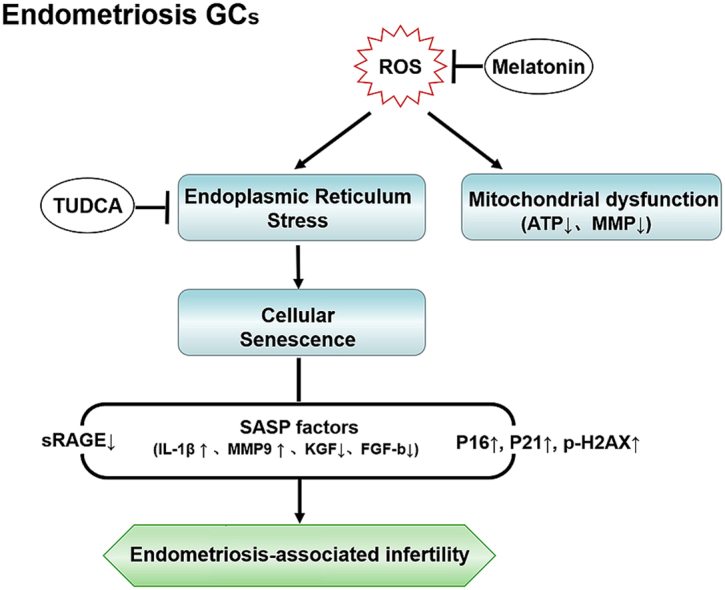
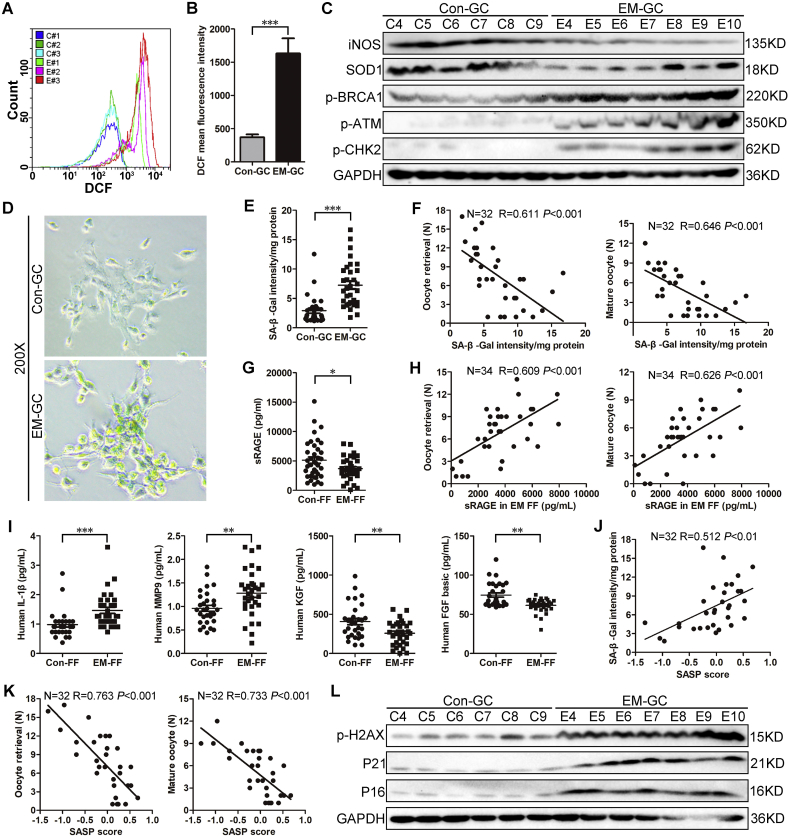
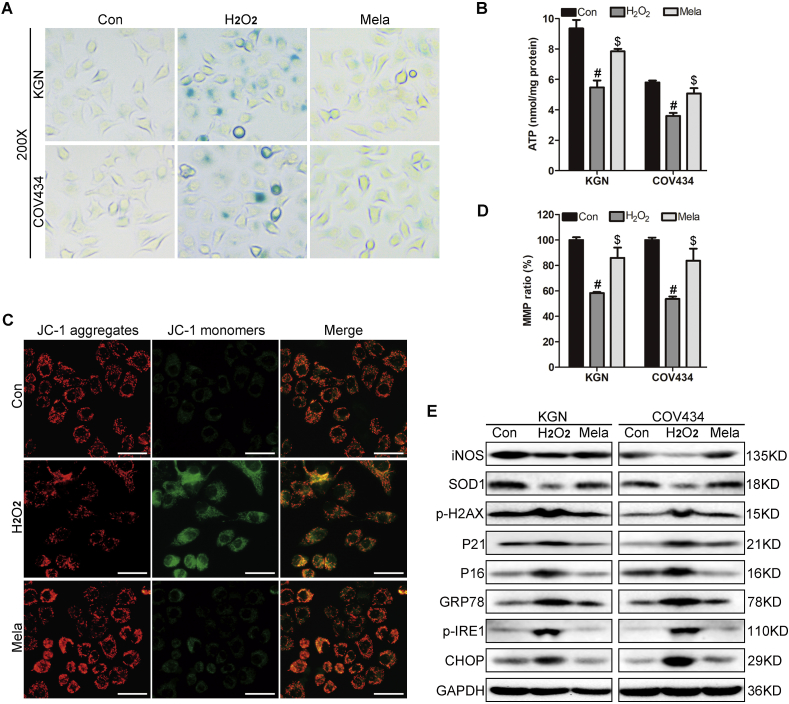
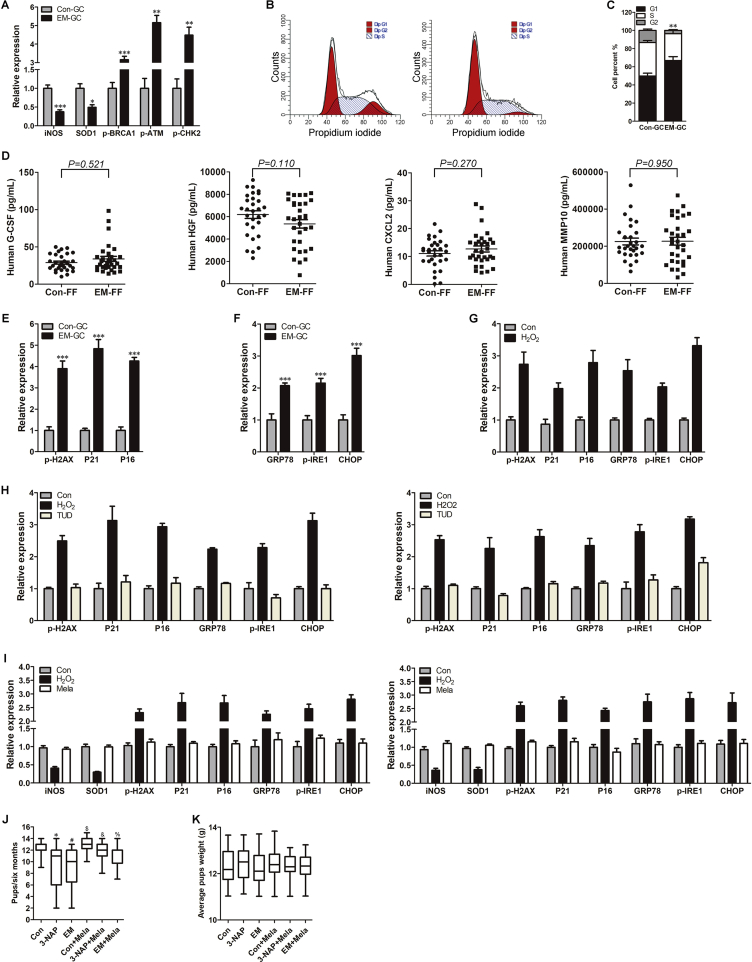
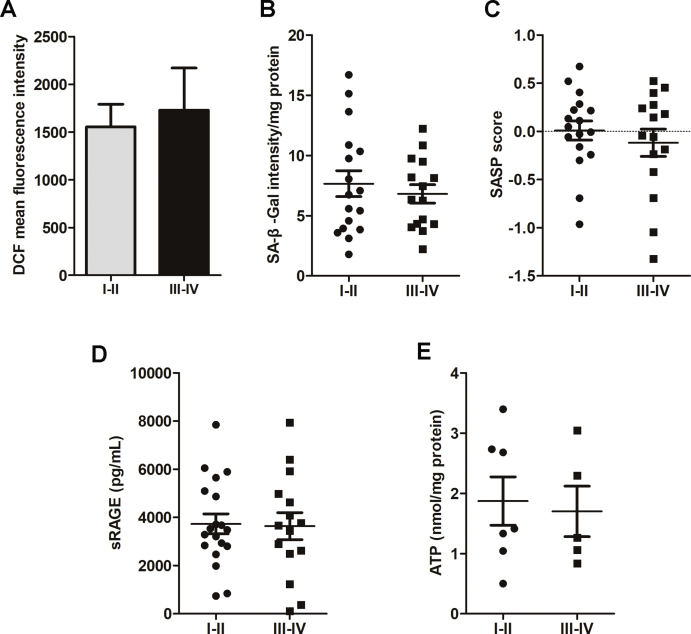
Endometriosis an important cause of female infertility and seriously impact physical and psychological health of patients. Endometriosis is now considered to be a public health problem that deserves in-depth investigation, especially the etiopathogenesis of endometriosis-associated infertility. We aimed to illuminate the etiopathogenesis of endometriosis-associated infertility that involve excessive oxidative stress (OS) induced pathological changes of ovary cumulus granulosa cell (GCs). Senescence-associated β-galactosidase (SA β-gal) activity in GCs from endometriosis patients, soluble isoform of advanced glycation end products receptor (sRAGE) expression in follicular fluid from endometriosis patients and differentially expressed senescence-associated secretory phenotype factors (IL-1β, MMP-9, KGF and FGF basic protein) are all useful indexes to evaluate oocyte retrieval number and mature oocyte number. RNA-sequencing and bioinformatics analysis indicated senescent phenotype of endometriosis GCs and aggravated endoplasmic reticulum (ER) stress in endometriosis GCs. Targeting ER stress significantly alleviated OS-induced GCs senescence as well as mitochondrial membrane potential (MMP) and adenosine triphosphate (ATP) reduction in GCs. Moreover, melatonin administration rescued OS-enhanced ER stress, cellular senescence, and MMP and ATP abnormities of endometriosis GCs in vitro and in vivo. In conclusion, our results indicated excessive reactive oxygen species induces senescence of endometriosis GCs via arouse ER stress, which finally contributes to endometriosis-associated infertility, and melatonin may represent a novel adjuvant therapy strategy for endometriosis-associated infertility.

Keywords: Cumulus granulosa cell; Endometriosis; Endoplasmic reticulum stress; Infertility; Oxidative stress; Senescence.


Conflict of interest statement

Declaration of competing interest The authors declare that they have no conflict of interest.

Figures

Image 1
Graphical abstract
Fig. 1
Fig. 1
GCs from endometriosis patients show excessive oxidative stress and senescence. A. Flow cytometry of intracellular ROS levels using 2′-7′-dichlorodihydrofluorescein (DCF) in control and endometriosis GCs. The colored curves represent six samples from the control (C#1, C#2, C#3) and endometriosis groups (E#1, E#2, E#3). B. Quantitative analysis of intracellular ROS levels via flow cytometry (n = 12 for control GCs, n = 16 for endometriosis GCs); ***P < 0.001, Mann-Whitney U. C. Western blot of indicated proteins in GCs from control and endometriosis patients (n = 6 for control GCs, n = 7 for endometriosis GCs). D. SA β-gal assay of control GCs (top) and endometriosis GCs (bottom) (n = 5 for control GCs, n = 5 for endometriosis GCs). Magnification, 200X. E. SA β-gal quantitative assay results of 30 control GCs and 32 endometriosis GCs. ***P < 0.001, Mann-Whitney U. F. Scatter diagram showing linear regression and significant Pearson correlation of oocyte retrieval number and mature oocyte number with SA β-gal activity in endometriosis GCs based on fluorescence quantitative results (n = 32); the left panel shows the correlation between oocyte retrieval number and SA β-gal activity, the right panel displays the correlation between mature oocyte number and SA β-gal activity; both P < 0.001. G. ELISA of sRAGE in human follicular fluid (n = 38 for controls, n = 34 for endometriosis patients); *P < 0.05, Student's t-test. H. Scatter diagram showing linear regression and significant Pearson correlation of oocyte retrieval number and mature oocyte number with sRAGE in endometriosis FF based on ELISA (n = 34); the left panel shows the correlation between oocyte retrieval number and sRAGE, the right panel displays the correlation between mature oocyte number and sRAGE; both P < 0.001. I. ELISA of IL-1β, MMP-9, KGF and FGF basic protein in FF (n = 30 for controls, n = 32 for endometriosis patients); ***P < 0.001, Mann-Whitney U; **P < 0.01, Student's t-test; **P < 0.01, Mann-Whitney U; **P < 0.01, Mann-Whitney U from left panel to right panel, respectively. J. SASP score was defined as the arithmetic sum of cumulative distribution probability of four differentially expressed SASP factors. Scatter diagram shows linear regression and significant Pearson correlation of SA β-gal activity with SASP score based on ELISA results of four differentially expressed SASP factors (n = 32 for endometriosis patients); P < 0.01. K. Scatter diagram shows linear regression and significant Pearson correlation of oocyte retrieval number and mature oocyte number with SASP score results (n = 32 for endometriosis patients); the left panel shows the correlation between oocyte retrieval number and SASP score, the right panel displays the correlation between mature oocyte number and SASP score; both P < 0.001. L. Western blot of indicated proteins in GCs from control and endometriosis patients (n = 6 for control GCs, n = 7 for endometriosis GCs). GC, granulosa cell; Con, control group; EM, endometriosis group.
Fig. 2
Fig. 2
Decreased mitochondrial transmembrane potential (MMP), reduced ATP levels and increased dysfunction mitochondria ratio in GCs from endometriosis patients. A. JC-1-based immunofluorescence assay of human GCs (n = 3 for control GCs, n = 3 for endometriosis GCs); red represents JC-1 aggregate signal; green represents JC-1 monomer signal; representative image of GCs from one control and one endometriosis patient is shown; original magnification: 200X. B. JC-1-based flow cytometry assay of human GCs (n = 6 for control GCs, n = 9 for endometriosis GCs); images shows typical fluorescence intensity distribution of one control GC (top) and one endometriosis GC (bottom). C. Flow cytometry quantitative assay of MMP ratio (n = 6 for control GCs, n = 9 for endometriosis GCs); ***P < 0.001, Mann-Whitney U. D. Intracellular ATP levels assay in GCs (n = 12 for control GCs, n = 12 for endometriosis GCs); *P < 0.001, Student's t-test. E. Ultrastructure of GCs by transmission electron microscopy; original magnification: ×1000; M, normal mitochondria; AM, abnormal mitochondria; ER, endoplasmic reticulum; N, nucleus. F. Abnormal mitochondria proportion in 6 control GCs and 6 endometriosis GCs; for each GC sample, two individuals counted a total of 200 mitochondria in at least five random sections independently and the rate of abnormal mitochondria was recorded. The abnormal mitochondria ratio in GCs from endometriosis patients was 13.33 ± 3.33, which was significantly higher than control GCs (5.17 ± 2.64); **P < 0.01, Mann-Whitney U. . (For interpretation of the references to color in this figure legend, the reader is referred to the Web version of this article.)
Fig. 3
Fig. 3
Bioinformatic analysis results support oxidative stress-induced senescence of endometriosis GCs that involves increased ER stress. A. Principal component analysis (PCA) of mRNA dataset from 4 control GCs and 5 endometriosis GCs. B. Differentially expressed mRNAs (DEMs) were identified using the gplots package in Bioconductor. Red and green points indicate upregulated and downregulated DEMs, respectively (fold change > 2 and corrected P value < 0.05). C. Heat map of the differentially expressed 411 up-regulated and 284 down-regulated genes. Gene set enrichment analysis (GSEA) was used to explore significantly enriched gene sets comparing the entire gene transcripts in GCs from endometriosis patients and control GCs to gene sets in GSEA Molecular Signatures Database (MsigDB); genes with expression levels closely associated with endometriosis (E) or control (C) group are located at the left or right edge of the list, respectively; Y-axis of enrichment plot, value of the ranking metric; X-axis of enrichment plot, the rank for all genes. Bottom: plot of the ranked list of all genes; the peak score of the enrichment plot represents the enrichment score (ES) for this gene set. D. Genes in endometriosis GCs were significantly enriched in the “cellular response to oxidative stress” gene set. E. Control GCs showed enhanced genes in the antioxidative “glutathione metabolism” pathway. F. GSEA revealed enrichment of endometriosis genes in “regulation of cell aging,” “cell aging,” “cellular senescence” and “SASP.” G. Genes of “endoplasmic reticulum calcium ion homeostasis,” “ER associated ubiquitin dependent protein catabolic process,” “ERAD pathway,” and “IRE1 mediated unfolded protein response” pathways were also enriched in GCs from endometriosis patients. NES, normalized enrichment score; false discovery rate (FDR) of all sets were less than 25%. . (For interpretation of the references to color in this figure legend, the reader is referred to the Web version of this article.)
Fig. 4
Fig. 4
Activated ER stress in GCs from endometriosis patients and anti-aging effects of TUDCA in vitro A. Relative expression of ER stress-associated genes based on RNA sequencing results (n = 4 for control GCs, n = 5 for endometriosis GCs); *P < 0.05, Mann-Whitney U. B. Western blot of ER stress chaperone (GRP78) and UPR activators (p-IRE1 and CHOP) in 6 control GCs and 7 endometriosis GCs. C. Western blot of indicated proteins in KGN (left panel) and COV434 cells (right panel) treated with 100 μM H2O2 for 24 h. D. SA β-gal activity in KGN and COV434 cells in control, H2O2 and TUDCA groups (Con, H2O2 and TUD, respectively). Top panel shows SA β-gal staining of KGN cells and bottom shows staining of COV434 cells. Original magnification, 200X. E. Intracellular ATP levels in KGN and COV434 cells treated with H2O2 or TUDCA; #P < 0.05, H2O2 vs. Con group, one-way ANOVA with LSD for multiple comparisons; $P < 0.05, TUD vs. H2O2 group, one-way ANOVA with LSD for multiple comparisons. F. JC-1-based immunofluorescence of KGN and COV434 cells from control, H2O2 and TUDCA groups. Representative images of each group are shown; original magnification: 200×. G. MMP ratio in KGN and COV434 cells from control, H2O2 and TUDCA groups; #P < 0.05, H2O2 vs. Con group, one-way ANOVA with LSD for multiple comparisons; $P < 0.05, TUD vs. H2O2 group, one-way ANOVA with LSD for multiple comparisons. H. Western blot of indicated proteins in control, H2O2 and TUDCA treated KGN and COV434 cells.
Fig. 5
Fig. 5
Melatonin attenuates oxidative stress-induced senescence via suppressing ER stress in vitro A. SA β-gal activity of KGN and COV434 cells in control, H2O2 and melatonin groups. Original magnification, 200X. B. Intracellular ATP levels in KGN and COV434 cells treated with H2O2 or melatonin; #P < 0.05, H2O2 vs. Con group, one-way ANOVA with LSD for multiple comparisons; $P < 0.05, Mela vs. H2O2 group, one-way ANOVA with LSD for multiple comparisons. C. JC-1-based immunofluorescence assay of KGN and COV434 cells from control, H2O2 and melatonin groups; representative images are shown. Original magnification: 200X. D. MMP ratio in KGN and COV434 cells from control, H2O2 and melatonin groups; #P < 0.05, H2O2 vs. control group, one-way ANOVA with LSD for multiple comparisons; $P < 0.05, Mela vs. H2O2 group, one-way ANOVA with LSD for multiple comparisons. E. Western blot results of indicated proteins in control, H2O2 and melatonin treated KGN and COV434 cells. All experiments were repeated at least three times and results of representative experiments are shown.
Fig. 6
Fig. 6
Melatonin alleviates oxidative stress-induced fertility decline via suppressing ER stress and restoring GC antioxidant function in vivo A. Representative visible endometriosis-like lesions in the peritoneal cavity of endometriosis group mice (EM) and melatonin-pretreated endometriosis mice (EM + Mela) four weeks after surgery. The first panel shows the normal peritoneal cavity of control group mice (Con). B. Scatter plot of lesion volumes from EM and EM + Mela mice (n = 12 for EM, n = 12 for EM + Mela mice); ***P < 0.001, Student's t-test. C. The development of mouse fertility within 6 months of mating. The horizontal axis shows time (days) from mating; the vertical axis indicates average pup number of each delivery (pups/delivery). D. Immunohistochemistry of indicated proteins in mouse ovary granulosa cells from control, endometriosis and melatonin pretreatment groups (Con, EM, EM + Mela, respectively). Each group contained 6 mice. Scale bars = 50 μm; original magnification: 400X; staining was developed using diaminobenzidine and nuclei were stained with hematoxylin. E. Immunohistochemistry H-score of iNOS, SOD1, GRP78, p-IRE1, CHOP, p16, p21 and p-H2AX in ovary granulosa cells from control (Con), 3-nitropropionic acid (3-NAP), endometriosis (EM), control mouse with melatonin (Con + Mela), 3-nitropropionic acid and melatonin combined treatment (3-NAP + Mela) and melatonin treated endometriosis groups (EM + Mela); n = 6 for each group; *P < 0.05, 3-NAP vs. Con; #P < 0.05, EM vs. Con; $P < 0.05, Con + Mela vs. Con; &P < 0.05, 3-NAP + Mela vs. 3-NAP; %P < 0.05, EM + Mela vs. EM; all one-way ANOVA with LSD for multiple comparisons. H-Score of different proteins shown on the vertical axis and six groups indicated on the horizontal axis.
Supplementary figs1
Supplementary figs1
Supplementary figs2
Supplementary figs2
Supplementary figs3
Supplementary figs3

References

    1. Vercellini P., Vigano P., Somigliana E., Fedele L. Endometriosis: pathogenesis and treatment. Nat. Rev. Endocrinol. 2014;10(5):261–275. - PubMed
    1. Dumesic D.A., Meldrum D.R., Katz-Jaffe M.G., Krisher R.L., Schoolcraft W.B. Oocyte environment: follicular fluid and cumulus cells are critical for oocyte health. Fertil. Steril. 2015;103(2):303–316. - PubMed
    1. Da Broi M.G., de Albuquerque F.O., de Andrade A.Z., Cardoso R.L., Jordao Junior A.A., Navarro P.A. Increased concentration of 8-hydroxy-2'-deoxyguanosine in follicular fluid of infertile women with endometriosis. Cell Tissue Res. 2016;366(1):231–242. - PubMed
    1. Da Broi M.G., Jordao A.A., Jr., Ferriani R.A., Navarro P.A. Oocyte oxidative DNA damage may be involved in minimal/mild endometriosis-related infertility. Mol. Reprod. Dev. 2018;85(2):128–136. - PubMed
    1. Albertini D.F., Combelles C.M., Benecchi E., Carabatsos M.J. Cellular basis for paracrine regulation of ovarian follicle development. Reproduction. 2001;121(5):647–653. - PubMed

Publication types

MeSH terms