. 2020 Jan 21;10(2):56.
doi: 10.3390/diagnostics10020056.

Disease-Specific Survival of Type I and Type II Epithelial Ovarian Cancers-Stage Challenges Categorical Assignments of Indolence & Aggressiveness

Affiliations

Disease-Specific Survival of Type I and Type II Epithelial Ovarian Cancers-Stage Challenges Categorical Assignments of Indolence & Aggressiveness

Edward J Pavlik et al. Diagnostics (Basel). .

Abstract

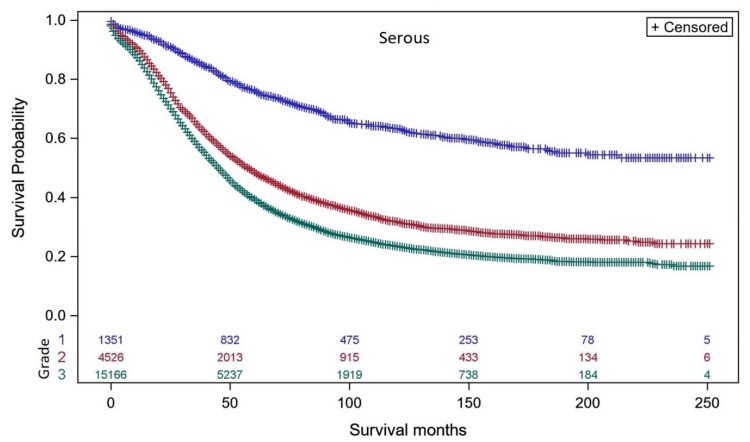
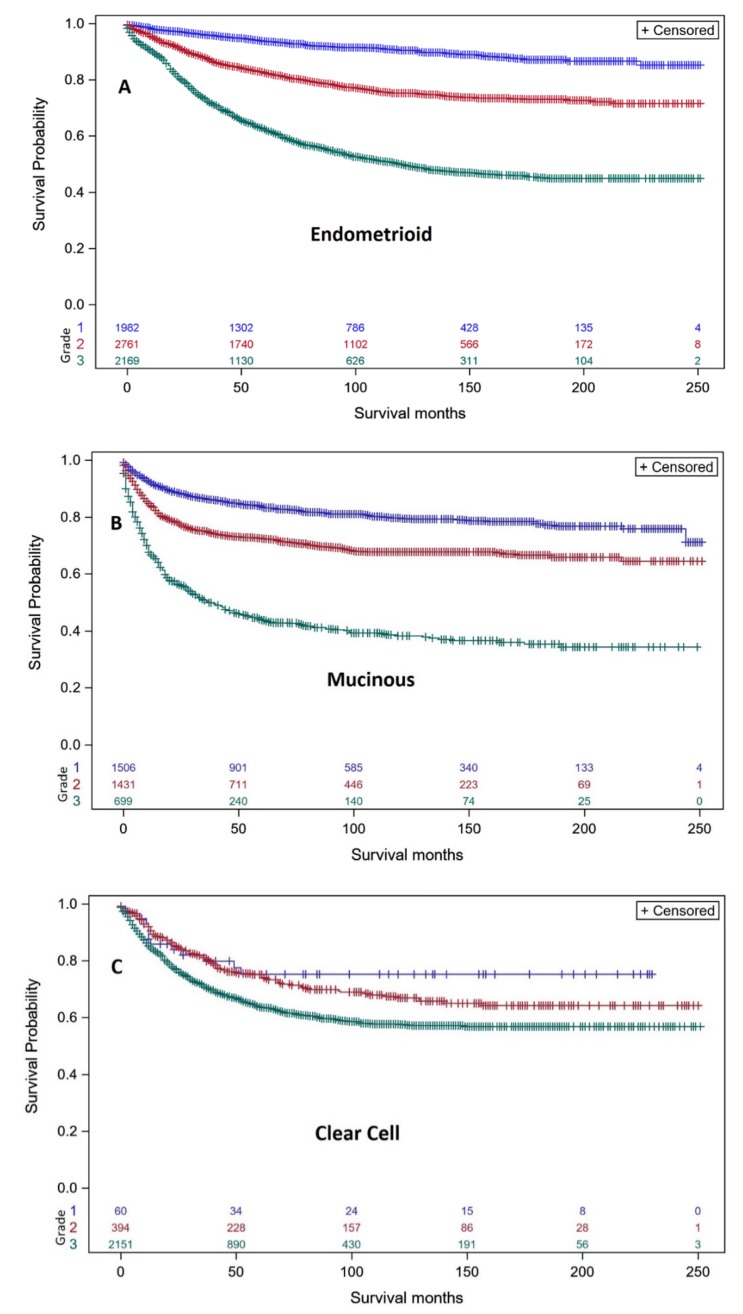
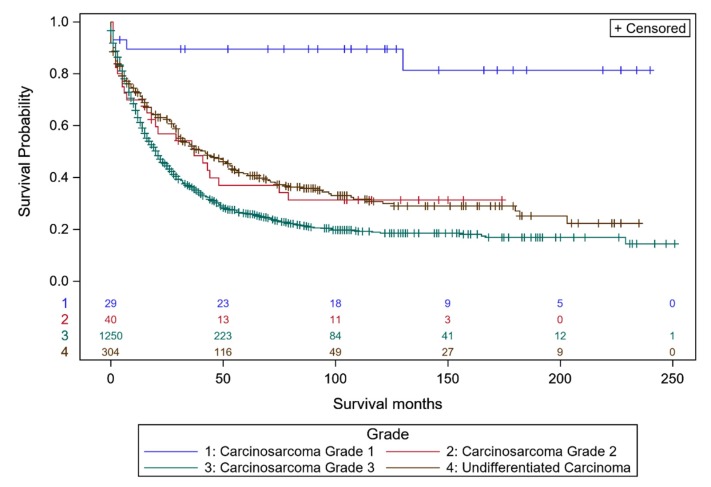
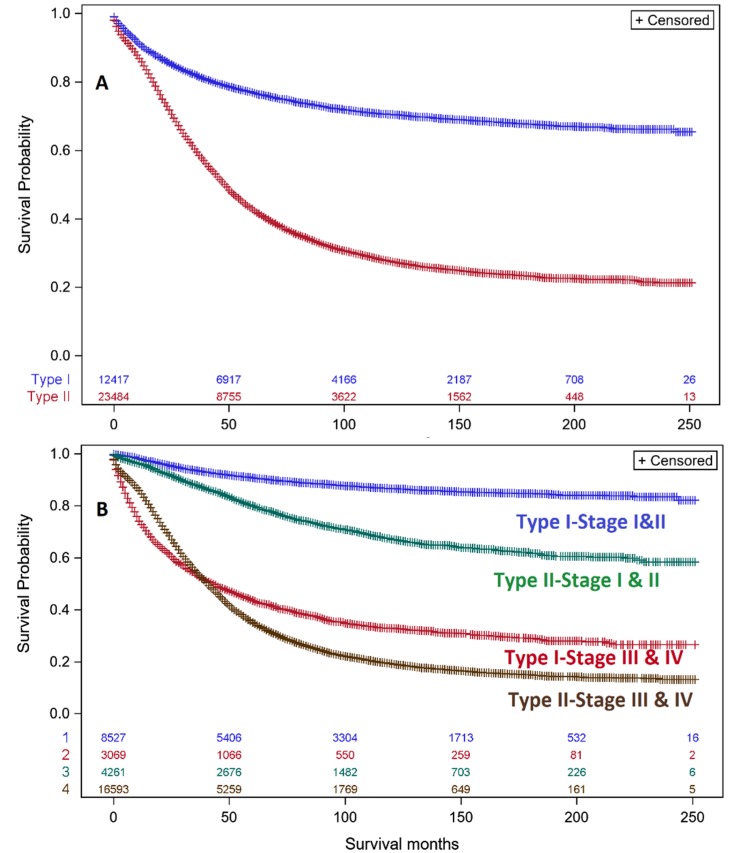
Epithelial ovarian cancers (EOC) consist of several sub-types based on histology, clinical, molecular and epidemiological features that are termed "histo-types", which can be categorized into less aggressive Type I and more aggressive Type II malignancies. This investigation evaluated the disease-specific survival (DSS) of women with Type I and II EOC using histo-type, grade, and stage. A total of 200,658 EOC cases were identified in the National Cancer Institute's Surveillance, Epidemiology, and End Results (SEER) data. Kaplan-Meier survival analyses, one-factor ANOVA and Chi-square analyses were performed on 10-year DSS survivals. DSS strongly supported a 2-tiered classification (grade 1 vs. grade 2 & 3) for serous EOC. DSS of early stage serous EOC for grade 2 was significantly different from grade 3 indicating that a 2-tier classification for serous EOC applied only to late stage. DSS of Type I EOC was much better than Type II. However, DSS was 46-58% lower with late stage Type I than with early stage Type I indicating that Type I ovarian cancers should not be considered indolent. Early stage Type II EOC had much better DSS than late stage Type II stressing that stage has a large role in survival of both Type I and II EOC.

Keywords: Type I & Type II; epithelial ovarian cancer; grade; histo-types; stage; survival.


Conflict of interest statement

Page: 10The authors declare no conflict of interest.

Figures

Figure 1
Figure 1
Kaplan–Meier ovarian cancer-specific survival showing number of women at risk according to grade of serous EOC (8441/3, 8460/3, 8461/3). Women with grade 1 well differentiated serous EOC (blue curve, n = 1,351; 50, 100 & 200-month survival is 80.0%, 66.2%, 55.0%), grade 2 moderately differentiated (red curve, n = 4,526; 50, 100 & 200-month survival is 55.8%, 36.5%, 25.7%), and grade 3 undifferentiated (green curve, n = 15,166; 50, 100 & 200-month survival is 48.3%, 27.7%, 19.0%). The number of women remaining at different survival points is shown for well differentiated screened (blue), moderately differentiated (red), undifferentiated (green) cases. Log-rank test p < 0.001.
Figure 2
Figure 2
Kaplan–Meier ovarian cancer-specific survival showing number of women at risk according to grade of endometrioid EOC, mucinous carcinoma and clear cell EOC. (A). Women with endometrioid EOC (8380/3) that was grade 1 well differentiated (blue curve, n = 1982; 50, 100 & 200-month survival is 94.8%, 91.4%, 86.5%), grade 2 moderately differentiated (red curve, n = 2761; 50, 100 & 200-month survival is 84.3%, 77.1%, 71.7%), and grade 3 undifferentiated (green curve, n = 2169; 50, 100 & 200-month survival is 66.4%, 52.9%, 44.4%). Log-rank test p < 0.001. (B). Women with mucinous EOC (8470/3, 8471/3, 8480/3, 8481/3, 8482/3) that was grade 1 well differentiated (blue curve, n = 1506; 50, 100 & 200-month survival is 84.5%, 80.7%, 76.4%, grade 2 moderately differentiated (red curve, n = 1431; 50, 100 & 200-month survival is 72.1%, 67.7%, 65.8%), and grade 3 undifferentiated (green curve, n = 699; 50, 100 & 200-month survival is 46.5%, 39.7%, 35.2%). Log-rank test p < 0.001. (C). Women with clear cell EOC (8310/3) that was grade 1 well differentiated (blue curve, n = 60; 50, 100 & 200-month survival is 77.4%, 74.7%, 74.7%), grade 2 moderately differentiated (red curve, n = 394; 50, 100 & 200-month survival is 76.2%, 69.0%, 63.3%), and grade 3 undifferentiated (green curve, n = 2151; 50, 100 & 200-month survival is 67.1%, 58.6%, 56.3%). The number of women remaining at different survival points is shown for well differentiated screened (blue), moderately differentiated (red), undifferentiated (green). Log-rank test p < 0.001.
Figure 3
Figure 3
Kaplan–Meier ovarian cancer-specific survival showing number of women at risk according to grade of ovarian carcinosarcoma and undifferentiated carcinoma. Women with ovarian carcinosarcoma (8950/3, 8951/3 & 8980/3) that was grade 1 well differentiated (blue curve, n = 29; 50, 100 & 200-month survival is 89.1.0%, 89.1%, 81.7%), grade 2 moderately differentiated (red curve, n = 40; 50, 100 & 200-month survival is 37.7%, 31.9%, 31.9%), and grade 3 undifferentiated (green curve, n = 1250; 50, 100 & 200-month survival is 31.8%, 21.8%, 18.9%). Log-rank test p < 0.001. Women with undifferentiated EOC (8020/3) that was grade 3 by definition (black curve, n = 304; 50, 100 & 200-month survival is 46.9%, 32.9%, 25.8%).
Figure 4
Figure 4
Kaplan–Meier survival of women with Type I & II EOC. (A). DSS of women with Type I EOC (blue curve, n= 12,417; 50, 100 & 200-month survival is 78.5%, 71.7%, 66.6%). DSS of women with Type II EOC (red curve, n= 23,484; 50, 100, & 200-month survival is 50.6%, 31.7%, 22.9%). p-value obtained by the log rank test. The number of women remaining at different survival points is shown for Type I (blue) and Type II (red) epithelial ovarian cancers. (Type I vs. Type II: p < 0.001). The number of women remaining at different survival points is color-coded for each of the four categories along the x-axis. Vertical lines identify censored data points. (B). DSS of women with Type I & II EOC according to stage. Early stage (I & II) Type I EOC (blue curve, n= 8,527; 50, 100 & 200-month survival is 91.9%, 87.7%, 84.9%). Early stage (I & II) Type II EOC (green curve, n= 4,261; 50, 100 & 200-month survival is 83.9%, 71.0%, 60.3%). Late stage (III & IV) Type I EOC (red curve, n= 3,069; 50, 100 & 200-month survival is 47.9%, 35.3%, 28.1%). Late stage (III & IV) Type II EOC (brown curve, n= 16,593; 50, 100 & 200-month survival is 44.2%, 23.4%, 15.2%) (Type I vs. Type II: p < 0.001). p-value obtained by the log rank test. The number of women remaining at different survival points is color-coded for each of the four categories along the x-axis. Vertical lines identify censored data points.

References

    1. Siegel R.L., Miller K.D., Jemal A. Cancer statistics, 2020. CA A Cancer J. Clin. 2020;70:7–30. doi: 10.3322/caac.21590. - DOI - PubMed
    1. Howlader N., Noone A.M., Krapcho M., Garshell J., Miller D., Altekruse S.F., Kosary C.L., Yu M., Ruhl J., Tatalovich Z., et al. Seer Cancer Statistics Review. National Cancer Institute; Bethesda, MD, USA: 2015. [(accessed on 20 December 2019)]. pp. 1975–2016. Available online: https://seer.cancer.gov/csr/1975_2016/
    1. Torre L.A., Trabert B., DeSantis C.E., Miller K.D., Samimi G., Runowicz C.D., Gaudet M.M., Jemal A., Siegel R.L. Ovarian cancer statistics. CA A Cancer J. Clin. 2018;68:284–296. doi: 10.3322/caac.21456. - DOI - PMC - PubMed
    1. Goodman M.T., Yurii B., Shvetsov Y.B. Incidence of Ovarian, peritoneal, and fallopian tube carcinomas in the United States, 1995–2004. Cancer Epidemiol. Biomark. Prev. 2009;18:132–139. doi: 10.1158/1055-9965.EPI-08-0771. - DOI - PMC - PubMed
    1. Pavlik E.J., van Nagell J.R., Jr. Early detection of ovarian tumors using ultrasound. Womens Health Lond. 2013;9:39–55. doi: 10.2217/WHE.12.62. - DOI - PubMed

LinkOut - more resources