

Aging and Caloric Restriction Modulate the DNA Methylation Profile of the Ribosomal RNA Locus in Human and Rat Liver
- PMID: 31973116
- PMCID: PMC7070571
- DOI: 10.3390/nu12020277
Aging and Caloric Restriction Modulate the DNA Methylation Profile of the Ribosomal RNA Locus in Human and Rat Liver
Abstract
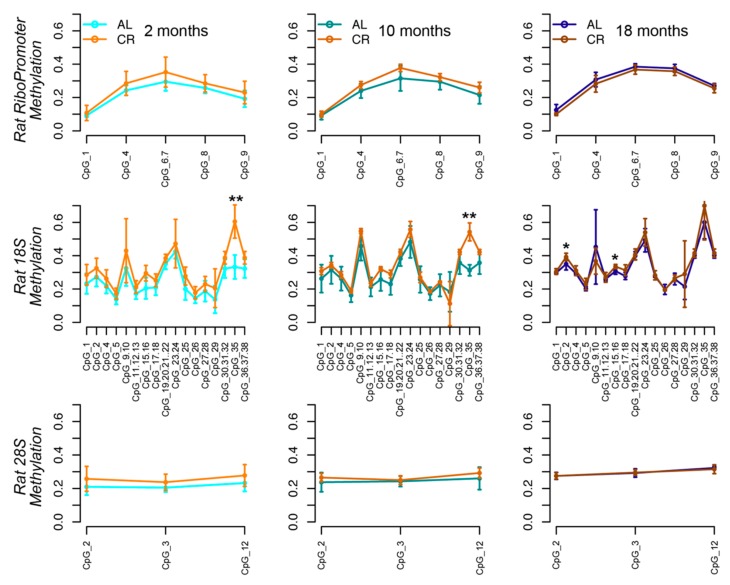
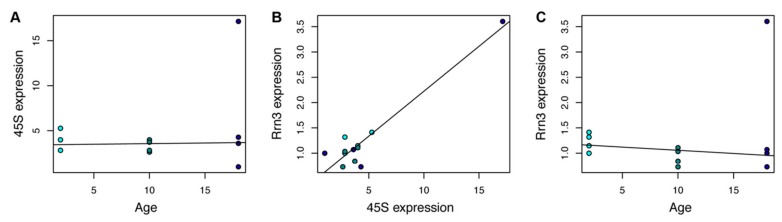
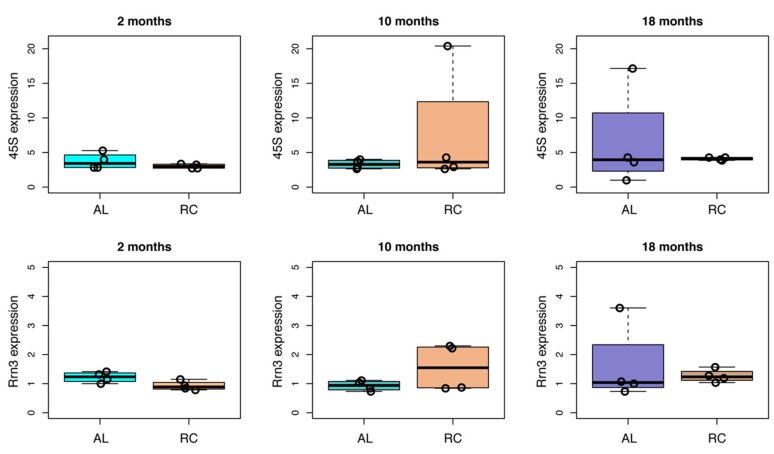
A growing amount of evidence suggests that the downregulation of protein synthesis is an adaptive response during physiological aging, which positively contributes to longevity and can be modulated by nutritional interventions like caloric restriction (CR). The expression of ribosomal RNA (rRNA) is one of the main determinants of translational rate, and epigenetic modifications finely contribute to its regulation. Previous reports suggest that hypermethylation of ribosomal DNA (rDNA) locus occurs with aging, although with some species- and tissue- specificity. In the present study, we experimentally measured DNA methylation of three regions (the promoter, the 5' of the 18S and the 5' of 28S sequences) in the rDNA locus in liver tissues from rats at two, four, 10, and 18 months. We confirm previous findings, showing age-related hypermethylation, and describe, for the first time, that this gain in methylation also occurs in human hepatocytes. Furthermore, we show that age-related hypermethylation is enhanced in livers of rat upon CR at two and 10 months, and that at two months a trend towards the reduction of rRNA expression occurs. Collectively, our results suggest that CR modulates age-related regulation of methylation at the rDNA locus, thus providing an epigenetic readout of the pro-longevity effects of CR.
Keywords: DNA methylation; aging; caloric restriction; liver; ribosomal RNA.
Conflict of interest statement
The authors declare no conflict of interest.
Figures


Similar articles
-
Methylation of the ribosomal RNA gene promoter is associated with aging and age-related decline.Aging Cell. 2017 Oct;16(5):966-975. doi: 10.1111/acel.12603. Epub 2017 Jun 17. Aging Cell. 2017. PMID: 28625020 Free PMC article.
-
Caloric restriction mitigates age-associated hippocampal differential CG and non-CG methylation.Neurobiol Aging. 2018 Jul;67:53-66. doi: 10.1016/j.neurobiolaging.2018.03.009. Epub 2018 Mar 16. Neurobiol Aging. 2018. PMID: 29631215 Free PMC article.
-
Angiogenin stimulates ribosomal RNA transcription by epigenetic activation of the ribosomal DNA promoter.J Cell Physiol. 2014 Apr;229(4):521-9. doi: 10.1002/jcp.24477. J Cell Physiol. 2014. PMID: 24122807 Free PMC article.
-
Aging and nutrition induce tissue-specific changes on global DNA methylation status in rats.Mech Ageing Dev. 2018 Sep;174:47-54. doi: 10.1016/j.mad.2018.02.001. Epub 2018 Feb 7. Mech Ageing Dev. 2018. PMID: 29427568 Review.
-
The role of ribosomal DNA methylation in embryonic development, aging and diseases.Epigenetics Chromatin. 2024 Jul 31;17(1):23. doi: 10.1186/s13072-024-00548-4. Epigenetics Chromatin. 2024. PMID: 39085958 Free PMC article. Review.
Cited by
-
Caloric restriction induced epigenetic effects on aging.Front Cell Dev Biol. 2023 Jan 13;10:1079920. doi: 10.3389/fcell.2022.1079920. eCollection 2022. Front Cell Dev Biol. 2023. PMID: 36712965 Free PMC article. Review.
-
Environmental Exposures around Conception: Developmental Pathways Leading to Lifetime Disease Risk.Int J Environ Res Public Health. 2021 Sep 6;18(17):9380. doi: 10.3390/ijerph18179380. Int J Environ Res Public Health. 2021. PMID: 34501969 Free PMC article. Review.
-
Detection of DNA methylation from buccal swabs using nanopore sequencing to study stunting.Epigenetics. 2024 Dec;19(1):2418717. doi: 10.1080/15592294.2024.2418717. Epub 2024 Nov 3. Epigenetics. 2024. PMID: 39491969 Free PMC article.
-
Whole Genome DNA Methylation Variations in Mammary Gland Tissues from Holstein Cattle Producing Milk with Various Fat and Protein Contents.Genes (Basel). 2021 Oct 28;12(11):1727. doi: 10.3390/genes12111727. Genes (Basel). 2021. PMID: 34828333 Free PMC article.
-
Dietary Restriction and Rapamycin Affect Brain Aging in Mice by Attenuating Age-Related DNA Methylation Changes.Genes (Basel). 2022 Apr 15;13(4):699. doi: 10.3390/genes13040699. Genes (Basel). 2022. PMID: 35456505 Free PMC article.
References
-
- Wang Z., Ying Z., Bosy-Westphal A., Zhang J., Schautz B., Later W., Heymsfield S.B., Müller M.J. Specific metabolic rates of major organs and tissues across adulthood: Evaluation by mechanistic model of resting energy expenditure1234. Am. J. Clin. Nutr. 2010;92:1369–1377. doi: 10.3945/ajcn.2010.29885. - DOI - PMC - PubMed
-
- Cevenini E., Caruso C., Candore G., Capri M., Nuzzo D., Duro G., Rizzo C., Colonna-Romano G., Lio D., Di Carlo D., et al. Age-related inflammation: The contribution of different organs, tissues and systems. How to face it for therapeutic approaches. Curr. Pharm. Des. 2010;16:609–618. doi: 10.2174/138161210790883840. - DOI - PubMed
MeSH terms
Substances
Grants and funding
LinkOut - more resources
Full Text Sources
Medical
