. 2020 Jan 21;9(2):74.
doi: 10.3390/pathogens9020074.

Aggregatibacter actinomycetemcomitans LtxA Hijacks Endocytic Trafficking Pathways in Human Lymphocytes

Affiliations

Aggregatibacter actinomycetemcomitans LtxA Hijacks Endocytic Trafficking Pathways in Human Lymphocytes

Edward T Lally et al. Pathogens. .

Abstract

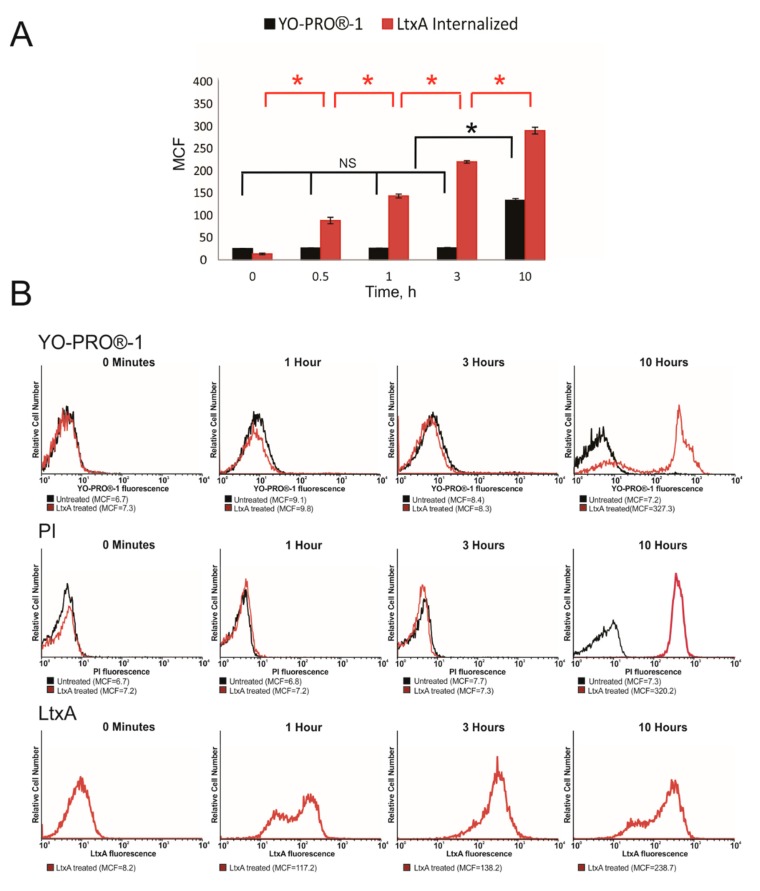
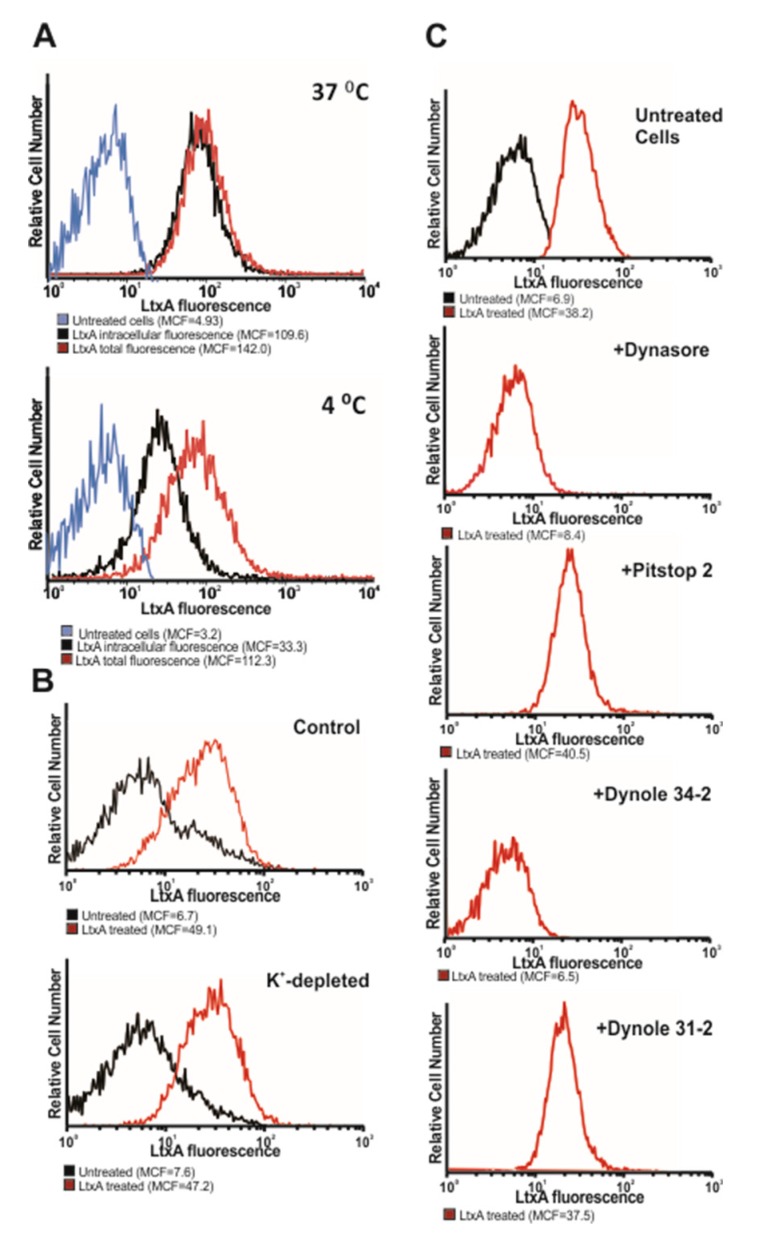
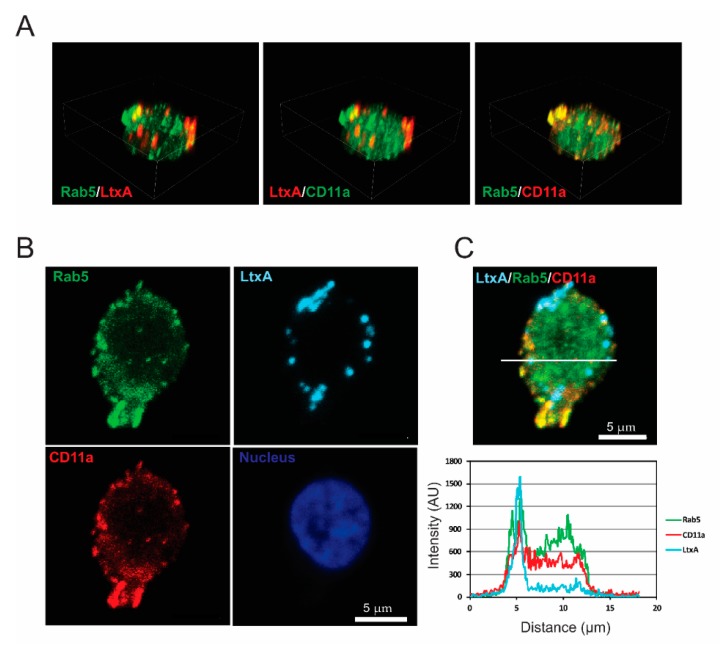
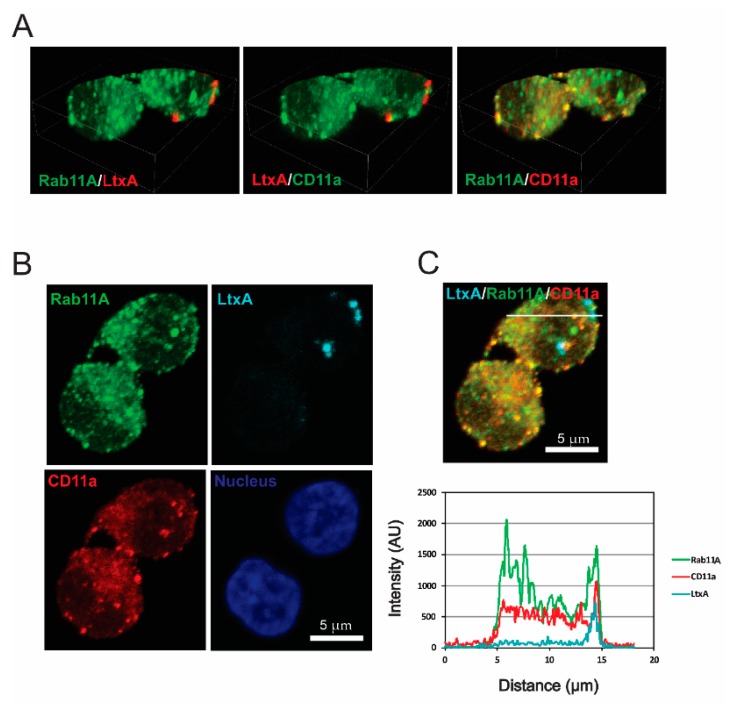
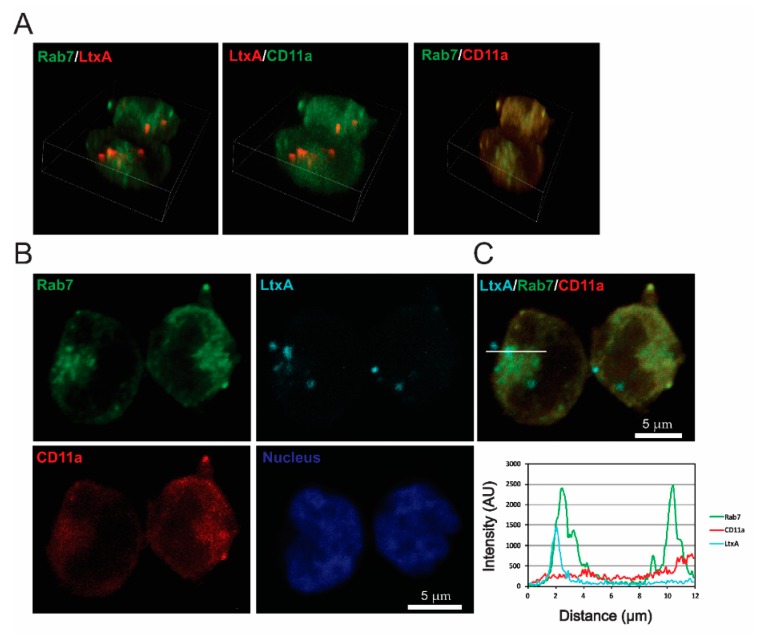
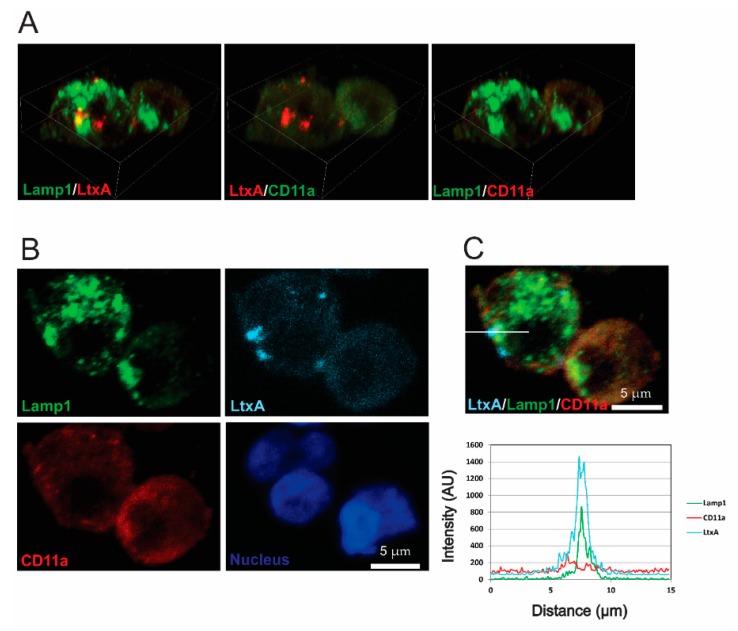
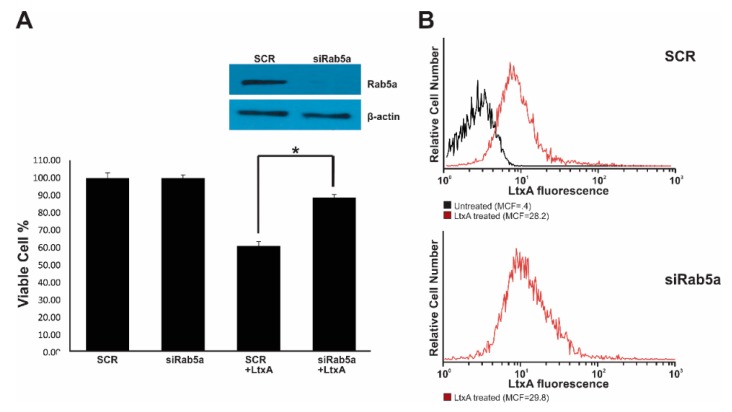
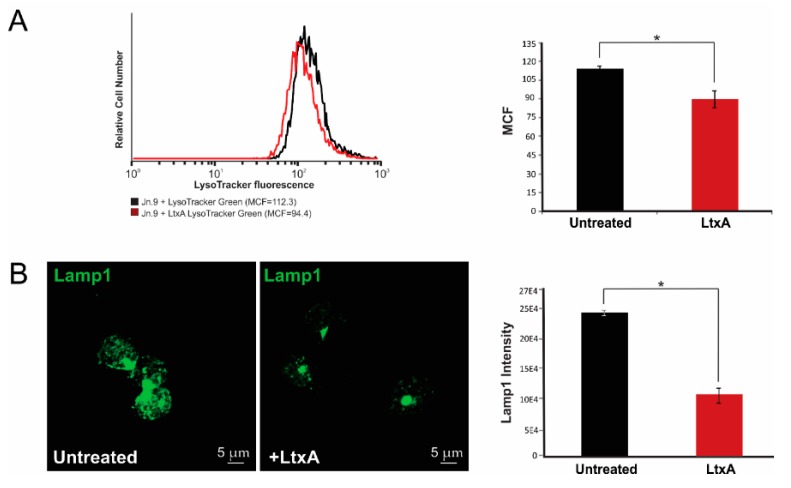
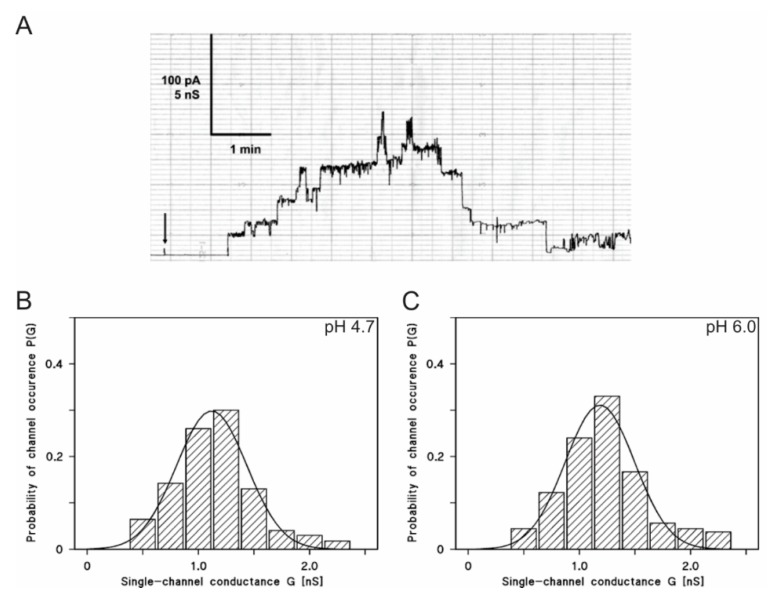
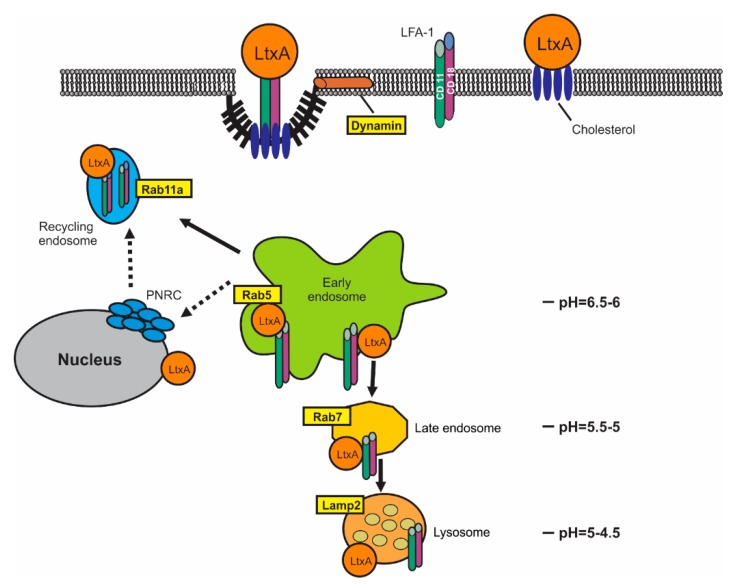
Leukotoxin (LtxA), from oral pathogen Aggregatibacter actinomycetemcomitans, is a secreted membrane-damaging protein. LtxA is internalized by β2 integrin LFA-1 (CD11a/CD18)-expressing leukocytes and ultimately causes cell death; however, toxin localization in the host cell is poorly understood and these studies fill this void. We investigated LtxA trafficking using multi-fluor confocal imaging, flow cytometry and Rab5a knockdown in human T lymphocyte Jurkat cells. Planar lipid bilayers were used to characterize LtxA pore-forming activity at different pHs. Our results demonstrate that the LtxA/LFA-1 complex gains access to the cytosol of Jurkat cells without evidence of plasma membrane damage, utilizing dynamin-dependent and presumably clathrin-independent mechanisms. Upon internalization, LtxA follows the LFA-1 endocytic trafficking pathways, as identified by co-localization experiments with endosomal and lysosomal markers (Rab5, Rab11A, Rab7, and Lamp1) and CD11a. Knockdown of Rab5a resulted in the loss of susceptibility of Jurkat cells to LtxA cytotoxicity, suggesting that late events of LtxA endocytic trafficking are required for toxicity. Toxin trafficking via the degradative endocytic pathway may culminate in the delivery of the protein to lysosomes or its accumulation in Rab11A-dependent recycling endosomes. The ability of LtxA to form pores at acidic pH may result in permeabilization of the endosomal and lysosomal membranes.

Keywords: Aggregatibacter actinomycetemcomitans; LFA-1; RTX toxin; leukotoxin (LtxA), endocytosis; localized aggressive periodontitis.


Conflict of interest statement

The authors declare no conflict of interest.

Figures

Figure 1
Figure 1
Damage to the plasma membrane in Jn.9 cells by LtxA. Flow cytometry analysis was used to detect YO-PRO®-1, PI and LtxA internalization with Jn.9 cells over time. Cells (1 × 10⁶) were incubated with 0.1 µM YO-PRO®-1/ 1.5 µM PI alone or after treatment with 20 nM LtxA at indicated times at 37 °C. Another set of cells was treated with 20 nM LtxA-DY488 at different times. The extracellular fluorescence of the cells was quenched with 0.025% trypan blue [23] and the intracellular fluorescence was determined. (A). Uptake of YO-PRO®-1 (black) and internalization of LtxA-DY488 (red) at various times, presented as mean channel fluorescence (MCF). The data shown are the results of three independent experiments. Error bars indicate ± SEM, * p ≤ 0.05. (B). Top and Middle: Flow cytometry histograms showing YO-PRO®-1 and PI dyes uptake by LtxA-treated cells (red line) vs. the dyes uptake by untreated Jn.9 cells (black line) at different times. Bottom: Flow cytometry histograms showing LtxA-DY488 internalized with Jn.9 cells. The data shown are representative of three independent experiments.
Figure 2
Figure 2
Effect of endocytosis inhibitors on LtxA internalization. (A). Flow cytometry analysis of LtxA internalization with Jn.9 cells at different temperatures. The cells were treated with LtxA-DY488 for 30 min on ice or 37 °C. In a set of cells, the total cell-associated fluorescence was measured by flow cytometry analysis (shown in red). In another set of cells, the extracellular fluorescence was quenched (0.025% trypan blue) [42] and intracellular fluorescence (red peak) was determined by flow cytometry analysis. (B). Flow cytometry analysis of LtxA internalization with Jn.9 cells in K+-free buffer. Jn.9 cells (1 × 10⁶) were incubated in K+-containing (top) or K+-free buffer (bottom), and then 20 nM LtxA-DY488 was added for 30 min. Flow cytometry analysis to determine the amount of internalized toxin (red peak) was performed as described in Figure 2A. (C). Flow cytometry analysis of LtxA-DY488 internalization with Jn.9 cells pretreated with chemical inhibitors. Jn.9 cells (1 × 10⁶) were preincubated with 5–10 µM endocytosis inhibitors for 20 min in serum free medium, and then were treated with 20 nM LtxA-DY488 for 30 min at 37 °C. The extracellular fluorescence was quenched 0.025% trypan blue, and intracellular fluorescence (red peak) was determined by flow cytometry analysis.
Figure 3
Figure 3
LtxA localization in early endosomes of Jn.9 cells. The cells were treated with 20 nM LtxA for 30 min at 37 °C. (A). 3D confocal images showing the distribution of LtxA, CD11a and Rab5. LtxA is pseudo colored in red and CD11a is in red or green (pseudo colored), as indicated on images. The 3D images were reconstructed from seventeen confocal planes using Nikon Elements AR 4.30.01 software. Bounding box dimensions are: width 14.19 µm; height 17.30 µm; depth 5.20 µm. (B). Localization of LtxA-DY650 is shown in cyan, CD11a recognized with mouse Alexa Fluor™ 594 clone HI111 is shown in red, and Rab5, recognized by rabbit anti-Rab5 antibody followed by staining with anti-rabbit IgG Alexa Fluor®488, is shown in green. The nucleus was stained with Hoechst dye and is shown in blue. (C). Top: Merged image “B” showing colocalization of LtxA DY650 (cyan), CD11a (red) and Rab5 (green). Bottom: Intensity profiles for LtxADY650 (cyan), CD11a (red) and Rab5 (green) across the line depicted in the image above. The degree of overlap in the LtxA-containing area was estimated with the Pearson’s correlation coefficient in the LtxA-containing area of 0.78 for LtxA and Rab5, 0.68 for LtxA and CD11a, and of 0.88 for CD11a and Rab5. Representative cells are shown. Additional data are shown in Figure S5.
Figure 4
Figure 4
LtxA localization in Rab11A-positive endosomes of Jn.9 cells. The cells were treated with 20 nM LtxA for 30 min at 37 °C. (A). 3D confocal images showing the distribution of LtxA, CD11a and Rab11A. LtxA is pseudo colored in red and CD11a is in red or green (pseudo colored), as indicated on images. The 3D images were reconstructed from seventeen confocal planes using Nikon Elements AR 4.30.01 software. Bounding box dimensions are: width 22.58 µm; height 16.47 µm; depth 5.20 µm. (B). Localization of LtxA-DY650 is shown in cyan, CD11a recognized with mouse Alexa Fluor™ 594 clone HI111 is shown in red, and Rab11A, recognized by rabbit anti-Rab11A antibody followed by staining with anti-rabbit IgG Alexa Fluor®488, is shown in green. The nucleus was stained with Hoechst dye and is shown in blue. (C). Top: Merged image “B” showing co-localization of LtxA DY650 (cyan), CD11a (red) and Rab11A (green). Bottom: Intensity profiles for LtxADY650 (cyan), CD11a (red) and Rab11A (green) across the line depicted in the image above. The degree of overlap in the LtxA-containing area was estimated with the Pearson’s correlation coefficient of 0.75 for LtxA and Rab11A, 0.72 for LtxA and CD11a, and of 0.76 for CD11a and Rab11A. Representative cells are shown. Additional data are shown in Figure S6.
Figure 5
Figure 5
LtxA localization in Rab7-positive endosomes of Jn.9 cells. The cells were treated with 20 nM LtxA for 1 h at 37 °C. (A). 3D confocal images showing the distribution of LtxA, CD11a and Rab7. LtxA is pseudo colored in red and CD11a is in red or green (pseudo colored), as indicated on images. The 3D images were reconstructed from seventeen confocal planes using Nikon Elements AR 4.30.01 software. Bounding box dimensions are: width 22.17 µm; height 19.37 µm; depth 5.20 µm. (B). Localization of LtxA-DY650 is shown in cyan, CD11a recognized with mouse Alexa Fluor™ 594 clone HI111 is shown in red, and Rab7, recognized by rabbit anti-Rab7 antibody followed by staining with anti-rabbit IgG Alexa Fluor®488, is shown in green. The nucleus was stained with Hoechst dye and is shown in blue. (C). Top: Merged image “B” showing colocalization of LtxA DY650 (cyan), CD11a (red) and Rab7 (green). Bottom: Intensity profiles for LtxADY650 (cyan), CD11a (red) and Rab7 (green) across the line depicted in the image above. The degree of overlap in the LtxA-containing area was estimated with the Pearson’s correlation coefficient of 0.88 for LtxA and Rab7, 0.03 for LtxA and CD11a, and of 0.13 for CD11a and Rab7. Representative cells are shown. Additional data are shown in Supplementary data Figure S8.
Figure 6
Figure 6
LtxA localization in lysosomes of Jn.9 cells. The cells were treated with 20 nM LtxA for 2 h at 37 °C. (A). 3D confocal images showing the distribution of LtxA, CD11a and Lamp1. LtxA is pseudo colored in red and CD11a is in red or green (pseudo colored), as indicated on images. The 3D images were reconstructed from seventeen confocal planes using Nikon Elements AR 4.30.01 software. Bounding box dimensions are: width 25.17 µm; height 19.37 µm; depth 5.20 µm. (B). Localization of LtxA-DY650 is shown in cyan, CD11a recognized with mouse Alexa Fluor™ 594 clone HI111 is shown in red, and Lamp1, recognized by rabbit anti-Lamp1 antibody followed by staining with anti-rabbit IgG Alexa Fluor®488, is shown in green. The nucleus was stained with Hoechst dye and is shown in blue. (C). Top: Merged image “B” showing colocalization of LtxA DY650 (cyan), CD11a (red) and Lamp1 (green). Bottom: Intensity profiles for LtxADY650 (cyan), CD11a (red) and Lamp1 (green) across the line depicted in the image above. The degree of overlap in the LtxA-containing area was estimated with the Pearson’s correlation coefficient of 0.72 for LtxA and Lamp1, 0.15 for LtxA and CD11a, and of 0.11 for CD11a and Lamp1. Representative cells are shown. Additional data are shown in Supplementary data Figure S9.
Figure 7
Figure 7
Modulation of Rab5a function in Jn.9 cells. A. Jn.9 cells (1 × 10⁶ cells) were transfected with siRNA control (SCR) or with siRNA against Rab5a and collected 24 h post-transfection for Rab5a expression analysis by Western blotting. The cell viability testing was performed by trypan blue assay after 18 h of treatment with 20 nM LtxA. (A). representative expression of Rab5a protein was shown for 24 h of siRNA treatment. The Rab5a protein expression (inset) was analyzed in extracts obtained from 1 × 10⁶ Jn.9 cells by Western blot, β-actin served as a loading control. Error bars indicate ±SEM, * p ≤ 0.05 compared with siRNA SCR-treated cells. The experiment was performed three independent times. (B). Jn.9 cells (1 × 10⁶ cells) were transfected with siRNA control (SCR) or with siRNA against Rab5a, then were collected 24 h post-transfection and treated with 20 nM LtxA-DY488 for 30 min at 37 °C. The extracellular fluorescence of the cells was quenched (0.025% trypan blue) [42,45] and intracellular cell fluorescence (red peak) was determined by flow cytometry analysis. No residual fluorescence was detected in 0.1% Triton X-100 permeabilized cells after the trypan blue treatment. Untreated cells (black) served as a negative control. Representative flow cytometry histograms are shown.
Figure 8
Figure 8
Lysosomal damage by LtxA. Jn.9 cells (1 × 10⁶) were incubated in presence or absence of 20 nM LtxA for 2 h at 37 °C. (A). LtxA-treated and untreated cells were stained with 100 nM LysoTracker® Green DND-26 for 15 min at 37 °C. The LysoTracker® Green DND-26 intensity was evaluated by flow cytometry analysis. Representative flow cytometry histograms are shown on the left. The fluorescence of LtxA treated cells is shown in red, and untreated cells in black. The mean channel fluorescence (MCF) of LysoTracker® Green DND-26 in LtxA-treated vs. untreated cells is presented on the right. (B). Average fluorescence intensity of Lamp1 staining in Jn.9 cells was evaluated by confocal microscopy. The intensities of Lamp1 staining in 39 LtxA-treated cells and 44 untreated were analyzed and shown on the right. Error bars indicate ± SEM of three independent experiments. * p ≤ 0.05.
Figure 9
Figure 9
Pore-forming activity of LtxA in asolectin/n-decane membranes at different pH values. (A). Single-channel recording of LtxA in an asolectin/n-decane membrane at pH 4.7. Current recording of an asolectin/n-decane membrane, performed in the presence of 10 nM LtxA added to the cis-side of the membrane. The aqueous phase contained 1 M KCl, 10 mM MES-KOH, pH 4.7. The applied membrane potential was 20 mV at the cis-side (indicated by an arrow), at 20 °C. (B). Histogram of the probability P (G) of an occurrence of a given conductivity unit observed for LtxA with membranes formed of 1% asolectin dissolved in n-decane in a salt solution at pH 4.7. The histogram was calculated by dividing the number of fluctuations with a given conductance unit by the total number of conductance fluctuations. The average conductance was 1.1 ± 0.31 nS for 47 conductance steps derived from nine individual membranes. The value was calculated from a Gaussian distribution of all conductance fluctuations (solid line). The aqueous phase contained 1 M KCl, 10 mM MES-KOH, pH 4.7 and 10 nM LtxA; the applied membrane potential was 20 mV at 20 °C. (C). Histogram of the probability P(G) for the occurrence of a given conductivity unit observed for LtxA with membranes formed of 1% asolectin dissolved in n-decane in a salt solution at pH 6.0. The average conductance was 1.20 ± 0.31 nS for 95 conductance steps derived from 17 individual membranes. The aqueous phase contained 1 M KCl, 10 mM MES, pH 6.0 and about 10 nM LtxA; the applied membrane potential was 20 mV at 20 °C.
Figure 10
Figure 10
Proposed mechanism of LtxA entry and trafficking in human lymphocytes. LtxA binds to cholesterol and LFA-1 on the surface of Jn.9 cell. LtxA/LFA-1 complex internalization is dynamin-dependent. Internalized LtxA/LFA-1 complexes are quickly transported to early endosomes. The small GTPase Rab5 regulates membrane binding and fusion in the early endocytic pathway. The interruption of Rab5 expression in Jn.9 cells results in the abolishment of the LtxA activity. LFA-1 undergoes endocytic recycling through the long-Rab11A-dependent pathway with a transitional step at PNRC [29]. While some LtxA follows LFA-1 in its recycling turnover, a portion of LtxA is separated from LFA-1 and the toxin proceeds to late endosomes and lysosomes. The ability of LtxA to damage lipid membranes at a low pH may cause endocytic vesicles and lysosomal rupture and release of the toxin to the cytosol.

Similar articles

Cited by

References

    1. Linhartova I., Bumba L., Masin J., Basler M., Osicka R., Kamanova J., Prochazkova K., Adkins I., Hejnova-Holubova J., Sadilkova L., et al. RTX proteins: a highly diverse family secreted by a common mechanism. FEMS Microbiol. Rev. 2010;34:1076–1112. doi: 10.1111/j.1574-6976.2010.00231.x. - DOI - PMC - PubMed
    1. Goni F.M., Ostolaza H.E. coli alpha-hemolysin: a membrane-active protein toxin. Braz. J. Med. Biol. Res. 1998;31:1019–1034. doi: 10.1590/S0100-879X1998000800002. - DOI - PubMed
    1. Ostolaza H., Soloaga A., Goni F.M. The binding of divalent cations to Escherichia coli alpha-haemolysin. Eur. J. Biochem. 1995;228:39–44. doi: 10.1111/j.1432-1033.1995.tb20225.x. - DOI - PubMed
    1. Soloaga A., Veiga M.P., Garcia-Segura L.M., Ostolaza H., Brasseur R., Goni F.M. Insertion of Escherichia coli alpha-haemolysin in lipid bilayers as a non-transmembrane integral protein: prediction and experiment. Mol. Microbiol. 1999;31:1013–1024. doi: 10.1046/j.1365-2958.1999.01225.x. - DOI - PubMed
    1. Boehm D.F., Welch R.A., Snyder I.S. Domains of Escherichia coli hemolysin (HlyA) involved in binding of calcium and erythrocyte membranes. Infect. Immun. 1990;58:1959–1964. doi: 10.1128/IAI.58.6.1959-1964.1990. - DOI - PMC - PubMed

LinkOut - more resources