. 2020 Jan 21;9(2):267.
doi: 10.3390/cells9020267.

Q-Cell Glioblastoma Resource: Proteomics Analysis Reveals Unique Cell-States are Maintained in 3D Culture

Affiliations

Q-Cell Glioblastoma Resource: Proteomics Analysis Reveals Unique Cell-States are Maintained in 3D Culture

Rochelle C J D'Souza et al. Cells. .

Abstract

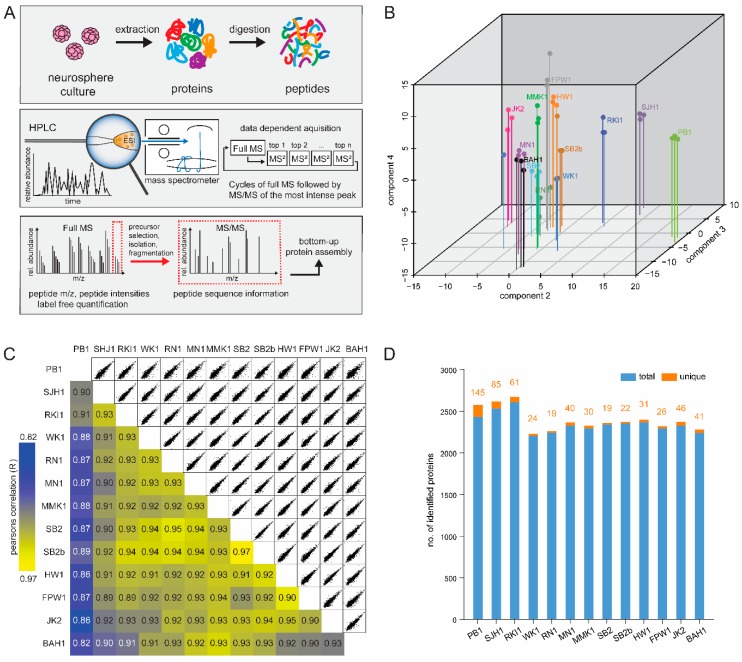
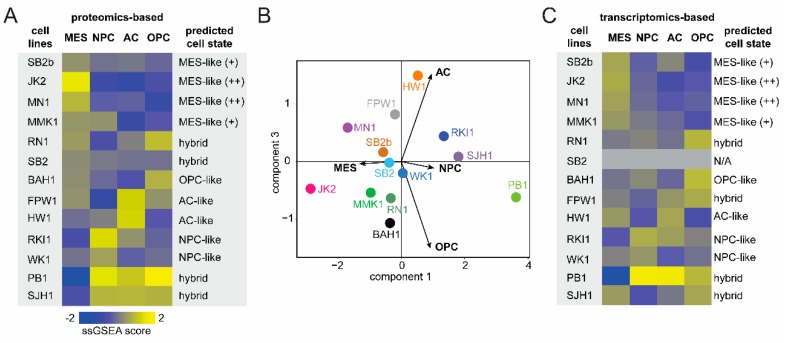
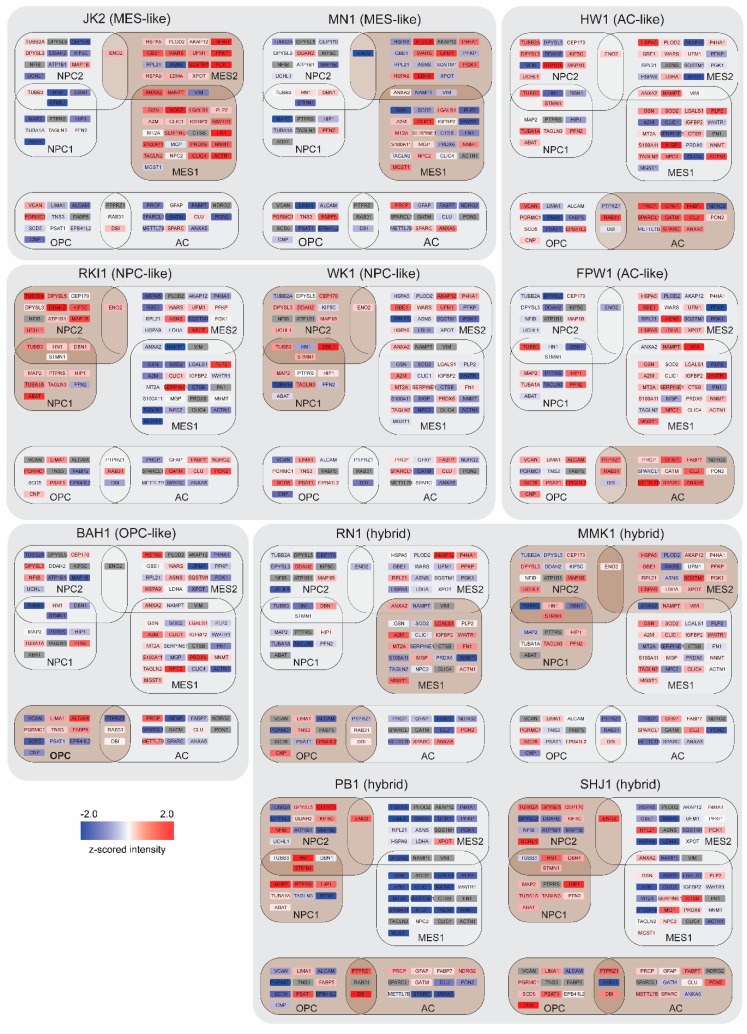
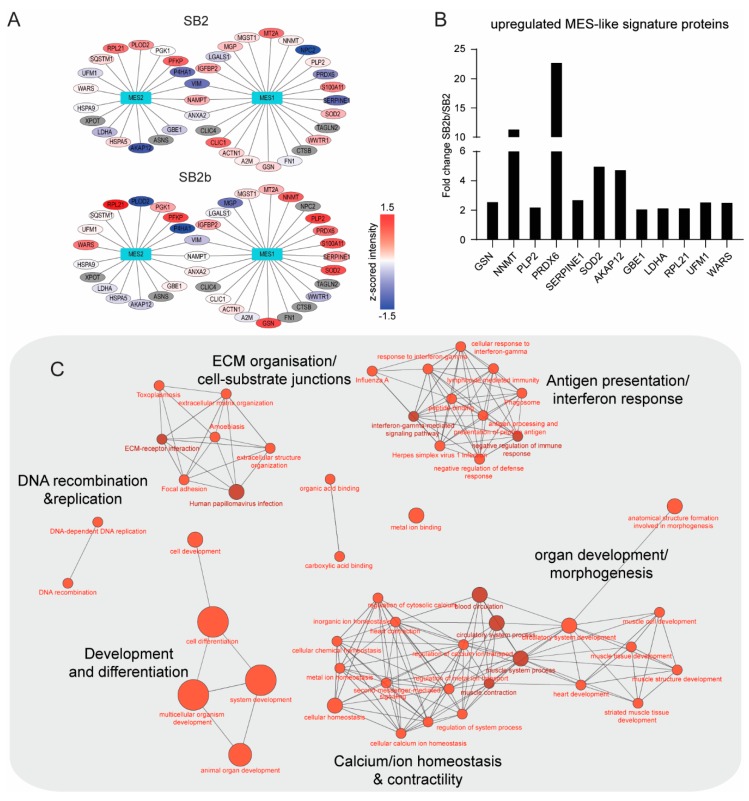
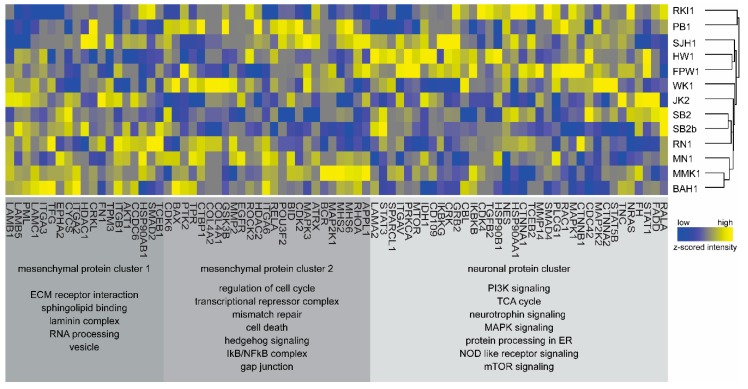
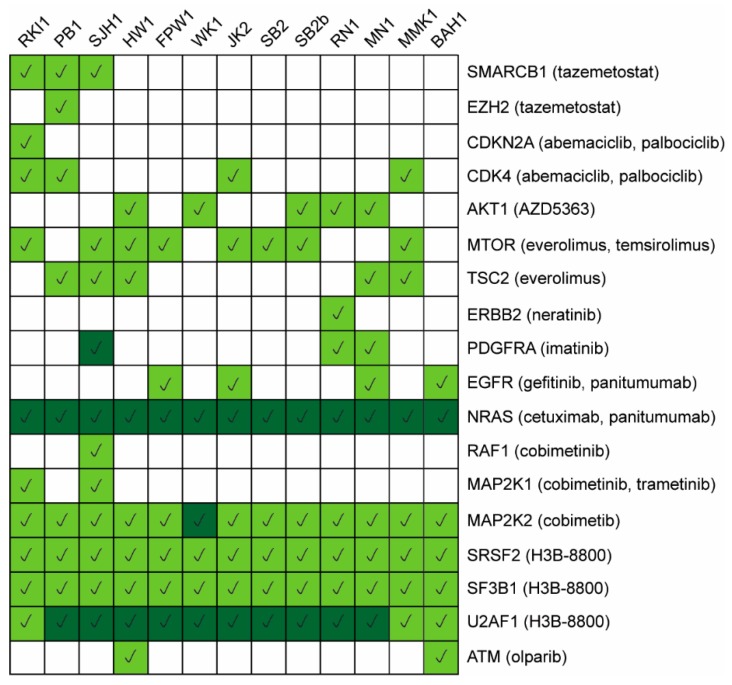
Glioblastoma (GBM) is a treatment-refractory central nervous system (CNS) tumour, and better therapies to treat this aggressive disease are urgently needed. Primary GBM models that represent the true disease state are essential to better understand disease biology and for accurate preclinical therapy assessment. We have previously presented a comprehensive transcriptome characterisation of a panel (n = 12) of primary GBM models (Q-Cell). We have now generated a systematic, quantitative, and deep proteome abundance atlas of the Q-Cell models grown in 3D culture, representing 6167 human proteins. A recent study has highlighted the degree of functional heterogeneity that coexists within individual GBM tumours, describing four cellular states (MES-like, NPC-like, OPC-like and AC-like). We performed comparative proteomic analysis, confirming a good representation of each of the four cell-states across the 13 models examined. Kyoto Encyclopedia of Genes and Genomes (KEGG) pathway analysis identified upregulation of a number of GBM-associated cancer pathway proteins. Bioinformatics analysis, using the OncoKB database, identified a number of functional actionable targets that were either uniquely or ubiquitously expressed across the panel. This study provides an in-depth proteomic analysis of the GBM Q-Cell resource, which should prove a valuable functional dataset for future biological and preclinical investigations.

Keywords: GBM cell-states; glioblastoma (GBM); proteomics; recurrence; therapeutic targets; tumour heterogeneity.


Conflict of interest statement

Authors declare no conflict of interest.

Figures

Figure 1
Figure 1
Proteome mapping of 13 Q-cell cell lines. (A) Graphical illustration of the workflow for glioblastoma (GBM) cell line proteome analysis. GBM primary cell lines were cultured as neurospheres, lysed in SDS-based buffer, trypsin digested by in-solution digestion in biological triplicate. LC–MS/MS with 4 hour runs and CID fragmentation were performed in the LTQ-Orbitrap Elite. (B) 3D-PCA plot. The proteome of thirteen cell lines measured in triplicates segregated into major cell types showing well-correlated triplicates within a cell line. (C) The matrix of 78 correlation plots revealed very high correlations between protein intensities in triplicates (Pearson correlation coefficient 0.82–0.97 between cell types). The colour code follows the indicated values of the correlation coefficient. (D) A bar chart showing the number of total proteins identified in each of the cell lines with false identification rate (FDR) of 1%.
Figure 2
Figure 2
ssGSEA based cell-state scores (A) Heatmap of the z-scored ssGSEA scores of the thirteen cell line proteomes with predicted cell-states on the right. (B) PCA plot showing the distribution of the cell lines across the four cell-states. (C) Heatmap of the z-scored ssGSEA scores of the twelve cell line transcriptomes with predicted cell-states on the right. (Note: SB2 was not analysed by transcriptomics). Abbreviations: MES-like, mesenchymal-like; AC-like, astrocyte-like; OPC-like, oligodendrocyte progenitor cell-like; NPC-like, neural progenitor cell-like.
Figure 3
Figure 3
Depiction of cell-states in 11 GBM cell lines. z-scored expression values of genes that contribute to MES1-like, MES2-like, NPC1-like, NPC2-like, and AC-like metamodules (gene list from [9]). Brown boxes indicate predominant cell-state(s) in each cell line. Colour key: red, high expression; blue, low expression; grey, not detected.
Figure 4
Figure 4
Changing cell-states in a pair-matched recurrent model. (A) z-scored expression values of genes that contribute to MES1-like and MES2-like metamodules (gene list from [9]). Colour key: red, high expression; blue, low expression; grey, no expression. (B) A bar graph of MES-1-like and MES-2-like genes with >2-fold increase in expression in the recurrent model (SB2b) when compared with the primary model (SB2). (C) Kyoto Encyclopedia of Genes and Genomes (KEGG) pathways and gene ontology (GO) molecular function terms enriched in the top 100 most regulated proteins in the recurrent SB2b model when compared to the primary SB2B model. Node size reflects the number of regulated proteins associated with a particular term/pathway. Node colour intensity increases with increasing significance of term enrichment.
Figure 5
Figure 5
Functional analysis of the expressed proteome. Heatmap of proteins (z-scored intensities) belonging to the KEGG cancer pathway. The proteins segregate into three clusters: mesenchymal cluster 1, mesenchymal cluster 2, and neuronal cluster listing the pathways that proteins represent. Dendrogram depicts the similarity in protein profiles among the 13 cell lines. Colour legend: blue, low expression; and yellow, high expression.
Figure 6
Figure 6
Protein expression matrix of targetable proteins. Expression levels (high, dark green; medium to low, light green; white, not detected) of proteins with potential FDA-approved drugs extracted from the OncoKB knowledgebase.

References

    1. Furnari F.B., Fenton T., Bachoo R.M., Mukasa A., Stommel J.M., Stegh A., Hahn W.C., Ligon K.L., Louis D.N., Brennan C., et al. Malignant astrocytic glioma: Genetics, biology, and paths to treatment. Genes Dev. 2007;21:2683–2710. doi: 10.1101/gad.1596707. - DOI - PubMed
    1. Stupp R., Mason W.P., van den Bent M.J., Weller M., Fisher B., Taphoorn M.J., Belanger K., Brandes A.A., Marosi C., Bogdahn U., et al. Radiotherapy plus concomitant and adjuvant temozolomide for glioblastoma. N. Engl. J. Med. 2005;352:987–996. doi: 10.1056/NEJMoa043330. - DOI - PubMed
    1. Louis D.N., Perry A., Reifenberger G., von Deimling A., Figarella-Branger D., Cavenee W.K., Ohgaki H., Wiestler O.D., Kleihues P., Ellison D.W. The 2016 World Health Organization Classification of Tumors of the Central Nervous System: A summary. Acta Neuropathol. 2016;131:803–820. doi: 10.1007/s00401-016-1545-1. - DOI - PubMed
    1. Phillips H.S., Kharbanda S., Chen R., Forrest W.F., Soriano R.H., Wu T.D., Misra A., Nigro J.M., Colman H., Soroceanu L., et al. Molecular subclasses of high-grade glioma predict prognosis, delineate a pattern of disease progression, and resemble stages in neurogenesis. Cancer Cell. 2006;9:157–173. doi: 10.1016/j.ccr.2006.02.019. - DOI - PubMed
    1. Verhaak R.G., Hoadley K.A., Purdom E., Wang V., Qi Y., Wilkerson M.D., Miller C.R., Ding L., Golub T., Mesirov J.P., et al. Integrated genomic analysis identifies clinically relevant subtypes of glioblastoma characterized by abnormalities in PDGFRA, IDH1, EGFR, and NF1. Cancer Cell. 2010;17:98–110. doi: 10.1016/j.ccr.2009.12.020. - DOI - PMC - PubMed

Publication types

LinkOut - more resources